Mastering 15N-DNA Stable Isotope Probing: A Comprehensive Protocol Guide for Microbial Nitrogen Cycle Analysis
This comprehensive guide details the 15N-DNA Stable Isotope Probing (SIP) protocol, a cutting-edge method for linking microbial identity to specific nitrogen transformation processes in complex environments.
Mastering 15N-DNA Stable Isotope Probing: A Comprehensive Protocol Guide for Microbial Nitrogen Cycle Analysis
Abstract
This comprehensive guide details the 15N-DNA Stable Isotope Probing (SIP) protocol, a cutting-edge method for linking microbial identity to specific nitrogen transformation processes in complex environments. Tailored for researchers, scientists, and drug development professionals, the article explores the fundamental principles of SIP technology, provides a step-by-step methodological workflow for application in soil, water, and clinical microbiomes, offers expert troubleshooting and optimization strategies for common pitfalls, and validates the technique through comparisons with alternative methods like 13C-SIP, FISH, and metagenomics. The synthesis empowers researchers to confidently apply 15N-DNA-SIP to uncover novel nitrogen-cycling microbes and elucidate their roles in environmental and biomedical contexts.
What is 15N-DNA-SIP? Unraveling the Fundamentals of Nitrogen Cycle Microbial Tracking
Application Notes
Within the broader thesis on advancing nitrogen cycling research, stable isotope probing (SIP) of nucleic acids, specifically 15N-DNA-SIP, provides a direct, culture-independent method to link microbial phylogenetic identity with specific metabolic functions. This principle is predicated on the incorporation of a heavy isotope (e.g., 15N) from an added substrate into the DNA of actively metabolizing microorganisms. Subsequent density-based separation and molecular analysis identify the labeled microbes. For the N-cycle, this allows the delineation of microbial taxa responsible for processes like nitrification, denitrification, and nitrogen fixation in complex environments.
Key Quantitative Considerations for 15N-DNA-SIP: The successful application of 15N-DNA-SIP hinges on several quantitative parameters that influence labeling and separation efficacy.
Table 1: Critical Quantitative Parameters for 15N-DNA-SIP in Nitrogen Cycling Studies
| Parameter | Typical Target Range / Value | Functional Impact & Rationale |
|---|---|---|
| Isotopic Enrichment of Substrate | ≥ 98 atom% 15N | Maximizes density shift in DNA; reduces required incubation time. |
| Incubation Time | 3-14 days (highly variable) | Must balance sufficient DNA incorporation against microbial community shifts. |
| DNA Density Shift (Δbuoyant density) | ~0.016–0.030 g/mL for 15N | Heavier shift than 13C (~0.036 g/mL); dictates CsCl gradient precision. |
| Required GC-MS Sensitivity for qSIP | Detection of <0.1 atom% excess 15N | Enables quantitative tracking of isotope assimilation across taxa. |
| Gradient Centrifugation | ~44 hrs at 176,000 x g (ultracentrifugation) | Standard condition for separation of 15N-labeled (heavy) and unlabeled (light) DNA. |
| DNA Recovery for Sequencing | Target >50 ng per fraction | Minimum for robust 16S rRNA gene amplicon or metagenomic library prep. |
Detailed Experimental Protocol: 15N-DNA-SIP for Nitrification Studies
This protocol details the steps for identifying active ammonia-oxidizing bacteria (AOB) in soil using 15N-ammonium sulfate.
Part 1: Microcosm Setup and Isotopic Incubation
- Sample Preparation: Homogenize 10 g (wet weight) of fresh soil in a sterile beaker.
- Substrate Addition: Prepare a solution of (15NH4)2SO4 (98 atom% 15N) in sterile deionized water. Apply evenly to soil to achieve a final concentration of 100 µg N per g soil. For a control, set up parallel microcosms with natural abundance (14N) substrate.
- Incubation: Incubate microcosms in the dark at in situ temperature (e.g., 20°C) for 7 days. Maintain moisture at field capacity.
Part 2: DNA Extraction and Density Gradient Centrifugation
- Total Nucleic Acid Extraction: Post-incubation, extract total DNA from 0.5 g soil from each microcosm using a commercial kit (e.g., DNeasy PowerSoil Pro Kit, Qiagen) following manufacturer’s instructions. Quantify DNA via fluorometry (e.g., Qubit).
- Gradient Preparation: For each sample, combine 1–3 µg of extracted DNA with a gradient solution of cesium chloride (CsCl) and gradient buffer (e.g., 0.1 M Tris-HCl, 0.1 M KCl, 1 mM EDTA, pH 8.0) to a final buoyant density of ~1.725 g/mL in a 5.1 mL ultracentrifuge tube. Include a density marker bead for calibration.
- Ultracentrifugation: Balance tubes and centrifuge in a vertical rotor (e.g., Beckman Coulter VT165.1) at 176,000 x g at 20°C for 44 hours.
- Fractionation: Fractionate the gradient from the bottom of the tube into ~12 equal fractions (≈400 µL each) using a syringe pump or fractionation system. Measure the buoyant density of every other fraction refractometrically.
Part 3: Density-Resolved DNA Analysis
- DNA Recovery and Purification: Precipitate DNA from each fraction by adding PEG solution and glycogen, incubating, and pelleting. Wash pellets with 70% ethanol and resuspend in TE buffer.
- Quantitative Analysis: Quantify DNA in each fraction via fluorometry. Plot DNA amount vs. buoyant density to generate a density profile. Identify "heavy" fractions enriched from 15N-treated microcosms relative to the control.
- Molecular Identification: Perform 16S rRNA gene amplicon sequencing (e.g., targeting V4 region with 515F/806R primers) on DNA from "light" and "heavy" fractions. Compare community composition across density fractions and between treatments to identify taxa enriched in the heavy DNA of 15N-treated samples.
Visualizations
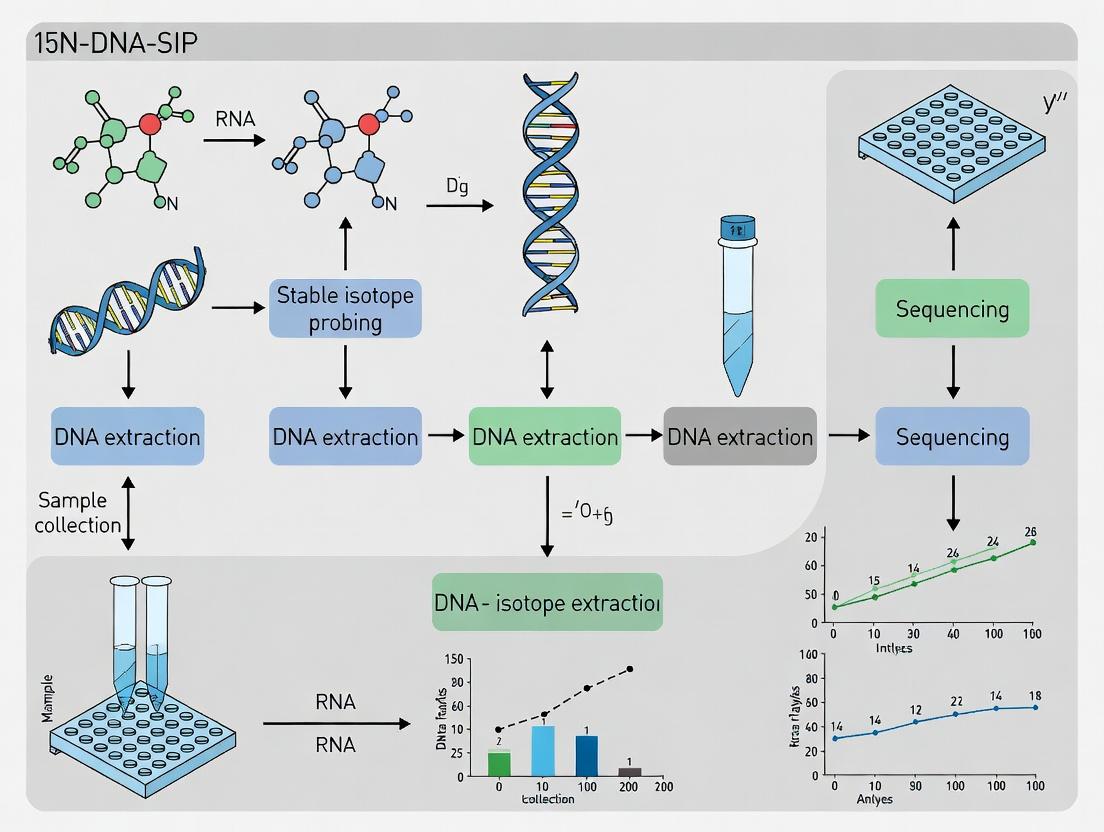
Title: 15N-DNA-SIP Experimental Workflow
Title: Linking Microbes to N-Cycle Functions via SIP
The Scientist's Toolkit
Table 2: Key Research Reagent Solutions for 15N-DNA-SIP
| Item | Function / Purpose in Protocol |
|---|---|
| 98+ atom% 15N-Substrates (e.g., (15NH4)2SO4, K15NO3, 15N2) | Provides the heavy isotope tracer for specific N-cycle pathways (nitrification, denitrification, fixation). |
| Cesium Chloride (CsCl), UltraPure Grade | Forms the density gradient for separation of light (12C/14N) and heavy (13C/15N) nucleic acids. |
| Gradient Buffer (Tris-HCl, KCl, EDTA, pH 8.0) | Maintains stable pH and ionic strength during ultracentrifugation, preserving DNA integrity. |
| Density Marker Beads | Calibrated beads of known density used to accurately determine the buoyant density of gradient fractions. |
| PEG 6000 / Glycogen Solution | Facilitates the precipitation and recovery of low-concentration DNA from high-salt CsCl fractions. |
| Fluorometric DNA Quantitation Kit (e.g., Qubit dsDNA HS) | Enables highly sensitive, specific quantification of dsDNA in fractions, crucial for building density profiles. |
| PCR Reagents for 16S rRNA Genes | Allows amplification of taxonomic marker genes from fractionated DNA for community analysis. |
| Isopycnic Stable Isotope Probing (qSIP) Bioinformatics Pipeline | Software tools for calculating atom% excess and statistical identification of actively labeling taxa from sequencing data. |
Application Notes
Stable Isotope Probing (SIP) with 15N is a powerful tool for linking microbial identity to specific nitrogen transformation processes in complex environments. By introducing 15N-labeled substrates, researchers can trace the incorporation of heavy nitrogen into microbial biomass (DNA/RNA), thereby identifying the active participants in key nitrogen cycle pathways. This approach is central to a thesis focused on refining 15N-DNA-SIP protocols for uncovering novel microbial players and metabolic pathways.
1. Nitrogen Fixation (15N2 Assimilation):
- Application: Identifies diazotrophic microorganisms in diverse habitats (soils, oceans, rhizosphere). 15N2 gas is the definitive substrate, distinguishing true N2 fixers from organisms assimilating combined nitrogen.
- Challenges: 15N2 gas is expensive and requires careful handling to avoid contamination with labeled ammonium or nitrate from impurities. Incubation systems must be airtight.
- Recent Insight: Combined 15N2-SIP with metagenomics has revealed previously uncultured nitrogen-fixing clusters in oligotrophic marine systems.
2. Nitrification (15NH4+ or 15NO2- Oxidation):
- Application: Differentiates between ammonia-oxidizing bacteria (AOB), ammonia-oxidizing archaea (AOA), and nitrite-oxidizing bacteria (NOB). Using 15NH4+ labels both AOA/AOB (first step) and, subsequently, NOB. Using 15NO2- selectively labels NOB.
- Challenges: Requires short incubation times (hours to days) to prevent cross-feeding, where labeled nitrite or nitrate is consumed by denitrifiers or assimilatory organisms. Inhibition of the second oxidation step (e.g., with chlorate) can isolate the first step.
- Recent Insight: 15N-SIP has been crucial in demonstrating the dominance of AOA over AOB in low-pH and low-ammonium soils.
3. Denitrification & Anammox (15NO3- or 15NO2- Reduction):
- Application: Identifies canonical denitrifiers (reducing NO3- to N2O/N2) and anaerobic ammonium-oxidizing (anammox) bacteria. Substrates include 15NO3-, 15NO2-, or combined 15NH4+ + 14NO2- (for anammox).
- Challenges: Anoxic incubation is critical. For denitrification, distinguishing between organisms performing complete denitrification vs. partial reduction (e.g., to N2O) requires complementary gas measurements.
- Recent Insight: SIP studies with 15NO2- in wastewater treatment plants have revealed diverse, uncultured denitrifiers contributing to N2O emissions.
Quantitative Data Summary: Typical 15N-SIP Incubation Parameters
| Process | Target Organisms | Recommended Substrate(s) | Typical 15N Atom % Excess | Incubation Time | Critical Controls |
|---|---|---|---|---|---|
| Nitrogen Fixation | Diazotrophs (e.g., Rhizobium, Trichodesmium) | 15N2 gas | 10-30% | Days to weeks | Killed control; 14N2 control; ambient NH4+ check |
| Ammonia Oxidation | AOA, AOB | 15NH4Cl | 20-60% | 24-168 hours | Inhibition control (e.g., acetylene); time series |
| Nitrite Oxidation | NOB (e.g., Nitrospira, Nitrobacter) | Na15NO2 | 20-50% | 24-120 hours | Inhibition of NH4+ oxidation (e.g., with PTIO) |
| Denitrification | Denitrifiers (e.g., Pseudomonas, Paracoccus) | K15NO3 or Na15NO2 | 30-99% | 24-72 hours | Anoxic control; killed control; N2O measurement |
| Anammox | Anammox bacteria (e.g., "Candidatus Brocadia") | 15NH4Cl + 14NO2- | 30-99% (in N2) | 7-14 days | Strict anoxia; 14NH4+ + 15NO2- control to confirm |
Experimental Protocols
Protocol 1: 15N-DNA-SIP for Soil Nitrification
This protocol details the incubation, DNA extraction, and isopycnic centrifugation for identifying active ammonia oxidizers.
I. 15N-Incubation:
- Weigh 10g of fresh soil into 120ml serum bottles.
- Add aqueous 15NH4Cl (99 atom% 15N) to a final concentration of 2 mM N.
- Seal bottles with butyl rubber stoppers. For time-series, set up multiple bottles.
- Incubate in the dark at in situ temperature. Sacrifice bottles destructively at 0, 24, 48, 96, and 168 hours.
- Control: Set up identical bottles with 14NH4Cl.
- At each time point, extract DNA immediately from 5g soil using a bead-beating kit (e.g., MP Biomedicals FastDNA SPIN Kit for Soil). Store DNA at -80°C.
II. Isopycnic Ultracentrifugation:
- Gradient Preparation: Mix extracted DNA (up to 5 µg) with gradient buffer (0.1 M Tris-HCl, pH 8.0; 0.1 M KCl; 1 mM EDTA) and cesium chloride (CsCl) to a final density of ~1.725 g/ml (refractive index ~1.404) in a 5.1 ml polyallomer ultracentrifuge tube.
- Centrifugation: Use a vertical or near-vertical rotor (e.g., Beckman Coulter VT165.1). Centrifuge at 177,000 x g (44,100 rpm) at 20°C for 40-44 hours.
- Fractionation: Pierce the tube bottom and collect 12-15 equal fractions (~350 µl each) using a fractionation system. Measure the density of every other fraction using a refractometer.
- DNA Recovery: Precipitate DNA from each fraction with PEG 6000/glycogen, wash with 70% ethanol, and resuspend in TE buffer.
III. Analysis:
- Quantify DNA in each fraction (e.g., with PicoGreen).
- Perform qPCR for bacterial and archaeal amoA genes on all fractions to trace 15N-labeled "heavy" DNA.
- Pool "light" and "heavy" DNA fractions (based on qPCR peaks) for 16S rRNA gene amplicon sequencing or metagenomic analysis.
Protocol 2: 15N2 Fixation Assay for Aquatic Samples
This protocol outlines a safe method for 15N2 gas introduction and subsequent sample processing.
I. 15N2-Labeled Water Preparation (Avoiding Gas Contamination):
- Generate 15N2-labeled water in a separate vessel before adding to samples. Degas helium-sparged, sterile water in a sealed serum bottle.
- Inject pure 15N2 gas (99 atom%) into the headspace of the water bottle at a slight positive pressure. Shake vigorously for 2 hours to equilibrate.
- This saturated water is now the stock for additions. This minimizes the risk of introducing labeled NOx impurities directly into experimental microcosms.
II. Sample Incubation:
- Distribute water sample (e.g., seawater) into 12ml Exetainer vials, leaving a small headspace.
- Using a gas-tight syringe, replace 10% of the vial's water volume with the 15N2-saturated water. Cap immediately.
- Incubate under in situ light/temperature conditions for 6-24 hours.
- Controls: Vials with 14N2-equilibrated water, and a time-zero fixation stop (see below).
III. Termination & Filtration:
- Stop biological activity by adding 100 µl of a saturated ZnCl2 solution.
- Filter samples onto pre-combusted GF/F filters (0.7 µm pore size).
- Rinse with particle-free water. Store filters at -80°C for later bulk isotope ratio analysis by IRMS or for nucleic acid extraction and SIP.
Diagrams
Title: 15N-DNA-SIP Core Workflow
Title: Nitrogen Cycle Pathways Targeted by 15N-SIP
The Scientist's Toolkit: Key Research Reagent Solutions
| Item | Function/Benefit in 15N-SIP |
|---|---|
| 15N-Labeled Substrates (15N2 gas, 15NH4Cl, K15NO3, Na15NO2) | High atom% excess (≥98%) is critical for sufficient DNA labeling. Purity (low NOx contamination in 15N2) is essential to avoid false positives. |
| Cesium Chloride (CsCl), Molecular Biology Grade | Ultra-pure salt for forming density gradients. Impurities can inhibit downstream enzymatic analyses (e.g., PCR). |
| DNA Extraction Kit for Soil/Environmental Samples (e.g., DNeasy PowerSoil Pro, FastDNA SPIN Kit) | Designed to co-purity humic acids and other inhibitors, yielding PCR-ready DNA from complex matrices. |
| Fluorometric DNA Quantitation Kit (e.g., Qubit dsDNA HS, PicoGreen) | Essential for accurately measuring low DNA concentrations in gradient fractions; more specific than UV absorbance. |
| qPCR Master Mix & Primers for functional genes (nifH, amoA, nirS, nosZ, 16S rRNA) | Used to screen gradient fractions to identify the "heavy" DNA shift and confirm labeling success. |
| Polyallomer Centrifuge Tubes (e.g., for Beckman VT165.1 rotor) | Withstand the high pressure of ultracentrifugation and are compatible with CsCl solutions. |
| Gradient Fractionation System (e.g., with peristaltic pump and needle) | Allows precise, sequential collection of the entire density gradient with minimal cross-contamination. |
| Isotope Ratio Mass Spectrometer (IRMS) | The gold standard for measuring bulk 15N atom% in biomass or gases, validating SIP incubations. |
| Anaerobic Chamber or Glove Bag | Crucial for setting up denitrification/anammox incubations to maintain strict anoxic conditions. |
Stable Isotope Probing (SIP) is a cornerstone technique in microbial ecology, enabling the direct linkage of microbial identity to substrate utilization. While 13C-DNA-SIP, pioneered in the early 2000s, revolutionized the study of carbon cycling, its application to nitrogen cycling is limited. The 15N-DNA-SIP protocol emerges as a critical methodological advancement, addressing a fundamental gap. Within a broader thesis on 15N-DNA-SIP for nitrogen cycling research, this application note details the evolution, provides explicit protocols, and contextualizes the unique challenges and advantages of 15N-based approaches.
Historical Evolution & Quantitative Comparison
The development of SIP has been driven by the need to move beyond community structure to function. The table below summarizes the key evolutionary milestones and quantitative parameters.
Table 1: Evolution and Technical Comparison of 13C vs. 15N-DNA-SIP
| Aspect | 13C-DNA-SIP (Established Paradigm) | 15N-DNA-SIP (Emerging Focus) | Implication for Nitrogen Cycling Research |
|---|---|---|---|
| Typical Atom % Enrichment | 20-30% (for complex C substrates) | 50-99% (often >95% for pure 15N2, 15NO3-) | Higher enrichment is required due to lower N vs. C content in DNA. |
| Incubation Duration | Days to weeks | Hours to days (for active assimilation) | Faster N turnover rates necessitate shorter incubations to prevent cross-feeding. |
| DNA Yield from Label | Relatively higher (C is ~50% of DNA mass) | Relatively lower (N is ~15% of DNA mass) | Requires more biomass starting material or more sensitive detection. |
| Isopycnic Centrifugation Media | CsCl (Buoyant Density ~1.62-1.75 g/mL) | CsCl + Gradient-Retarding Agent (e.g., GuSCN) | N-labeling induces a smaller BD shift; gradient must be expanded for resolution. |
| Critical BD Shift (Δρ) | ~0.036 g/mL per 10% 13C enrichment | ~0.016 g/mL per 10% 15N enrichment | 15N-induced shifts are ~2.3x smaller, demanding ultracentrifugation precision. |
| Primary Detection Post-Centrifugation | Fraction collection + Quantitative PCR (qPCR) | Ultracentrifugation + Fractionation + High-Throughput Sequencing (e.g., Illumina) | Requires high-resolution fractionation to separate 14N/15N-DNA. |
| Key Challenge | Cross-feeding of 13C-labeled metabolites | Ammonia (15NH4+) toxicity & assimilation regulation; Smaller BD shift. | High 15N concentrations can inhibit microbes; protocol must use tracer-levels. |
| Key Advantage | Well-optimized, broad literature. | Direct link to N-cycling processes (e.g., N2 fixation, nitrification, DNRA). | Unlocks in situ functional assignment for the N cycle. |
Core Protocol: 15N-DNA-SIP for Nitrate Reduction Studies
This protocol outlines the key steps for investigating microbial communities responsible for nitrate reduction (e.g., denitrification, DNRA) using 15NO3-.
Application Note PN-15N-DNRA-01
Objective: To identify active nitrate-reducing microorganisms in an environmental sample (e.g., sediment, soil slurry) through 15N-DNA-SIP.
I. Experimental Setup & Incubation
- Microcosm Preparation: Prepare triplicate serum bottles with 10g of homogenized environmental sample in a defined, anoxic buffer. Maintain strict anoxic conditions using a glove box (Coy Lab Products) or Hungate technique.
- 15N Tracer Addition: Spike microcosms with 15N-labeled nitrate (K15NO3, 98+ atom%) to a tracer-level final concentration (e.g., 50-200 µM). This avoids metabolic inhibition. Prepare control microcosms with equivalent 14NO3.
- Incubation: Incubate in the dark at in situ temperature. Monitor nitrate consumption (e.g., via Ion Chromatography) to determine the optimal harvest point (typically at 30-70% substrate consumption). Incubation time is critical to minimize 15N cross-feeding into non-target organisms.
II. Nucleic Acid Extraction & Purification
- Termination & Harvest: At harvest, freeze samples immediately at -80°C or process directly. Centrifuge to pellet biomass.
- DNA Extraction: Use a bead-beating based extraction kit (e.g., DNeasy PowerSoil Pro Kit, Qiagen) optimized for environmental samples to obtain high-molecular-weight DNA. Include inhibitor removal steps.
- DNA Quantification & Purity: Quantify DNA using a fluorescence assay (e.g., Qubit dsDNA HS Assay, Thermo Fisher). Assess purity via A260/A280 (~1.8) and A260/A230 (>2.0) ratios. A minimum of 2-5 µg DNA per gradient is recommended.
III. Isopycnic Density Gradient Centrifugation This is the most critical and modified step for 15N-SIP.
- Gradient Solution: Prepare a density gradient solution containing:
- 4.8 mL of saturated CsCl solution (1.89 g/mL in 10 mM Tris-HCl, pH 8.0)
- 200 µL of 5 M guanidine thiocyanate (GuSCN) or formamide. This acts as a gradient-retarding agent, expanding the separation between 14N and 15N-DNA.
- 3.0 µg of extracted DNA (in TE buffer, final volume adjusted to 5.2 mL).
- Ultracentrifugation: Load into a 5.1 mL ultracentrifuge tube (e.g., Beckman Coulter Quick-Seal). Balance tubes to within 0.01 g. Centrifuge in a vertical or near-vertical rotor (e.g., Beckman Coulter VTi 65.2) at 177,000 x g (avg) for 40-48 hours at 20°C.
- Fractionation: Using a syringe pump, slowly displace the gradient from the bottom of the tube with water or mineral oil. Collect 18-24 fractions of ~250 µL each into a sterile 96-well plate.
IV. Density Determination & Fraction Processing
- Density Measurement: Measure the buoyant density (BD) of every second fraction using a digital refractometer (e.g., Reichert AR200). Convert refractive index to density using a standard curve.
- DNA Precipitation & Clean-up: Precipitate DNA from each fraction using PEG 6000 (20% w/v final concentration) and glycogen as carrier. Wash pellets with cold 70% ethanol, resuspend in TE buffer, and quantify via qPCR with universal 16S rRNA gene primers.
- "Heavy" DNA Identification: Plot 16S rRNA gene abundance vs. buoyant density. The "heavy" DNA (15N-labeled) will appear as a secondary peak in fractions with a higher BD (~0.016-0.03 g/mL higher) than the main "light" (14N) DNA peak (~1.715 g/mL).
V. Molecular Analysis & Sequencing
- Pooling Strategy: Pool fractions corresponding to the "heavy" DNA peak for each treatment (15N) and corresponding BD fractions from the 14N control.
- Library Preparation & Sequencing: Prepare 16S rRNA gene amplicon (e.g., V4-V5 region) or shotgun metagenomic libraries from pooled DNA. Sequence on an Illumina MiSeq or NovaSeq platform.
- Bioinformatic Analysis: Process sequences (DADA2, QIIME 2). Compare the taxonomic composition of "heavy" 15N-DNA libraries with controls to identify actively nitrate-assimilating/reducing taxa. Statistical tests (e.g., STAMP, DESeq2) are applied to identify significantly enriched taxa in the heavy fraction.
Visualization of Workflow and Challenges
Diagram 1: 15N-DNA-SIP Workflow & Key Challenges
Diagram 2: Comparative Buoyant Density Shifts in DNA-SIP
The Scientist's Toolkit: Key Reagent Solutions for 15N-DNA-SIP
Table 2: Essential Research Reagents & Materials
| Item | Supplier Examples | Function & Critical Notes |
|---|---|---|
| 15N-Labeled Substrates | Cambridge Isotope Laboratories; Sigma-Aldrich | Core tracer. K15NO3, (15NH4)2SO4, 15N2 gas. Critical: Use high atom% purity (>98%) and tracer concentrations. |
| Inhibitor-Free DNA Extraction Kit | Qiagen (PowerSoil Pro); MoBio Laboratories | Must efficiently lyse environmental microbes and remove humic acids, which inhibit downstream steps. |
| Cesium Chloride (CsCl), UltraPure | Thermo Fisher Scientific; MilliporeSigma | Forms the primary density gradient for ultracentrifugation. Optical grade purity is required. |
| Gradient-Retarding Agent (GuSCN/Formamide) | Thermo Fisher Scientific; MilliporeSigma | Critical for 15N-SIP. Expands the CsCl gradient range to resolve the small 15N-induced BD shift. |
| Vertical or Near-Vertical Rotor | Beckman Coulter (VTi 65.2); Thermo Scientific | Essential for achieving high-resolution banding of DNA; fixed-angle rotors are insufficient. |
| Syringe Pump System | Cole-Parmer; New Era Pump Systems | Enables precise, slow fractionation of the ultracentrifugation gradient without disrupting bands. |
| Digital Refractometer | Reichert (AR200); ATAGO | Accurately measures the refractive index of each fraction to calculate buoyant density. |
| PEG 6000 / Glycogen | Thermo Fisher Scientific; MilliporeSigma | Efficient precipitation system for recovering picogram-nanogram quantities of DNA from gradient fractions. |
| Universal 16S rRNA qPCR Assay | Primers: 515F/806R; SYBR Green master mix | Used to profile DNA abundance across fractions to locate "heavy" and "light" DNA peaks. |
Application Notes on Density-Resolved DNA Analysis for SIP
Within the framework of developing a robust 15N-DNA Stable Isotope Probing (SIP) protocol for nitrogen-cycling research, a precise understanding of nucleic acid buoyant density and ultracentrifugation theory is foundational. This separation enables the identification of active microbial assimilators of 15N-labeled substrates (e.g., ammonium, nitrate) in environmental samples.
1. Core Principles: Heavy vs. Light DNA and Buoyant Density
DNA buoyant density in a cesium salt gradient is primarily determined by its base composition (G+C content) and, critically for SIP, the incorporation of stable isotopes. The replacement of 14N with 15N increases the molecular mass of the DNA, altering its physical property of buoyant density.
Table 1: Buoyant Density of DNA Under Different Isotopic States
| DNA Type | Isotopic Composition | Approx. Buoyant Density in CsCl (g/mL) | Key Feature |
|---|---|---|---|
| Light DNA | Natural abundance (e.g., 99.6% 14N) | ~1.71 | Baseline density for community DNA. |
| Heavy DNA | Enriched with 15N (>30% Atom Excess) | ~1.72 - 1.73 | Shift of 0.014–0.018 g/mL indicates active assimilation. |
| 13C-Heavy DNA | Enriched with 13C (>30% Atom Excess) | ~1.74 - 1.75 | Reference for carbon SIP; denser shift than 15N. |
2. Centrifugation Theory: Isopycnic Separation
Isopycnic centrifugation separates molecules solely based on their buoyant density, not size. In a concentrated CsCl gradient subjected to a strong centrifugal field (>200,000 x g), Cs+ ions migrate to form a density gradient. DNA molecules migrate to the position where the gradient density equals their own buoyant density, forming a sharp band.
Table 2: Key Centrifugation Parameters for DNA-SIP
| Parameter | Typical Value/Description | Impact on Separation |
|---|---|---|
| Centrifugation Force | 180,000 - 250,000 x g (avg) | Higher force shortens run time, sharpens bands. |
| Duration | 36 - 72 hours | Equilibrium must be reached for precise separation. |
| Rotor Type | Fixed-angle or Vertical | Vertical rotors reduce run time significantly. |
| Gradient Medium | Cesium Chloride (CsCl) | Forms a stable, self-generating density gradient. |
| Gradient Density Range | 1.66 - 1.76 g/mL | Must span the expected density of light and heavy DNA. |
3. Protocol: Isopycnic Centrifugation for 15N-DNA-SIP
Materials:
- Extracted total DNA from 15N-incubated and control microcosms.
- Gradient buffer (e.g., 0.1 M Tris-HCl, 0.1 M EDTA, pH 8.0).
- CsCl (molecular biology grade).
- Gradient dye (e.g., SYBR Green I).
- Ultracentrifuge and appropriate rotor (e.g., VT-65.2).
- Ultracentrifuge tubes (e.g., 5.1 mL Quick-Seal).
- Fractionation system (e.g., syringe pump, needle, fraction collector).
- Refractometer.
Procedure:
- Gradient Preparation: Mix ~4.5 µg of DNA with gradient buffer and CsCl to a final mass of 4.5 mL and a target density of 1.725 g/mL. Verify density by measuring refractive index (RI) (see Table 3).
- Tube Sealing: Transfer solution to ultracentrifuge tube, balance pairs to within 0.01 g, and heat-seal.
- Centrifugation: Load tubes into a pre-cooled rotor. Centrifuge at 20°C, 200,000 x g (avg) for 48 hours.
- Fractionation: Carefully extract tubes. Puncture the top, then the bottom with needles. Displace the gradient upward using water or mineral oil via a syringe pump, collecting ~200 µL fractions (~20-25 fractions total).
- Density Determination: Measure the RI of every 3rd-5th fraction. Convert RI to buoyant density using a standard curve or equation.
- DNA Recovery: Purify DNA from each fraction via PEG precipitation or desalting columns.
- Analysis: Quantify DNA per fraction (e.g., fluorescence assay) and perform downstream analyses (qPCR, 16S rRNA gene sequencing) to track the distribution and identity of heavy DNA.
Table 3: Refractive Index to Buoyant Density (CsCl, 20°C) Conversion
| Refractive Index (η) | Buoyant Density (ρ, g/mL) |
|---|---|
| 1.3990 | ~1.680 |
| 1.4000 | ~1.690 |
| 1.4010 | ~1.700 |
| 1.4020 | ~1.710 |
| 1.4030 | ~1.720 |
| 1.4040 | ~1.730 |
| 1.4050 | ~1.740 |
4. The Scientist's Toolkit: Key Research Reagent Solutions
Table 4: Essential Materials for DNA-SIP Experiments
| Item | Function in SIP |
|---|---|
| CsCl, Ultra Pure | Forms the isopycnic density gradient for nucleic acid separation. |
| SYBR Green I Nucleic Acid Stain | Allows visual tracking of DNA bands in the gradient under blue light. |
| Gradient Buffer (Tris-EDTA, pH 8.0) | Maintains stable pH and chelates divalent cations to protect DNA. |
| PEG 6000/8000 | Used with salt to precipitate DNA from high-salt CsCl fractions. |
| Desalting Columns (e.g., Micro Bio-Spin) | Alternative method for rapid buffer exchange and CsCl removal from fractions. |
| 15N-Labeled Substrates (e.g., (15NH4)2SO4, K15NO3) | Tracer compounds assimilated by active microbes to produce "heavy" DNA. |
| Fluorometric DNA Quantitation Kit (e.g., Qubit/PicoGreen) | Precisely quantifies low amounts of DNA in gradient fractions. |
5. SIP Workflow and Density Shift Visualization
Title: 15N-DNA-SIP Experimental Workflow
Title: Buoyant Density Shift from 15N Labeling
Within the thesis framework "Advancing a 15N-DNA-Stable Isotope Probing (SIP) Protocol for Elucidating Complex Nitrogen Cycling Networks," the foundational steps of sample selection and experimental design are paramount. This document outlines the critical pre-requisites, providing application notes and detailed protocols to ensure robust, interpretable results. Success in 15N-DNA-SIP hinges not on the molecular techniques alone, but on the initial philosophical and practical decisions made prior to any incubation.
Sample Type Considerations: Application Notes
The choice of sample type dictates the microbial processes accessible for study and the technical challenges encountered during nucleic acid extraction and fractionation.
Table 1: Sample Type Analysis for 15N-DNA-SIP
| Sample Type | Representative N-Cycling Processes | Key Advantages | Critical Challenges & Pre-requisite Actions |
|---|---|---|---|
| Agricultural Soil | Nitrification, Denitrification, N-Fixation, Ammonification | High microbial density & activity; clear link to management practices. | High organic matter inhibits DNA separation. Pre-requisite: Optimize gradient density range; perform rigorous humic acid removal during extraction. |
| Marine/ Aquatic Sediments | Anammox, Denitrification, DNRA | Strong redox gradients define process zones. | Low biomass; presence of inhibitory salts. Pre-requisite: Large volume processing; desalting steps post-extraction. |
| Wastewater Sludge | Nitrification, Denitrification, Anammox | Engineered systems with high process rates. | Extremely diverse community can dilute label incorporation. Pre-requisite: Use high 15N substrate concentration; ensure adequate incubation time. |
| Pure Cultures | Specific pathway analysis (e.g., NO3- reduction) | Definitive mechanism validation; positive controls. | Not representative of in-situ conditions. Pre-requisite: Use as a method validation tool only. |
| Rhizosphere Soil | N-Fixation, Ammonification, Microbial Assimilation | Plant-microbe interactions. | Physical separation of root material required. Pre-requisite: Gentle washing protocols to detach soil without lysing cells. |
Experimental Design Philosophy
The core philosophy is to design an incubation that maximizes 13C-DNA shift while minimizing confounding ecological and technical artifacts.
Principle 1: Substrate Addition Strategy. Use 15N-labeled substrates at concentrations high enough to ensure detectable incorporation but low enough to avoid altering microbial community structure (e.g., >50 at.% 15N, but at or near in-situ concentration levels). Always include a 14N natural abundance control.
Principle 2: Incubation Duration. Must be long enough for active populations to replicate using the labeled N, but short enough to prevent cross-feeding (secondary incorporation by microbes consuming labeled necromass). Pilot time-course experiments are non-negotiable.
Principle 3: Controls are Foundational.
- Negative Control: 14N substrate amendment.
- Time-Zero Control: Killed immediately upon substrate addition (e.g., with sodium azide).
- Process Control: Amendment with a specific inhibitor (e.g., acetylene for nitrification) to confirm expected activity suppression.
Detailed Protocol: Pilot Time-Course Incubation
Objective: To determine the optimal incubation time for maximal 15N incorporation into DNA with minimal cross-feeding.
Materials:
- Soil/sediment sample (fresh, homogenized)
- 15N-labeled substrate (e.g., (15NH4)2SO4 or K15NO3)
- Equivalent 14N-labeled substrate (control)
- Serum vials or microcosms
- Gas chromatography system (for measuring process rates, e.g., N2O)
Procedure:
- Preparation: Weigh 5g (wet weight) of sample into 12 replicate serum vials. Prepare triplicates for each of four time points (T0, T1, T2, T3).
- Amendment: Inject a defined volume of aqueous 15N-substrate solution into 9 vials to achieve a target concentration (e.g., 100 µg N/g soil). Inject 14N-substrate into the remaining 3 vials (T3 control). For T0 controls, pre-add a biocide.
- Incubation: Incubate in the dark at in-situ temperature. Destructively harvest triplicate 15N vials at T1 (e.g., 24h), T2 (e.g., 72h), and T3 (e.g., 168h). Harvest the 14N controls at T3.
- Analysis: Measure process rates (e.g., N2O production via GC) on all vials prior to harvest. Extract total DNA from all samples using a validated extraction kit.
- Assessment: Quantity and quality of DNA should be consistent across all vials. Process rate data will indicate metabolic activity. The optimal time for main SIP incubation is typically the point where process rates are high and DNA yield is stable, before rates plateau (indicating substrate exhaustion and onset of cross-feeding).
Diagrams
Title: SIP Experimental Design Decision Flow
Title: Primary 15N Incorporation vs. Cross-Feeding
The Scientist's Toolkit: Key Research Reagent Solutions
Table 2: Essential Materials for 15N-DNA-SIP Experiments
| Item | Function & Importance in SIP | Example/Specification |
|---|---|---|
| 15N-Labeled Substrates | High isotopic purity (>98 at.% 15N) is critical to maximize label incorporation and subsequent DNA buoyant density shift. | (15NH4)2SO4; K15NO3; 15N2 gas (for fixation studies). |
| Density Gradient Medium | Forms the basis for isopycnic centrifugation. Must be inert and compatible with downstream molecular biology. | OptiPrep (iodixanol) - low viscosity, non-ionic, less inhibitory than CsCl. |
| Ultracentrifuge Tubes | Must withstand very high g-forces (e.g., ~180,000 x g) and be compatible with fractionation systems. | Polypropylene thin-walled tubes for fixed-angle or vertical rotors. |
| Fractionation System | Precisely collects gradient fractions for downstream DNA recovery and analysis. | Automated density fractionator with UV monitor for real-time DNA quantification. |
| DNA Extraction Kit (Soil/Sediment) | Must efficiently lyse diverse cells while removing humic acids, phenolics, and other PCR inhibitors. | Kits with bead-beating and inhibitor removal technology (e.g., DNeasy PowerSoil Pro). |
| Fluorometric DNA Quantification Assay | Accurately measures low DNA concentrations in gradient fractions. More sensitive than absorbance. | Qubit dsDNA HS Assay or equivalent. |
| qPCR Primers | Quantifies 16S rRNA or functional genes (e.g., amoA, nirS, nifH) across fractions to confirm density shift. | Taxon or process-specific primers with validated efficiency. |
| PCR Reagents (Inhibitor Tolerant) | Must perform reliably with environmental DNA, which may contain residual inhibitors. | Polymerase blends designed for inhibitor resistance (e.g., Phusion or AccuPrime). |
Step-by-Step 15N-DNA-SIP Protocol: From Incubation to Gradient Fractionation
Within the broader thesis developing a robust 15N-DNA Stable Isotope Probing (SIP) protocol for linking microbial identity to function in nitrogen (N) cycling, Phase 1 is the critical foundational step. This phase establishes the conditions for active microbial communities to incorporate a 15N-labeled substrate into their biomass, specifically into DNA. Successful incubation is paramount for subsequent density gradient separation and molecular analysis. These Application Notes detail the rationale, key considerations, and a standardized protocol for setting up and executing 15N-substrate incubations for environmental samples, targeting processes like nitrification, denitrification, and ammonium assimilation.
Experimental Protocol: 15N-Substrate Microcosm Incubation
Materials & Pre-Incubation Preparation
- Environmental Sample: Freshly collected soil, sediment, or water. Process (sieving/ homogenization) under conditions mimicking in situ temperature to minimize disturbance.
- 15N-Labeled Substrate: Select based on target N-cycle process (see Table 1). Prepare a sterile, aqueous stock solution at a high concentration (e.g., 100 mM) to minimize addition volume.
- Microcosms: Serum bottles or Falcon tubes with septa for gas exchange/tight sealing, as required.
- Controls: Prepare in parallel: 1) 12C/14N-Substrate Control (natural abundance substrate), 2) Killed Control (autoclaved sample + 15N-substrate), and 3) No-Substrate Control.
- Incubation Chamber: Temperature-controlled shaker or environmental chamber.
Step-by-Step Procedure
- Sample Allocation: Distribute a homogenized amount of sample (e.g., 5-10 g soil, 20-50 ml water) into each pre-labeled microcosm vessel. Perform in triplicate for each treatment/control.
- Substrate Addition: Using a sterile syringe, inject the appropriate volume of 15N-substrate stock solution through the septum (or directly open) to achieve the target concentration (see Table 1). For aerobic processes, briefly flush the headspace with air. For anaerobic processes (e.g., denitrification), flush headspace with He/Ar for 20 minutes before and after addition.
- Incubation Initiation: Place all microcosms in the dark at in situ temperature (or a defined experimental temperature) with constant shaking (if applicable).
- Monitoring & Harvest: Incubate for a predetermined period (e.g., 2-28 days). Periodically sacrifice replicate microcosms to monitor process rates (e.g., 15N-NO3- production via nitrification) and determine the optimal incubation time for sufficient 15N-DNA incorporation. Terminate incubation by flash-freezing the entire sample at -80°C until DNA extraction (Phase 2).
Data Presentation: Substrate & Incubation Parameters
Table 1: Recommended 15N-Substrates and Incubation Parameters for Key N-Cycling Processes
| Target Process | Recommended 15N-Substrate | Typical Working Concentration | Incubation Atmosphere | Key Monitoring Metric (Pre-Harvest) | Optimal Incubation Duration* |
|---|---|---|---|---|---|
| Ammonia Oxidation | (15NH4)2SO4 | 0.5 - 2.0 mM | Aerobic | Accumulation of 15N-NO2- / NO3- | 7-14 days |
| Nitrite Oxidation | Na15NO2 | 0.5 - 1.0 mM | Aerobic | Conversion of 15N-NO2- to 15N-NO3- | 7-14 days |
| Denitrification | K15NO3 or Na15NO3 | 1.0 - 5.0 mM | Anaerobic (He/Ar) | Loss of 15N-NOx & production of 15N-N2/ N2O | 3-10 days |
| DNRA | K15NO3 or Na15NO3 | 1.0 - 5.0 mM | Anaerobic | Production of 15NH4+ from 15N-NO3- | 7-21 days |
| N2 Fixation | 15N2 Gas | >98 atm% 15N, 10-20% v/v headspace | Aerobic or Anaerobic | Incorporation of 15N into bulk biomass | 14-28 days |
| Assimilatory Uptake | (15NH4)2SO4 or K15NO3 | 0.1 - 1.0 mM | As per environment | General biomass 15N enrichment | 2-7 days |
*Duration is sample-dependent and must be determined empirically.
The Scientist's Toolkit: Essential Research Reagents & Materials
Table 2: Key Research Reagent Solutions for Phase 1
| Item | Function & Rationale |
|---|---|
| 15N-Labeled Substrate (≥98 atm%) | High isotopic purity is essential to maximize the density shift in DNA and reduce background from natural abundance 14N. |
| Helium (He) or Argon (Ar) Gas | Creates an anaerobic atmosphere in microcosms for studying reductive N-cycle processes like denitrification. |
| Butyl Rubber Septa & Aluminum Seals | Ensures gas-tight sealing of incubation vessels for anaerobic work and safe substrate addition via syringe. |
| Zinc Chloride (ZnCl2) or Formaldehyde | Used in killed controls to immediately sterilize samples, distinguishing biological from abiotic transformation. |
| Ion Chromatography (IC) Standards | Required for calibrating IC systems to quantitatively monitor the transformation of N species (e.g., NH4+, NO2-, NO3-) during incubation. |
| Gas Chromatography (GC) Standards | Required for calibrating GC systems to quantify gaseous products (N2O, N2) from processes like denitrification. |
Visualized Workflows & Relationships
Title: Phase 1 Workflow for 15N-SIP Incubation
Title: Linking N-Cycle Process to Incubation Parameters
The efficacy of a DNA-based Stable Isotope Probing (SIP) experiment for elucidating nitrogen cycling microbial communities hinges on the quality and purity of the extracted nucleic acids. Phase 2 is critical for obtaining total nucleic acid (TNA) from complex environmental samples (e.g., soil, sediment, sludge) post-incubation with a 15N-labeled substrate. The extracted TNA must be free of co-purifying contaminants (humic acids, phenolics, proteins) that inhibit downstream enzymatic reactions, including isopycnic centrifugation and PCR. This protocol details a robust, modular method optimized for difficult matrices.
Comparative Data: Key Performance Metrics of Extraction Methods
Table 1: Performance comparison of nucleic acid extraction methods for complex samples relevant to SIP.
| Method / Kit | Avg. Yield (μg/g sample) | A260/A280 | A260/A230 | Inhibitor Removal Efficacy | Suitability for SIP |
|---|---|---|---|---|---|
| Phenol-Chloroform (Manual) | 5 - 15 | 1.7 - 1.9 | 1.5 - 2.0 | High | Excellent (for diverse samples) |
| Commercial Soil Kit A | 3 - 8 | 1.8 - 2.0 | 1.8 - 2.2 | Very High | Excellent (optimized for inhibitors) |
| Commercial Soil Kit B | 4 - 10 | 1.7 - 1.9 | 1.5 - 1.9 | Moderate | Good |
| CTAB-Based Protocol | 4 - 12 | 1.7 - 1.9 | 1.6 - 2.1 | High | Excellent (for high humics) |
Detailed Protocol: Modified Phenol-Chloroform Extraction for SIP-Grade TNA
Principle: Cell lysis via mechanical and chemical means, followed by deproteinization using phenol-chloroform-isoamyl alcohol and inhibitor removal via column purification.
Reagents & Solutions:
- Lysis Buffer (pH 8.0): 100 mM Tris-HCl, 100 mM EDTA, 100 mM Sodium Phosphate, 1.5 M NaCl, 1% CTAB.
- Phenol:Chloroform:Isoamyl Alcohol (25:24:1, pH 8.0)
- 20% (w/v) Polyvinylpyrrolidone (PVP)
- Isopropanol and 70% Ethanol
- TE Buffer (pH 8.0): 10 mM Tris-HCl, 1 mM EDTA
- Commercial inhibitor removal column (e.g., OneStep PCR Inhibitor Removal Kit)
Procedure:
- Homogenization: Weigh 0.5 g of sample (wet weight) into a lysing matrix tube.
- Lysis: Add 750 μL of pre-warmed (60°C) Lysis Buffer and 75 μL of 20% PVP. Vortex thoroughly.
- Mechanical Disruption: Process in a bead beater at 6.0 m/s for 45 seconds. Incubate at 70°C for 20 minutes, vortexing every 5 minutes.
- Centrifugation: Centrifuge at 14,000 x g, 4°C, for 5 minutes. Transfer supernatant to a new 2 mL tube.
- Deproteinization: Add an equal volume of Phenol:Chloroform:Isoamyl Alcohol. Vortex vigorously for 30 seconds. Centrifuge at 14,000 x g, 10 minutes, 4°C. Transfer aqueous (top) phase to a new tube.
- Precipitation: Add 0.7 volumes of isopropanol, mix by inversion, and incubate at -20°C for 1 hour. Centrifuge at 14,000 x g, 20 minutes, 4°C. Discard supernatant.
- Wash: Wash pellet with 500 μL of 70% ethanol. Centrifuge at 14,000 x g, 5 minutes. Air-dry pellet for 10 minutes.
- Inhibitor Removal: Resuspend pellet in 100 μL TE Buffer. Apply to an inhibitor removal column per manufacturer's instructions. Elute in 50-100 μL TE Buffer or nuclease-free water.
- Quantification & Storage: Quantify DNA/RNA yield using a fluorometric assay (e.g., Qubit). Assess purity via A260/A280 and A260/A230 ratios. Store at -80°C.
Visualization of Workflow and Critical Pathways
TNA Extraction to SIP Workflow
Inhibitor Removal Mechanisms in TNA Extraction
The Scientist's Toolkit: Essential Research Reagent Solutions
Table 2: Key reagents and materials for TNA extraction from complex samples.
| Item | Function & Rationale |
|---|---|
| Lysing Matrix Tubes (Ceramic/Silica beads) | Provides mechanical shearing for robust lysis of diverse microbial cell walls (Gram+, Gram-, spores). |
| CTAB (Cetyltrimethylammonium Bromide) | Ionic detergent effective in lysing cells and precipitating polysaccharides and humic acids. |
| PVP (Polyvinylpyrrolidone) | Binds and precipitates phenolic compounds, preventing co-purification and enzyme inhibition. |
| Phenol:Chloroform:Isoamyl Alcohol (25:24:1) | Denatures and removes proteins, lipids, and cellular debris; isoamyl alcohol reduces foaming. |
| Inhibitor Removal Spin Column | Silica-based or functionalized resin column for selective binding of remaining humics, pigments, and salts. |
| RNase A (Optional) | For DNA-SIP specific work, can be added post-extraction to degrade RNA, purifying DNA. |
| Fluorometric DNA/RNA Assay Kit | Essential for accurate quantification of low-concentration, inhibitor-free nucleic acids for SIP loading. |
Application Notes
This phase is critical within the 15N-DNA-Stable Isotope Probing (SIP) protocol for resolving 15N-labeled DNA from unlabeled (14N) DNA. Isopycnic ultracentrifugation in cesium chloride (CsCl) density gradients exploits the minute buoyant density difference (~0.016 g/mL) between isotopically distinct DNA molecules. Successful separation enables the subsequent isolation of 13C/15N-enriched nucleic acids from active nitrogen-cycling microorganisms in environmental samples, linking function to phylogeny in microbial ecology studies.
Protocol: Building and Running Discontinuous CsCl Gradients for DNA-SIP
Principle: A pre-formed, discontinuous step gradient minimizes shearing of high-molecular-weight DNA during tube filling and increases sample throughput compared to self-forming gradients.
Materials & Reagent Solutions
Research Reagent Solutions Toolkit:
| Item | Function in Protocol |
|---|---|
| Molecular Biology Grade CsCl | Forms the density gradient. Purity is essential to prevent DNA degradation. |
| Gradient Buffer (GB)(100 mM Tris, 100 mM EDTA, pH 8.0) | Provides chelation (EDTA) and stable pH (Tris) to protect DNA during long centrifugation. |
| SYBR Safe Intercalating Dye | Allows visual banding of DNA under blue light; less mutagenic than ethidium bromide. |
| Refractometer | Critical for precise measurement of CsCl solution density (g/mL) at room temperature. |
| OptiSeal Polyallomer Tubes (5.1 mL) | Tubes designed for vertical rotors; withstand extreme gravitational forces. |
| Nuclease-Free Water | For diluting CsCl stocks to target densities. |
| DNA Loading Solution(GB + 200 ng/µL genomic DNA) | Sample preparation: DNA in gradient buffer for loading onto gradient. |
Detailed Methodology
Part A: Preparation of CsCl Solutions
- Prepare a saturated stock solution of CsCl in Gradient Buffer (~1.89 g/mL). Filter sterilize (0.22 µm).
- Using a refractometer and the following conversion, prepare three working solutions in GB:
- High-Density (HD) Solution: 1.885 g/mL. (Refractive Index ~1.4100)
- Mid-Density (MD) Solution: 1.875 g/mL. (Refractive Index ~1.4085)
- Low-Density (LD) Solution: 1.865 g/mL. (Refractive Index ~1.4070)
- Add SYBR Safe dye to each solution to a final dilution of 1X.
Part B: Building a Discontinuous Gradient
- Label OptiSeal tubes. Using a sterile syringe and blunt needle, slowly layer the solutions in the following order:
- 1.7 mL of HD solution (bottom layer).
- 1.7 mL of MD solution (middle layer).
- 1.7 mL of LD solution (top layer).
- Carefully mix the DNA sample (~1-5 µg in ≤100 µL GB) with the remaining LD solution. Gently layer this DNA-LD mix on top of the pre-formed gradient.
- Fill the tube to the neck with light mineral oil. Seal the tube with an OptiSeal cap.
Part C: Ultracentrifugation Parameters
- Balance tubes to within 0.01 g. Load into a pre-cooled vertical rotor (e.g., Beckman NVT 65.2).
- Run in an ultracentrifuge (e.g., Beckman Optima XPN) under vacuum and temperature control.
- Speed: 177,000 x g (avg) (e.g., 45,000 rpm for NVT 65.2).
- Temperature: 20°C (critical for consistent density).
- Time: 36-40 hours (for fragments >3 kb).
- Acceleration: Slow (to prevent gradient disruption).
- Deceleration: No brake (essential to prevent gradient mixing).
- After the run, carefully unload the rotor.
Part D: Gradient Fractionation & Analysis
- Visualize DNA bands under blue light. 15N-DNA will form a lower band (~0.016 g/mL denser) than the main 14N-DNA band.
- Fractionate the gradient from the bottom (e.g., using a fraction recovery system or syringe). Collect 12-14 fractions of ~350 µL each.
- Measure the density of every fraction using a refractometer.
- Precipitate DNA from each fraction and analyze via quantitative PCR to identify the "heavy" DNA fraction enriched in 15N.
Table 1: Target CsCl Solution Densities for 15N-DNA SIP
| Solution | Target Density (g/mL) | Refractive Index (approx.) | Volume per Tube |
|---|---|---|---|
| High-Density (HD) | 1.885 | 1.4100 | 1.7 mL |
| Mid-Density (MD) | 1.875 | 1.4085 | 1.7 mL |
| Low-Density (LD) + DNA | 1.865 | 1.4070 | 1.7 mL + sample |
Table 2: Standard Ultracentrifugation Run Parameters
| Parameter | Setting | Rationale |
|---|---|---|
| Rotor Type | Vertical (e.g., NVT 65.2) | Shortens path length, decreases run time. |
| Average RCF | 177,000 x g | Sufficient force for isopycnic banding. |
| Temperature | 20°C | Maintains consistent CsCl density & prevents denaturation. |
| Run Time | 36-40 hours | Equilibrium for DNA >3 kb. |
| Acceleration | Slow (Program 5) | Preserves discontinuous gradient during spin-up. |
| Deceleration | No Brake (Program 0) | Preserves gradient after spin for fractionation. |
Title: 15N-DNA SIP Ultracentrifugation Workflow
Title: DNA Banding in a CsCl Equilibrium Gradient
Within the broader methodological thesis on 15N-DNA-Stable Isotope Probing (SIP) for investigating nitrogen-cycling microbial communities, Phase 4 represents the critical terminus of wet-lab experimentation. Following ultracentrifugation (Phase 3), which separates nucleic acids by buoyant density in a cesium trifluoroacetate (CsTFA) gradient, this phase involves the systematic harvesting of gradient fractions, quantification of total nucleic acids, and preparation of samples for downstream molecular analysis (e.g., 16S rRNA gene amplicon or metagenomic sequencing). The fidelity of this phase directly determines the resolution at which 15N-labeled "heavy" DNA can be distinguished from unlabeled "light" DNA, thereby identifying microbes actively involved in assimilating the added 15N-substrate.
Detailed Protocol: Harvesting and Analyzing CsTFA Gradient Fractions
Materials and Equipment
Research Reagent Solutions & Essential Materials
| Item | Function in Protocol |
|---|---|
| Fractionation System (e.g., syringe pump, density gradient fractionator) | Precisely displaces gradient from the bottom/top of the tube for consistent, reproducible fraction collection. |
| Sterile Syringe & Blunt-Ended Needle | Manual alternative for puncturing tube bottom and collecting fractions drop-wise. |
| CsTFA Cushion (1.80 g/mL) | Dense solution at tube bottom to prevent pellet disturbance and provide a clean fractionation start point. |
| Nuclease-Free Water or TE Buffer | Used for dilution of fractions and resuspension of precipitated DNA. |
| Glycogen or Linear Polyacrylamide (Carrier) | Enhances visualization and recovery of minute DNA pellets during precipitation. |
| Ice-Cold Absolute Ethanol & 70% Ethanol | Precipitates nucleic acids from high-salt CsTFA fractions and washes salts away. |
| High-Sensitivity dsDNA Fluorometric Assay Kit (e.g., Qubit, Picogreen) | Accurately quantifies low-concentration double-stranded DNA in fractions. |
| Refractometer | Measures the refractive index (RI) of every fraction to calculate buoyant density (BD). |
| Low-Binding Microcentrifuge Tubes & Plates | Minimizes nucleic acid adhesion to tube walls during processing and storage. |
Step-by-Step Methodology
A. Gradient Harvesting
- Setup: Carefully retrieve ultracentrifuge tubes from the rotor. Avoid agitation. Mount the tube in a fractionation system. Alternatively, for manual harvesting, secure the tube in a stand.
- Fraction Collection: Using a syringe pump or peristaltic pump, displace the gradient from the bottom of the tube by slowly infusing a dense chase solution (e.g., mineral oil or CsTFA cushion) at a rate of ~0.5-1.0 mL/min. Collect sequential fractions (typically 200-500 µL each) into a 96-well deep-well plate or microcentrifuge tubes. Note: Top-down displacement with air is also used but may cause more mixing.
- Record: Accurately record the fraction number and volume.
B. Buoyant Density Determination
- For each fraction, immediately measure the refractive index (RI) using a digital refractometer.
- Calculate the Buoyant Density (BD in g/mL) using the validated linear equation for CsTFA:
BD = (RI * Slope) + Intercept. Example calibration: BD = (RI × 10.927) - 13.593 (Values are instrument-specific and must be calibrated). - Plot BD against fraction number to visualize the gradient shape and DNA distribution.
C. Nucleic Acid Purification & Desalting
- Dilution: Combine each fraction with 2-3 volumes of nuclease-free water or TE buffer to reduce CsTFA viscosity and salt concentration.
- Precipitation: Add glycogen (10-20 µg/mL final) and 2 volumes of ice-cold absolute ethanol. Incubate at -20°C for ≥2 hours or overnight.
- Pellet: Centrifuge at >16,000 × g for 45-60 minutes at 4°C. Carefully decant supernatant.
- Wash: Wash pellet twice with 500 µL of ice-cold 70% ethanol. Centrifuge briefly, remove all ethanol, and air-dry pellet for 5-10 minutes.
- Resuspend: Resuspend DNA in 20-50 µL of nuclease-free water or TE buffer (pH 8.0).
D. DNA Quantification & Analysis
- Quantify DNA in each fraction using a high-sensitivity fluorescence assay following manufacturer protocols.
- Record concentrations (ng/µL).
- Generate a DNA distribution profile by plotting DNA concentration (or total DNA per fraction) against buoyant density.
Table 1: Example Fractionation Data from a 15N-DNA-SIP Experiment
| Fraction # | Volume (µL) | Refractive Index | Buoyant Density (g/mL) | DNA Concentration (ng/µL) | Total DNA (ng) |
|---|---|---|---|---|---|
| 1 (Bottom) | 400 | 1.3772 | 1.680 | 0.15 | 60.0 |
| 2 | 400 | 1.3758 | 1.665 | 0.25 | 100.0 |
| 3 | 400 | 1.3744 | 1.650 | 0.80 | 320.0 |
| 4 | 400 | 1.3730 | 1.635 | 2.50 | 1000.0 |
| 5 | 400 | 1.3716 | 1.620 | 5.80 | 2320.0 |
| 6 | 400 | 1.3702 | 1.605 | 3.20 | 1280.0 |
| 7 | 400 | 1.3688 | 1.590 | 0.90 | 360.0 |
| 8 (Top) | 400 | 1.3674 | 1.575 | 0.10 | 40.0 |
Table 2: Key Calculations & Diagnostic Metrics
| Parameter | Formula/Description | Expected Outcome for Successful SIP |
|---|---|---|
| Gradient Slope | Linear regression of BD vs. Fraction # | Steady, linear decrease (~0.015 g/mL per fraction) |
| "Heavy" DNA Peak | Local maximum in DNA concentration at BD > ~1.72 g/mL (for 15N-DNA) | Distinct peak in +15N treatment, absent in control. |
| "Light" DNA Peak | Local maximum at BD ~1.71-1.72 g/mL (for 12C/14N-DNA) | Present in all treatments. |
| Labeling Threshold | BD where +15N treatment DNA profile diverges from control | Used to define "heavy" fractions for downstream analysis. |
Visualization of Workflows
Title: SIP Phase 4: Fraction Analysis Workflow
Title: Interpreting Buoyant Density & DNA Peaks in SIP
Within the framework of a 15N-DNA-Stable Isotope Probing (SIP) protocol for nitrogen cycling research, the successful fractionation of "heavy" (15N-labeled) and "light" (12N-unlabeled) DNA marks a critical transition. This phase details the subsequent downstream analyses required to identify the active nitrogen-utilizing microorganisms. It encompasses the amplification, sequencing, and bioinformatic interrogation of the heavy DNA, transforming density-resolved nucleic acids into ecological and functional insights.
Application Notes
Objective: To characterize the phylogenetic identity and functional genetic potential of metabolically active microorganisms that incorporated 15N-substrates.
Key Considerations:
- SIP Fraction Fidelity: The selected "heavy" fraction(s) must be validated through quantitative PCR (qPCR) across the density gradient to confirm successful separation from the "light" DNA.
- Amplification Bias: PCR primers and conditions must be carefully chosen to minimize bias against novel or uncommon taxa within the heavy DNA.
- Control Comparisons: Analysis must always include parallel data from the "light" control fractions and time-zero incubations to distinguish enriched, active populations from background populations.
- Bioinformatic Rigor: Statistical confirmation of 15N-enrichment in taxonomic groups is required, moving beyond mere presence/absence in the heavy fraction.
Experimental Protocols
Protocol 5.1: Quantitative PCR (qPCR) for Fraction Validation and Quantification
Objective: To quantify target genes (e.g., 16S rRNA, amoA, nifH, narG) across all density gradient fractions to confirm the density shift and estimate the abundance of active populations.
Methodology:
- Template DNA: Use 1-2 µL of purified DNA from each CsCl gradient fraction.
- Reaction Setup: Prepare a master mix for a 20 µL reaction:
- 10 µL of 2X SYBR Green qPCR Master Mix.
- Forward and Reverse primers (10 µM each), 0.8 µL each.
- Nuclease-free water to 18 µL.
- Add 2 µL of template DNA to each well.
- qPCR Program: Run on a real-time PCR instrument.
- Stage 1: Initial Denaturation: 95°C for 3 min.
- Stage 2: 40 cycles of:
- Denaturation: 95°C for 30 sec.
- Annealing: Primer-specific Tm for 30 sec.
- Extension: 72°C for 45 sec.
- Stage 3: Melt Curve: 65°C to 95°C, increment 0.5°C.
- Analysis: Plot gene copy number (calculated from a standard curve of a plasmid containing the target gene) against fraction buoyant density (g mL-1). A clear peak in the "heavy" fractions (e.g., ~1.72 g mL-1) for the treatment, but not the control, confirms labeling.
Table 1: Representative qPCR Data for amoA Gene Across SIP Gradient Fractions
| Fraction | Buoyant Density (g mL⁻¹) | Control (12C) Copy Number (log₁₀) | 15N-Treatment Copy Number (log₁₀) |
|---|---|---|---|
| 1 (Light) | 1.685 | 6.2 ± 0.1 | 5.9 ± 0.2 |
| 2 | 1.695 | 6.5 ± 0.2 | 6.1 ± 0.1 |
| 3 | 1.705 | 6.8 ± 0.1 | 6.0 ± 0.3 |
| 4 | 1.715 | 5.1 ± 0.3 | 7.5 ± 0.2 |
| 5 (Heavy) | 1.725 | 4.0 ± 0.5 | 8.2 ± 0.1 |
| 6 | 1.735 | 3.5 ± 0.4 | 6.8 ± 0.3 |
Protocol 5.2: PCR Amplification for High-Throughput Sequencing
Objective: To generate amplicon libraries from the heavy DNA for phylogenetic analysis.
Methodology:
- Target Selection: Amplify the 16S rRNA gene (V3-V4 region) for general taxonomy or a functional marker gene (e.g., amoA, nirk, nifH).
- Primers: Use primers with overhang adapters compatible with your chosen sequencing platform (e.g., Illumina).
- Reaction Setup: 25 µL reaction volume.
- 12.5 µL of 2X High-Fidelity PCR Master Mix.
- 1.0 µL each of forward and reverse primer (10 µM).
- 2.0 µL of heavy-fraction DNA template.
- 8.5 µL of PCR-grade water.
- Thermocycling Conditions:
- 95°C for 3 min.
- 25-30 cycles of: 95°C for 30s, 55°C for 30s, 72°C for 45s.
- Final extension: 72°C for 5 min.
- Purification: Clean the amplicon product using a magnetic bead-based clean-up kit. Quantify with a fluorometer.
Protocol 5.3: Bioinformatic Analysis Pipeline
Objective: To process sequencing data and identify 15N-enriched taxa.
Methodology:
- Demultiplexing & Quality Control: Use tools like
bcl2fastqorQIIME 2to assign reads to samples and trim adapters. Apply quality filtering (e.g., DADA2, USEARCH). - ASV/OTU Picking: Generate Amplicon Sequence Variants (ASVs) using DADA2 or deblur, or cluster into Operational Taxonomic Units (OTUs) at 97% similarity.
- Taxonomic Assignment: Classify sequences using a reference database (e.g., SILVA for 16S, FunGene for functional genes).
- SIP-Enrichment Statistics: Calculate enrichment metrics.
- R-Score: The ratio of an OTU/ASV's relative abundance in the heavy fraction vs. its mean relative abundance in all light fractions. R > 1 indicates potential enrichment.
- q-Score: A quantitative measure based on the distribution of sequences across the density gradient. Implement using the
htsiporSIPSimR packages.
- Visualization: Generate bar plots, heatmaps, and phylogenetic trees of significantly enriched taxa.
Table 2: Key Bioinformatic Tools for SIP Analysis
| Tool/Package | Primary Function | Relevance to SIP |
|---|---|---|
| QIIME 2 | End-to-end microbiome analysis | Core pipeline for amplicon data processing and taxonomy. |
| DADA2 | ASV inference from amplicons | High-resolution sequence variant calling. |
| phySIP / htsip (R) | SIP enrichment statistics | Calculates R- and q-scores to identify labeled taxa. |
| ggplot2 (R) | Data visualization | Creates publication-quality plots of enrichment results. |
| MEGAN | Metagenome analyzer | For analyzing shotgun metagenomic data from heavy DNA. |
The Scientist's Toolkit: Key Research Reagent Solutions
| Item | Function in Downstream SIP Analysis |
|---|---|
| High-Fidelity DNA Polymerase | Reduces PCR amplification errors for accurate sequencing of heavy DNA. |
| SYBR Green qPCR Master Mix | Enables quantitative tracking of target genes across density gradient fractions. |
| Dual-Indexed Sequencing Adapters | Allows multiplexing of samples from multiple heavy/light fractions on one sequencing run. |
| Magnetic Bead Clean-up Kits | For efficient purification and size-selection of PCR amplicons prior to sequencing. |
| Fluorometric DNA Quantification Kit | Accurately measures low-concentration DNA from heavy fractions for library prep. |
| SIP-Specific Bioinformatics Pipelines (e.g., phySIP) | Software packages designed to statistically identify isotopically enriched populations. |
Visualizations
Diagram 1: Downstream SIP Analysis Workflow
Diagram 2: Bioinformatics Pipeline for Heavy DNA
Diagram 3: SIP Enrichment Statistics Logic
Within the framework of advancing nitrogen cycling research using 15N-DNA Stable Isotope Probing (SIP), this article presents detailed application notes and protocols. 15N-DNA-SIP enables the direct linking of phylogenetic identity to specific nitrogen transformation functions by tracking the incorporation of a heavy 15N label into the DNA of actively metabolizing microorganisms. The following case studies across three distinct biomes illustrate the protocol's versatility in identifying key functional guilds driving the nitrogen cycle.
Application Note 1: Soil Microbiome – Nitrification in Agricultural Soil
Objective: To identify the active ammonia-oxidizing bacteria (AOB) and archaea (AOA) in a rhizosphere soil under ammonium fertilization.
Protocol: 15N-DNA-SIP for Soil Nitrifiers
- Sample Preparation: Homogenize 10 g of fresh soil (field-moist) with 30 mL of sterile, carbon-free mineral salts medium in a 120 mL serum vial.
- Labeling Incubation: Add (15NH4)2SO4 (99 atom% 15N) to a final concentration of 2.0 mM. Seal vial with a butyl rubber stopper. Incubate in the dark at 25°C for 28 days. Include a control vial with 14NH4Cl.
- DNA Extraction & Quantification: Post-incubation, extract total DNA from 0.5 g soil using a commercial kit (e.g., DNeasy PowerSoil Pro Kit). Quantify DNA using a fluorescent assay (e.g., Qubit dsDNA HS Assay).
- Density Gradient Ultracentrifugation: Mix 3 µg of DNA with 4.2 mL of gradient buffer (0.1 M Tris-HCl, pH 8.0; 0.1 M KCl; 1 mM EDTA) and 4.3 g of cesium chloride (CsCl). Adjust final density to ~1.725 g/mL. Centrifuge in a polyallomer tube using a near-vertical rotor (e.g., Beckman NVT90) at 177,000 × g, 20°C, for 40 hours.
- Fractionation & Analysis: Fractionate the gradient into 12-14 equal fractions (~300 µL). Measure buoyant density (BD) of each fraction using a digital refractometer. Precipitate DNA from each fraction, and use it as a template for qPCR targeting bacterial and archaeal amoA genes. Pool "heavy" (BD > 1.730 g/mL) and "light" (BD < 1.715 g/mL) DNA fractions for downstream analysis.
- Sequencing & Bioinformatics: Amplify the 16S rRNA gene V4 region from heavy and light DNA pools. Sequence on an Illumina MiSeq platform. Process sequences (QIIME2, DADA2). Compare heavy fraction community to light and control fractions to identify 15N-enriched, active nitrifiers.
Key Data Summary:
Table 1: SIP Enrichment Metrics in Agricultural Soil Study
| Parameter | 14N-Control (Light) | 15N-Labeled (Heavy) | Notes |
|---|---|---|---|
| AOB amoA Gene Copies (Heavy Fraction) | 1.2 x 10^3 / g soil | 8.7 x 10^4 / g soil | 72-fold enrichment |
| AOA amoA Gene Copies (Heavy Fraction) | 5.5 x 10^4 / g soil | 1.1 x 10^5 / g soil | 2-fold enrichment |
| Dominant AOB Taxon in Heavy DNA | Nitrosospira sp. (Cluster 3a.2) | >95% relative abundance | Key active population |
| Buoyant Density Shift (BD) | 1.710 - 1.715 g/mL | 1.732 - 1.736 g/mL | Confirms 15N incorporation |
Application Note 2: Wastewater Microbiome – Denitrification in Activated Sludge
Objective: To pinpoint the microorganisms responsible for nitrate (NO3-) reduction in an anoxic wastewater treatment bioreactor.
Protocol: 15N-DNA-SIP for Wastewater Denitrifiers
- Sample Activation: Anaerobically pre-incubate 50 mL of mixed liquor suspended solids (MLSS) in a sealed reactor with 5 mM sodium acetate and 1 mM 14NO3- for 24h at 28°C to activate denitrifying community.
- Labeling Incubation: Sparge reactor with N2 gas. Add 5 mM sodium acetate and 2 mM Na15NO3 (98 atom% 15N). Incubate with gentle stirring until >90% of nitrate is consumed (typically 6-12h). Collect biomass by centrifugation (10,000 × g, 10 min).
- N2 Gas Analysis (Optional): Monitor production of 30N2 (14N15N) and 29N2 (15N15N) via membrane inlet mass spectrometry (MIMS) to confirm denitrification activity and label flow.
- DNA Processing & Ultracentrifugation: Extract DNA from pellet. For 15N-NO3- experiments, use cesium trifluoroacetate (CsTFA) as gradient medium for more effective separation of denitrifier DNA. Mix 2 µg DNA with CsTFA solution (final density 1.62 g/mL). Centrifuge at 180,000 × g, 20°C, for 48+ hours.
- Fractionation & Screening: Fractionate and analyze as in Soil Protocol. Use qPCR targeting nirK, nirS, and nosZ genes to identify heavy fractions containing denitrifier DNA.
- Metagenomic Analysis (Recommended): Perform shotgun metagenomic sequencing on heavy DNA. Assemble contigs, bin genomes, and annotate for denitrification genes (nar, nap, nir, nor, nos) to reconstruct genomes of active denitrifiers.
Key Data Summary:
Table 2: SIP and Metagenomic Findings in Activated Sludge
| Parameter | Result / Value | Functional Implication |
|---|---|---|
| Max nirS Gene Enrichment (Heavy Fraction) | 45-fold increase vs. light | High nitrate/nitrite reduction activity |
| Predominant Heavy Fraction Genus | Thauera | Known canonical denitrifier |
| Key Metabolic Reconstruction | Complete narH-nirS-norB-nosZ operon in a Thauera MAG | Genomic evidence for full denitrification pathway |
| Labeled N Gas Produced (MIMS) | 30N2 (14N15N) peak detected | Confirms coupling of 15N-NO3- reduction to N2 production |
Application Note 3: Human Gut Microbiome – Ammonia Assimilation
Objective: To identify commensal gut bacteria actively assimilating dietary or host-derived ammonia/urea nitrogen in a simulated colon environment.
Protocol: 15N-DNA-SIP for Gut Microbiota (in vitro)
- Inoculum & Medium: Prepare anoxic, complex medium mimicking proximal colon conditions (pH 6.0, peptides, carbohydrates). Inoculate with 10% (w/v) fresh or frozen fecal slurry from a healthy donor.
- Labeling Strategy: Add 15N-urea (99 atom%) or 15NH4Cl (98 atom%) to a final concentration of 5 mM as the primary nitrogen source. Incubate in an anaerobic chamber (N2:CO2:H2, 80:10:10) at 37°C for 48 hours. Include a 14N control.
- Biomass Harvesting: Centrifuge culture (8,000 × g, 15 min, 4°C) to pellet microbial cells. Wash pellet twice in phosphate-buffered saline (PBS).
- DNA Extraction & Isopycnic Centrifugation: Extract DNA using a bead-beating protocol optimized for Gram-positive bacteria. Use CsCl gradients as described in the Soil Protocol. Due to high growth rates, a 24-36 hour centrifugation may be sufficient.
- Fractionation & 16S rRNA Gene Analysis: Process fractions. Perform 16S rRNA gene sequencing (e.g., full-length PacBio SMRT sequencing) on heavy and light DNA to achieve species-level identification of active bacteria.
- Functional Validation: Isolate candidate heavy fraction-dominant species via anaerobic culturing. Test their growth and ammonia assimilation rates with 15N substrates using Isotope Ratio Mass Spectrometry (IRMS).
Key Data Summary:
Table 3: Gut Microbiota SIP Enrichment with 15N-Urea
| Taxon (Species Level) | Relative Abundance in Light DNA | Relative Abundance in Heavy DNA | Putative Role |
|---|---|---|---|
| Bacteroides vulgatus | 8.2% | 31.5% | Primary ammonia assimilator |
| Escherichia coli | 1.5% | 12.8% | Rapid urea/ammonia utilizer |
| Faecalibacterium prausnitzii | 15.1% | 4.3% | Not a primary assimilator under conditions |
| Urease Activity in Heavy Pool | 5.8 U/mg protein | 22.4 U/mg protein | Confirms functional shift |
The Scientist's Toolkit: Key Reagent Solutions
Table 4: Essential Materials for 15N-DNA-SIP Studies
| Item | Function & Application Note |
|---|---|
| 15N-Labeled Substrates (e.g., (15NH4)2SO4, Na15NO3, 15N-urea) | Provides the heavy isotope tracer for metabolic incorporation; choice defines the nitrogen cycling process targeted. |
| Cesium Salts (CsCl for general DNA, CsTFA for high G+C% or 15N-NO3- DNA) | Forms the density gradient for separation of 15N-labeled ("heavy") from unlabeled ("light") DNA. |
| Ultracentrifuge & Near-Vertical Rotor (e.g., Beckman Optima XPN, NVT90 rotor) | Essential hardware for high-speed, long-duration isopycnic centrifugation. |
| DNeasy PowerSoil Pro Kit (QIAGEN) | Standardized, efficient DNA extraction from complex, inhibitor-rich matrices like soil and feces. |
| Digital Refractometer | Precisely measures the buoyant density of each fraction from the centrifuge gradient. |
| Proofgrade Polymerase | High-fidelity PCR enzyme essential for unbiased amplification of DNA from gradient fractions for sequencing. |
| Qubit dsDNA HS Assay Kit | Highly sensitive, specific fluorometric quantification of low-concentration DNA in gradient fractions. |
| Anaerobic Chamber or Serum Vials | Creates and maintains anoxic conditions essential for studying processes like denitrification or gut metabolism. |
Visualizations
Title: 15N-SIP Workflow for Soil Nitrifier ID
Title: N-Cycle Processes & Microbial Actors
Title: DNA-SIP Density Gradient Separation Principle
Troubleshooting the 15N-DNA-SIP Workflow: Solving Common Pitfalls for Optimal Results
Within the broader thesis on developing a robust 15N-DNA-Stable Isotope Probing (SIP) protocol for elucidating active nitrogen-cycling microbiomes, a primary technical challenge is insufficient 15N incorporation into biomarker DNA. This application note addresses the systematic optimization of two critical parameters: labeled substrate concentration and incubation time, to ensure adequate isotopic enrichment for subsequent density gradient separation.
Table 1: Summary of 15N-SIP Optimization Studies from Recent Literature
| Study Focus | Tested Substrate (15N) | Optimal Concentration Range | Optimal Incubation Time | Target Microbial Group | Key Metric for Sufficient Incorporation |
|---|---|---|---|---|---|
| Nitrification Inhibitors | Ammonium sulfate | 0.5 - 2.0 mM | 14 - 28 days | Ammonia-oxidizing archaea/bacteria | ΔBuoyant Density ≥ 0.016 g/mL |
| Rhizosphere N-Cyclers | Urea | 1.0 - 5.0 mg N/g soil | 21 days | Ureolytic bacteria | qPCR shift in heavy fraction > 50% |
| Marine OMZ Communities | Nitrate | 100 - 200 µM | 4 - 7 days | Denitrifiers & anammox bacteria | 13C/15N dual-label detected in 16S rRNA |
| Wastewater Biofilms | Glycine | 10 - 20 atom% in medium | 5 - 10 days | Heterotrophic nitrifiers | DGGE band appearance in heavy gradient fraction |
Table 2: Troubleshooting Guide for Insufficient Incorporation
| Symptom | Possible Cause | Recommended Adjustment |
|---|---|---|
| No DNA in heavy fractions | Incubation time too short; Substrate concentration too low | Increase time in 7-day increments; Increase concentration stepwise (2x). |
| Weak signal in heavy fractions | 15N dilution by ambient N pools; Substrate not bioavailable | Pre-incubate to reduce ambient N; Use more labile substrate form. |
| Non-specific gradient profiles | DNA overload; Incubation too long, causing cross-feeding | Reduce DNA loaded (5-10 ng max); Shorten incubation to primary consumer window. |
Detailed Experimental Protocols
Protocol 1: Determining the Minimum Effective 15N-Substrate Concentration
Objective: To identify the lowest substrate concentration yielding detectable DNA shift in CsCl gradients.
Materials: See "Scientist's Toolkit" below.
Procedure:
- Microcosm Setup: Prepare replicate microcosms (e.g., 1 g soil/5 mL medium in 12 mL exetainer).
- Concentration Gradient: Amend treatments with 15N-substrate (e.g., (15NH4)2SO4) at 0.1, 0.5, 1.0, 2.0, and 5.0 mM. Include a 14N control.
- Incubation: Incubate under optimal in situ conditions (e.g., temperature, moisture) for a standardized period (e.g., 14 days).
- DNA Extraction & SIP: After incubation, extract total DNA using a soil/microbial DNA kit.
- Isopycnic Centrifugation: Prepare CsCl gradient with an initial density of ~1.725 g/mL using 1-5 µg DNA in 4.8 mL. Ultracentrifuge at 177,000 × g, 20°C for 40-48 h.
- Fractionation & Analysis: Fractionate gradient (14-16 fractions). Measure density refractometrically. Quantify target gene (e.g., amoA, nifH) in each fraction via qPCR.
- Determination: The minimum effective concentration is the lowest dose where the peak of target gene abundance shifts to a higher buoyant density (ΔBD ≥ 0.010 g/mL) relative to the 14N control.
Protocol 2: Time-Course Tracking of 15N Incorporation Dynamics
Objective: To identify the incubation window for maximal primary consumer labeling before significant cross-feeding.
Materials: As above.
Procedure:
- Setup Bulk Microcosms: Establish a single, homogeneous microcosm amended with the optimized 15N-substrate concentration from Protocol 1.
- Destructive Sampling: Sacrifice replicate microcosms at time points: 0, 2, 5, 10, 14, 21, and 28 days.
- DNA-SIP & High-Resolution Analysis: Perform SIP as in Protocol 1 for each time point.
- High-Throughput Sequencing: Pool DNA from "heavy" fractions (densities above control peak) for each time point. Perform 16S rRNA gene amplicon sequencing.
- Data Interpretation: Identify taxa whose relative abundance peaks sequentially in the heavy fractions. The optimal incubation time is typically when target primary consumers are most enriched before secondary feeders appear strongly (often between 7-21 days for many N-cyclers).
Visualizations
Title: 15N-DNA-SIP Optimization Strategy Flowchart
Title: 15N Flow from Substrate to DNA in SIP
The Scientist's Toolkit
Table 3: Essential Reagents and Materials for 15N-DNA-SIP Optimization
| Item | Function & Importance in Optimization |
|---|---|
| High-Purity 15N-Substrates (e.g., 98+ atom% 15N (NH4)2SO4, KNO3, urea) | Provides the isotopic label. Purity is critical to calculate exact atom% enrichment and avoid dilution by 14N impurities. |
| Optima Grade CsCl | Forms the density gradient for nucleic acid separation. Lot-to-lot consistency is vital for reproducible gradient profiles. |
| Refractometer | Accurately measures the density of each gradient fraction (critical for correlating BD shift with 15N incorporation). |
| DNA-Binding Fluorescent Dye (e.g., SYBR Green I) | Used to visualize the DNA band in the gradient tube during fractionation, ensuring correct collection. |
| Heavy & Light Reference DNA | Control DNA from organisms grown on 15N or 14N media. Essential for calibrating gradient runs and confirming BD shifts. |
| Inhibitor-Removal DNA Extraction Kit (e.g., for soil/sediment) | Efficiently co-extracts DNA from diverse community members while removing humics that can inhibit downstream qPCR. |
| Target-Specific qPCR Primers/Probes (e.g., for amoA, nirS, nifH) | Quantifies the distribution of functional genes across gradient fractions, objectively measuring the 15N shift. |
| Gradient Fractionation System | A precise pump or needle system to collect uniform fractions from the top/bottom of the ultracentrifuge tube without mixing. |
Within the broader methodological thesis on optimizing a 15N-DNA-Stable Isotope Probing (SIP) protocol for nitrogen cycling research, obtaining high-molecular-weight, high-yield DNA from diverse environmental matrices is a critical, yet often limiting, first step. This application note addresses the common challenges of poor DNA yield and excessive shearing, providing refined extraction protocols tailored for complex samples like soil, sediment, water biomass, and biofilms.
The following table summarizes expected outcomes from optimized versus standard protocols for common matrices in nitrogen cycling studies.
Table 1: Comparison of DNA Yield and Integrity from Different Environmental Matrices
| Matrix Type | Standard Protocol Yield (ng/g or ng/L) | Optimized Protocol Yield (ng/g or ng/L) | Average Fragment Size (Standard) | Average Fragment Size (Optimized) | Key Inhibitor Challenge |
|---|---|---|---|---|---|
| Agricultural Soil | 50 - 200 | 500 - 2,500 | 5 - 10 kb | 20 - 50 kb | Humic acids, divalent cations |
| Marine Sediment | 10 - 100 | 200 - 1,000 | 3 - 8 kb | 15 - 30 kb | Polysaccharides, sulfides |
| Freshwater Biomass | 100 - 500 | 1,000 - 5,000 | 10 - 15 kb | 30 - 70 kb | Mucopolysaccharides |
| Activated Sludge | 200 - 800 | 1,500 - 8,000 | 5 - 12 kb | 20 - 40 kb | Heavy metals, organic polymers |
| 15N-Enriched SIP Microcosms | Varies widely; often 30-50% lower than non-enriched controls due to lower biomass. | Target: 80-100% of control yield. | Often sheared (<10 kb) | Target: >20 kb | Same as base matrix, plus carrier RNA requirement. |
Detailed Experimental Protocols
Protocol 1: Enhanced Lysis and Inhibitor Removal for Mineral Soils and Sediments
This protocol is designed for humic-rich and clay-heavy samples common in nitrogen cycling studies.
Key Materials:
- Sample: 0.5g of soil/sediment from 15N-SIP microcosm.
- Lysis Buffer: 800 µL of pre-warmed (60°C) CTAB-based buffer (2% CTAB, 1.4 M NaCl, 100 mM Tris-HCl pH 8.0, 20 mM EDTA).
- Inhibitor Removal: Polyvinylpolypyrrolidone (PVPP) powder; 5% w/v.
- Precipitation: 10% CTAB solution (in 0.7 M NaCl); Chloroform:Isoamyl Alcohol (24:1); Isopropanol.
- Wash Buffer: Cold 70% ethanol.
- Elution: TE buffer (10 mM Tris-HCl, 0.1 mM EDTA, pH 8.0) or nuclease-free water.
Methodology:
- Pre-treatment: Homogenize 0.5g sample with 0.025g PVPP in a 2 mL bead-beating tube.
- Mechanical Lysis: Add 800 µL CTAB lysis buffer and 0.1mm & 2mm silica beads. Bead-beat at 4°C for 45 seconds at 6.0 m/s, then incubate at 65°C for 20 minutes with gentle inversion every 5 minutes.
- Inhibitor Precipitation: Centrifuge at 12,000 x g, 4°C, 10 min. Transfer supernatant to a new tube. Add 0.1 volume of 10% CTAB/0.7M NaCl, mix, and incubate at 65°C for 10 min.
- Organic Extraction: Extract with an equal volume of Chloroform:IAA (24:1). Centrifuge and transfer aqueous phase.
- DNA Precipitation: Add 0.7 volumes room-temperature isopropanol and 0.1 volume 3M sodium acetate (pH 5.2). Mix by inversion and precipitate at room temperature for 10 min (reduces co-precipitation of salts/humics).
- Pellet Wash: Centrifuge at 12,000 x g, 10 min, 4°C. Wash pellet twice with 500 µL cold 70% ethanol.
- Elution: Air-dry pellet for 5-10 min and resuspend in 50 µL TE buffer.
Protocol 2: Gentle Enzymatic Lysis for Water Biomass and Biofilms
Optimized for Gram-negative and fragile cells prevalent in aquatic nitrogen cycling communities.
Key Materials:
- Sample: Filter biomass from 1-5L water or biofilm scrapings.
- Enzymatic Lysis: Lysozyme (10 mg/mL); Proteinase K (20 mg/mL); SDS (20%).
- Spin Column Purification: Commercial silica-membrane kit with inhibitor removal technology (e.g., DNeasy PowerSoil Pro QIAcube Kit).
- Elution: Pre-warmed (55°C) TE buffer.
Methodology:
- Concentration: Collect biomass on 0.22 µm polyethersulfone filter. Cut filter into strips and place in a 15 mL tube.
- Enzymatic Pre-digestion: Add 1.5 mL of TE buffer with 50 µL lysozyme (10 mg/mL). Incubate at 37°C for 30 min with gentle agitation.
- Chemical Lysis: Add 100 µL SDS (20%) and 25 µL Proteinase K (20 mg/mL). Incubate at 55°C for 1 hour with agitation.
- Binding and Cleanup: Transfer lysate to the provided tube of a commercial kit. Follow manufacturer's protocol, incorporating an extended room-temperature incubation (5 min) after adding binding solution to maximize DNA adsorption to silica.
- Elution: Perform a two-step elution: first with 50 µL, incubate column at 55°C for 5 min, then centrifuge; repeat with a second 30 µL of pre-warmed buffer for a final volume of 80 µL.
Protocol 3: Carrier RNA Supplementation for 15N-Enriched Low-Biomass SIP Fractions
Crucial for recovering trace DNA from dense CsCl gradient fractions.
Key Materials:
- Sample: 200-500 µL of CsCl gradient fraction.
- Carrier: Poly(A) RNA (10 µg/µL), glycogen (20 µg/µL).
- Precipitation: 7M Ammonium acetate; PEG 8000 solution (30% PEG in 1.6M NaCl); absolute ethanol.
- Wash Buffer: 80% ethanol.
Methodology:
- Desalting: Add 1 volume of sterile PBS to the CsCl fraction. Mix.
- Carrier Addition: Add 2 µL of Poly(A) RNA (10 µg/µL) and 1 µL of glycogen (20 µg/µL). Mix thoroughly.
- PEG Precipitation: Add 0.5 volumes of 7M ammonium acetate and 2 volumes of 30% PEG/1.6M NaCl solution. Mix and incubate at room temperature for 1 hour.
- Pellet: Centrifuge at 18,000 x g, 30 min, 20°C. Carefully decant supernatant.
- Wash: Wash pellet with 500 µL of 80% ethanol. Centrifuge at 18,000 x g, 10 min, 4°C. Air-dry for 5 min.
- Resuspension: Resuspend in 20 µL TE buffer.
Visualization of Protocols and Workflows
The Scientist's Toolkit: Essential Research Reagent Solutions
Table 2: Key Reagents for Optimized DNA Extraction from Complex Matrices
| Reagent/Material | Primary Function in Protocol | Key Consideration for SIP Studies |
|---|---|---|
| CTAB (Cetyltrimethylammonium Bromide) | Ionic detergent effective for lysing tough cells (Gram-positive, microbes in soil) and complexing polysaccharides and humic acids. | Critical for humic-rich soil/sediment SIP microcosms. Must be removed completely via subsequent steps to avoid PCR inhibition. |
| Polyvinylpolypyrrolidone (PVPP) | Insoluble polymer that binds polyphenolic compounds (e.g., humic/fulvic acids) via hydrogen bonding. | Added during homogenization to immediately sequester inhibitors released upon lysis. |
| Carrier Poly(A) RNA | Non-coding RNA carrier that co-precipitates with trace amounts of DNA without interfering with downstream enzymatic steps (unlike glycogen with some polymerases). | Essential for recovering nanogram or picogram quantities of 15N-labeled DNA from ultracentrifuge fractions. |
| PEG 8000 (Polyethylene Glycol) | Long-chain polymer that precipitates nucleic acids selectively based on size, in high salt. | Used with carrier RNA for SIP fractions; more selective than ethanol/isopropanol for larger fragments. |
| Pre-warmed Elution Buffer (TE, pH 8.0) | Low-EDTA buffer to resuspend DNA. Warming to 55°C increases elution efficiency from silica membranes or pellets. | Maximizes yield from low-concentration SIP extracts. EDTA concentration kept low to be compatible with downstream enzymatic steps. |
| Silica Membrane Spin Columns | Selective binding of DNA in high-salt, elution in low-salt buffer. Modern versions contain inhibitor-removing compounds. | Ideal for water biomass protocols. Choose kits validated for metagenomics (fragment size >20 kb). |
| Lysozyme & Proteinase K | Enzymatic lysis combo. Lysozyme digests peptidoglycan; Proteinase K digests proteins and inactivates nucleases. | Gentle alternative to harsh mechanical lysis, preserving DNA length in biofilm and planktonic cells. |
Within the context of developing a robust 15N-DNA-Stable Isotope Probing (SIP) protocol for nitrogen cycling research, achieving precise density separation of 15N-labeled from unlabeled DNA is paramount. The core challenge lies in the minute density differences (often 0.01–0.03 g mL-1) between isotopically enriched and natural abundance nucleic acids. Inadequate separation leads to cross-contamination, misassignment of microbial function, and compromised data. These Application Notes detail optimized centrifugation parameters and strategies to ensure cesium chloride (CsCl) or alternative gradient stability for high-resolution 15N-DNA-SIP.
Quantitative Data on Centrifugation Parameters
The efficacy of density separation is governed by the integral of the centrifugal force over time. The following table summarizes optimized parameters for ultracentrifugation in fixed-angle rotors, compiled from recent literature and empirical validation.
Table 1: Optimized Ultracentrifugation Parameters for 15N-DNA-SIP Density Gradients
| Parameter | Standard Range for DNA-SIP | Optimized for 15N-DNA | Rationale & Impact on Gradient Stability |
|---|---|---|---|
| CsCl Starting Density (g mL⁻¹) | 1.70 - 1.72 | 1.725 ± 0.002 | Higher initial density compensates for 15N's smaller buoyant shift vs. 13C. |
| Gradient Volume (mL) | 5 - 7 | ≤ 5.5 | Smaller volume reduces gradient radial thickness, improving resolution. |
| Ultracentrifugation Speed (rpm) | 44,000 - 50,000 | 50,000 - 55,000 | Higher g-force sharpens the gradient and reduces run time. |
| Centrifugation Time (h) | 36 - 48 | 40 - 44 | Balances equilibrium attainment with minimizing DNA degradation. |
| Temperature (°C) | 20 | 18 | Slightly lower temp increases CsCl viscosity, enhancing gradient stability. |
| Acceleration | Max | 9 (Slow) | Prevents premature gradient disturbance during rotor start-up. |
| Deceleration | Max (Brake On) | None (Brake Off) | Critical. Prevents gradient mixing and swirling during rotor stop. |
| Resultant Average g-force (avg g) | ~145,000 | ~205,000 | Increases sedimentation velocity and gradient formation efficiency. |
Table 2: Density Shift (Δρ) and Recovery Metrics for 15N-Labeled DNA
| Nucleic Acid Type | Expected Δρ vs. Unlabeled (g mL⁻¹) | Typical Gradient Fraction Width (mL) | Target Fraction for 15N-DNA (Density g mL⁻¹) |
|---|---|---|---|
| 13C-DNA (Heavy) | +0.036 | 0.4 - 0.6 | 1.73 - 1.74 |
| 15N-DNA (Heavy) | +0.016 | 0.2 - 0.3 | 1.71 - 1.72 |
| Unlabeled (Light) DNA | 0 | 0.6 - 0.8 | 1.68 - 1.70 |
Detailed Protocols
Protocol 1: Forming and Running a High-Resolution CsCl Density Gradient for 15N-DNA
Objective: To create a stable, isopycnic gradient for the separation of 15N-labeled DNA from unlabeled DNA.
Materials: See "The Scientist's Toolkit" below. Procedure:
- DNA Preparation: Purify environmental DNA from 15N-incubated and control samples. Ensure DNA is free of contaminants (humics, proteins, salts) via gel electrophoresis and spectrophotometry (A260/A280 ~1.8, A260/A230 >2.0).
- Gradient Mix Preparation: In a sterile 7 mL opti-seal tube (Beckman Coulter), combine:
- Purified DNA (≥ 2 µg in ≤ 100 µL TE buffer).
- Gradient buffer (e.g., 10 mM Tris-HCl, 1 mM EDTA, pH 8.0) to a final volume of 900 µL.
- Solid CsCl to achieve a precise final density of 1.725 g mL⁻¹. Verify density using a digital refractometer (e.g., Reichert AR200). Target refractive index (RI) = 1.4045.
- Intercalating dye (e.g., GelGreen, 1X final concentration) for visual fractionation.
- Tube Sealing & Balancing: Seal tubes meticulously using a heat sealer. Weigh opposing tubes to within ± 0.001 g. Balance with gradient buffer/CsCl solution.
- Ultracentrifugation: Load tubes into a pre-chilled fixed-angle rotor (e.g., Beckman Coulter MLA-130 or Vit 65.2). Run under conditions specified in Table 1:
- Speed: 55,000 rpm
- Time: 42 hours
- Temp: 18 °C
- Acceleration: Slow (Rate 9)
- Deceleration: No brake
- Post-Run Handling: Carefully extract rotor. Avoid disturbing gradients. Proceed immediately to fractionation.
Protocol 2: Precision Gradient Fractionation and Density Verification
Objective: To accurately collect narrow gradient fractions and determine their exact buoyant density.
Procedure:
- Setup: Mount the sealed tube in a fractionation system. Puncture the tube top with a needle for air displacement.
- Bottom-Up Collection: Slowly inject a dense, immiscible fluid (e.g., Fluorinert FC-40) into the bottom of the tube via a syringe pump at ~500 µL min⁻¹. Collect effluent from the top via a capillary into a 96-well plate or microcentrifuge tubes. Collect 20-25 fractions of 200 µL each.
- Density Measurement:
- Measure the refractive index (RI) of every 3rd fraction using 2 µL on a digital refractometer.
- Convert RI to buoyant density (ρ) using the standard equation: ρ (g mL⁻¹) = 10.9276 * RI - 13.5933.
- Plot density vs. fraction number to visualize the gradient profile.
- DNA Precipitation & Analysis: Pool fractions into "Heavy" (ρ = 1.710–1.715 g mL⁻¹) and "Light" (ρ = 1.685–1.695 g mL⁻¹) pools. Precipitate DNA, wash, resuspend, and quantify via fluorometry (e.g., Qubit). Analyze via 16S rRNA gene qPCR or sequencing.
Visualization
Title: SIP Gradient Workflow and Stability Factors
Title: Theoretical 15N-DNA Gradient Profile
The Scientist's Toolkit: Essential Research Reagent Solutions
Table 3: Key Materials and Reagents for 15N-DNA-SIP Density Gradients
| Item | Function / Role in Addressing Density Separation Challenge | Example Product / Specification |
|---|---|---|
| Ultra-Pure Cesium Chloride (CsCl) | Forms the isopycnic density gradient. Purity is critical to prevent band artifacts and ensure accurate density. | Molecular Biology Grade, ≥99.5% (Thermo Fisher, Sigma). |
| Digital Refractometer | Precisely measures the refractive index of gradient solutions to calculate and verify buoyant density (ρ). | Atago or Reichert Digital, requires < 2 µL sample volume. |
| OptiSeal Polypropylene Tubes | Tubes specifically designed for high-speed ultracentrifugation with minimal deformation. | Beckman Coulter OptiSeal Tubes (13.5 mL or 5.1 mL). |
| Fixed-Angle Ultracentrifuge Rotor | Provides the high g-force necessary for gradient formation and nucleic acid separation. | Beckman Coulter MLA-130 (505,000 x g) or Vit 65.2 (436,000 x g). |
| Gradient Fractionation System | Allows precise, low-disturbance collection of narrow gradient fractions from the tube. | Brandel or Labconco systems, or syringe-pump custom setup. |
| Fluorometric DNA Quantitation Kit | Accurately quantifies low-concentration DNA in gradient fractions without interference from CsCl or dyes. | Qubit dsDNA HS Assay Kit (Thermo Fisher). |
| Nuclease-Free Water & Buffers | Used in gradient preparation and DNA resuspension to prevent enzymatic degradation of sample. | Certified DNase/RNase-free, PCR-grade water (e.g., Invitrogen). |
| Fluorinert FC-40 | Dense, inert, immiscible fluid used to displace gradient from the bottom during fractionation. | MilliporeSigma Fluorinert Electronic Liquid FC-40. |
| Benchtop Microcentrifuge with Vacuum | For efficient precipitation and washing of DNA from fractionated CsCl solutions. | Eppendorf 5425 or similar with vacuum adapter. |
Within the framework of optimizing a 15N-DNA-SIP protocol for elucidating nitrogen-cycling microbial networks, two paramount challenges emerge: cross-feeding and label dilution. Cross-feeding occurs when primary assimilators of the 15N-substrate (e.g., ammonia oxidizers) are metabolically active but release partially labeled or unlabeled metabolites (e.g., nitrite), which are subsequently consumed by secondary consumers (e.g., nitrite oxidizers). This can lead to the false-positive identification of the secondary consumer as a primary utilizer. Label dilution, conversely, happens when the added 15N-tracer is diluted by a large ambient pool of unlabeled (14N) substrate, reducing the enrichment in target organisms and potentially pushing it below detection thresholds. This application note details targeted strategies—pulse-labeling and kill controls—to isolate primary assimilators and account for abiotic processes, thereby refining data interpretation in complex nitrogen cycles.
Table 1: Comparative Outcomes of Continuous vs. Pulse-Labeling SIP Incubations
| Parameter | Continuous Labeling (48h) | Pulse-Labeling (6h Pulse + 42h Chase) | Interpretation |
|---|---|---|---|
| 15N-Enrichment in Primary Assimilators | High (e.g., ~60 at%) | High in target population (e.g., ~55 at%) | Both methods effectively label active assimilators. |
| 15N-Enrichment in Secondary Consumers | Significant (e.g., ~30 at%) | Low to negligible (e.g., <5 at%) | Pulse-chase minimizes label transfer to cross-feeders. |
| Number of "Heavy" DNA OTUs | High (Broad community) | Low (Focused population) | Pulse-labeling yields a more specific primary utilizer profile. |
| Risk of Label Dilution | High over long incubation | Reduced due to short substrate exposure | Pulse limits dilution by microbial turnover and abiotic processes. |
Table 2: Efficacy of Kill Controls in Differentiating Biological Activity
| Control Type | Treatment | Observed 15N in DNA | Conclusion on Process |
|---|---|---|---|
| Live Microcosm | None | High enrichment | Biological assimilation active. |
| Abiotic Kill Control | Autoclaving (121°C, 20 min) | No significant enrichment above background | Excludes chemical/physical binding of label to DNA. |
| Inhibited Kill Control | Formalin (2% v/v) or Sodium Azide (1% w/v) | No significant enrichment above background | Confirms assimilation requires live, metabolically active cells. |
Experimental Protocols
Protocol 1: Pulse-Labeling and Chase for 15N-SIP
Objective: To label primary assimilators of a 15N-substrate (e.g., 15NH4+) while minimizing cross-feeding.
- Microcosm Setup: Prepare triplicate experimental microcosms (e.g., soil slurries, water samples) under relevant environmental conditions (temperature, pH).
- Pulse Phase: Spike microcosms with a high-purity 15N-labeled substrate (e.g., 98 at% 15NH4Cl) to achieve a target concentration (typically 5-10% of the ambient pool). Incubate for a short, defined period (e.g., 2-6 hours). This period must be optimized to be shorter than the doubling time of suspected secondary feeders.
- Chase Phase: Terminate the pulse by either:
- Dilution: Adding a large volume of isotopically natural (14N) substrate at the same concentration to dilute the remaining 15N.
- Filtration/Resuspension: Collecting biomass via gentle filtration (0.22 µm membrane) and resuspending in fresh media containing only 14N substrate.
- Chase Incubation: Continue incubation for a longer chase period (e.g., 42-66 hours) to allow for the replication of primarily labeled DNA.
- Termination & DNA Extraction: Preserve biomass by freezing at -80°C or immediate processing. Extract total DNA using a standardized kit (e.g., DNeasy PowerSoil Pro Kit).
Protocol 2: Establishment of Kill Controls
Objective: To account for abiotic incorporation or background binding of the 15N label.
- Control Preparation: Prepare triplicate kill control microcosms identical to live treatments.
- Abiotic Kill: Autoclave samples at 121°C for 20 minutes on two consecutive days to ensure sterility.
- Inhibited Kill (Alternative): Treat samples with a metabolic inhibitor. Option A: Formalin (2% final concentration, v/v) with 24-hour exposure. Option B: Sodium azide (1% final concentration, w/v). Note: Inhibitors may not be 100% effective and can interfere with downstream chemistry.
- Label Addition: Add the identical amount and type of 15N-substrate to the kill controls as used in live microcosms.
- Incubation & Processing: Incubate under the same conditions and for the same duration as the live pulse (or continuous) labeling experiment. Process for DNA extraction identically.
Visualizations
Diagram 1: Cross-Feeding vs. Pulse-Chase in N-Cycling SIP
Diagram 2: SIP Experimental Workflow with Controls
The Scientist's Toolkit: Key Research Reagent Solutions
Table 3: Essential Materials for 15N-SIP Experiments Addressing Cross-Feeding
| Item / Reagent | Function & Rationale |
|---|---|
| High-Purity 15N Substrate (e.g., 98 at% 15NH4Cl, 15NO3-) | Provides the stable isotope tracer. High purity maximizes enrichment potential and detection sensitivity. |
| Natural Abundance 14N Substrate (e.g., 14NH4Cl) | Essential for preparing the "chase" medium in pulse-labeling experiments to dilute the 15N tracer pool. |
| Metabolic Inhibitors (Formalin, Sodium Azide) | Used to create kill controls by halting biological activity, helping distinguish biotic from abiotic incorporation. |
| Density Gradient Medium (Caesium Chloride, CsCl) | Forms the density gradient during ultracentrifugation for separation of 15N-labeled ("heavy") from unlabeled ("light") DNA. |
| Fluorometric DNA Quantification Kit (e.g., Qubit dsDNA HS) | Precisely quantifies low-concentration DNA in gradient fractions without interference from CsCl. |
| DNA-Specific Stain (e.g., SYBR Green I) | Used to visualize the DNA distribution within the ultracentrifuge tube after fractionation. |
| PCR & Sequencing Primers targeting 16S rRNA/amoA/nxrA/etc. | Enables taxonomic and functional gene analysis of communities in 'heavy' DNA fractions to identify active populations. |
| Ultra-Clean Microcosm Vials (e.g., Glass Serum Bottles) | Minimizes external contamination and adsorption of the label during incubation. |
1. Introduction and Thesis Context Within the broader methodological thesis on refining the ¹⁵N-DNA Stable Isotope Probing (SIP) protocol for nitrogen cycling research, a significant technical challenge arises in complex dual-tracer studies. Researchers often need to trace the assimilation of both nitrogen and carbon substrates simultaneously (e.g., ¹⁵NH₄⁺ and ¹³C-CH₄) to understand coupled biogeochemical processes. However, the standard density gradient centrifugation approach is confounded by spectral interference. The buoyant density (BD) of ¹⁵N-DNA (~1.72 g mL⁻¹) is extremely close to that of ¹³C-DNA (~1.74 g mL⁻¹), causing gradient fractions containing these isotopically distinct DNA populations to co-migrate or overlap, preventing unambiguous assignment. This note details a co-hybridization-based protocol to resolve this interference.
2. Quantitative Data Summary: Buoyant Densities and Key Probes
Table 1: Buoyant Densities (BD) of DNA Types in CsCl Gradients
| DNA Type | Average BD (g mL⁻¹) | Density Range (g mL⁻¹) | Key Isotope |
|---|---|---|---|
| Light DNA (¹²C, ¹⁴N) | 1.71 | 1.69 - 1.73 | - |
| ¹⁵N-enriched DNA | ~1.72 | 1.71 - 1.73 | ¹⁵N |
| ¹³C-enriched DNA | ~1.74 | 1.73 - 1.75 | ¹³C |
| ¹³C & ¹⁵N DNA (Dual) | ~1.75 | 1.74 - 1.76 | ¹³C & ¹⁵N |
Table 2: Example Oligonucleotide Probe Sets for Co-hybridization
| Probe Name | Target Gene | Label | Emission Max (nm) | Function in Assay |
|---|---|---|---|---|
| pmoA-592 | pmoA (Methane oxidation) | Cy3 | 570 | Detects ¹³C-DNA from methanotrophs |
| amoA-633 | amoA (Ammonia oxidation) | Cy5 | 670 | Detects ¹⁵N-DNA from ammonia oxidizers |
| EUB338-I | Bacterial 16S rRNA | FITC | 520 | Total bacterial reference |
3. Core Protocol: Fluorescence In Situ Co-hybridization (FISH) on SIP Fractions
This protocol follows density gradient centrifugation and fractionation as per standard ¹⁵N-DNA-SIP. It is applied to fractions spanning the density range of 1.71-1.75 g mL⁻¹.
Materials & Reagent Solutions:
- Fixed Nucleic Acids: DNA immobilized on positively charged glass slides.
- Hybridization Buffer: 0.9 M NaCl, 20 mM Tris/HCl (pH 7.4), 0.01% SDS, Formamide (concentration optimized per probe).
- Fluorescently Labeled Probes: HRP- or fluorophore-labeled oligonucleotides (see Table 2).
- Washing Buffer: Varies based on hybridization stringency (e.g., 20 mM Tris/HCl, 5 mM EDTA, 0.01% SDS, NaCl concentration varies).
- Tyramide Signal Amplification (TSA) Reagents: If using HRP-labeled probes, includes H₂O₂ and fluorophore-labeled tyramide.
- Mounting Medium: Anti-fade mounting medium with DAPI (4',6-diamidino-2-phenylindole).
Methodology:
- Slide Preparation: Spot equal volumes (e.g., 50-100 ng) of DNA from each density fraction onto a charged slide. Denature DNA by heating at 95°C for 5 min.
- Co-hybridization: Apply 50-100 µL of hybridization buffer containing a mixture of target-specific probes (e.g., Cy3-pmoA and Cy5-amoA) and a general reference probe (e.g., FITC-EUB338). Incubate in a humidified chamber at 46°C for 2-3 hours.
- Stringency Wash: Immerse slides in pre-warmed washing buffer at 48°C for 20 minutes to remove non-specifically bound probes.
- Signal Amplification (if using HRP probes): Rinse slide, apply HRP-labeled probe, incubate, wash, then apply tyramide substrate for 10-30 min.
- Counterstaining and Imaging: Rinse, air-dry, and mount with DAPI-containing medium. Analyze using epifluorescence or confocal microscopy with appropriate filter sets for each fluorophore.
4. Workflow and Data Interpretation Diagram
Diagram 1: Workflow for resolving dual SIP spectral interference.
Diagram 2: Example results table from co-hybridization assay.
5. The Scientist's Toolkit: Essential Research Reagents
Table 3: Key Reagent Solutions for Co-hybridization SIP
| Item | Function/Description | Example Product/Chemical |
|---|---|---|
| CsCl (Optima Grade) | Forms the high-resolution density gradient for SIP. Purity is critical for UV detection. | Beckman Coulter, #356124 |
| Positively Charged Slides | Immobilizes denatured, negatively charged DNA for hybridization. | Thermo Fisher, Superfrost Plus |
| Formamide (Molecular Grade) | Component of hybridization buffer; lowers melting temperature to control stringency. | Sigma-Aldrich, #F9037 |
| Fluorophore-Labeled Probes | Oligonucleotides with covalently attached dyes (Cy3, Cy5, FITC) for direct detection. | Metabion, Eurofins |
| HRP-Labeled Probes & TSA Kit | Enzyme-labeled probes for signal amplification via Tyramide Signal Amplification (TSA). | Thermo Fisher, TSAPlus Kits |
| Anti-Fade Mountant with DAPI | Preserves fluorescence and provides a total cell/counterstain. | Vector Labs, Vectashield + DAPI |
| Stringency Wash Buffers | Precisely formulated saline solutions to remove mismatched probes. | 20mM Tris, varying [NaCl], EDTA, SDS |
Validating 15N-DNA-SIP Data: Comparative Analysis with Complementary Techniques
This application note provides a critical technical and methodological comparison between the well-established 13C-DNA-SIP (Stable Isotope Probing) and the emerging 15N-DNA-SIP protocol, central to a thesis focused on refining 15N-DNA-SIP for nitrogen cycling research. While 13C-DNA-SIP has been the gold standard for linking microbial identity to function for carbon substrates, its application to the nitrogen cycle is often indirect. 15N-DNA-SIP directly targets microbial actors in nitrogen transformations (e.g., nitrification, denitrification, anammox), offering a powerful tool for elucidating complex biogeochemical pathways. This document benchmarks against 13C-DNA-SIP to highlight unique advantages for nitrogen studies and detail the technical adaptations required for successful 15N implementation.
Technical Comparisons: 13C-DNA-SIP vs. 15N-DNA-SIP
Table 1: Core Technical and Practical Comparison
| Parameter | 13C-DNA-SIP | 15N-DNA-SIP | Implication for N-Cycle Studies |
|---|---|---|---|
| Target Element | Carbon (C) | Nitrogen (N) | Direct interrogation of N-transforming populations (e.g., nitrifiers). |
| Typical Tracer | 13C-glucose, 13C-acetate, 13CO2 | 15N-ammonium (15NH4+), 15N-nitrate (15NO3-), 15N2 | Enables differentiation of specific N-process pathways. |
| Isotopic Enrichment Required | High (~20-30 atom% 13C) | Very High (>30-60 atom% 15N) | 15N has a lower natural abundance (0.366%), requiring greater enrichment for detectable DNA shift. |
| Incubation Duration | Days to weeks | Often shorter (hours to days) for oxidation steps; longer for assimilation. | Rapid N-cycling rates may necessitate careful time-series sampling. |
| GC Separation Medium | CsCl gradient (density ~1.6-1.8 g/mL) | CsTFA or CsCl/CsTFA mix (density ~1.5-1.6 g/mL) | DNA buoyant density shift per 15N-atom incorporated is larger than for 13C, but optimal gradients differ. |
| Ultracentrifugation Duration | 36-48 hours (CsCl, ~177,000 g) | Up to 60-72 hours (CsTFA, ~200,000 g) | CsTFA gradients require longer run times for optimal separation of "heavy" DNA. |
| Major Technical Challenge | Cross-feeding of labeled metabolites. | Chemical toxicity of some substrates (e.g., high [NH4+]), lower biomass yield. | Requires substrate concentration optimization and sensitive detection. |
| Key Detection Method | Density-resolved 16S rRNA gene amplicon sequencing. | Density-resolved functional gene (e.g., amoA, nirS, nrfA) and 16S rRNA gene sequencing. | Functional gene analysis is often critical for assigning N-cycling activity. |
Table 2: Quantitative Buoyant Density Shifts in Isopycnic Centrifugation
| DNA Isotopic Composition | Approx. Buoyant Density in CsCl (g/mL) | Approx. Buoyant Density in CsTFA (g/mL) | Notes |
|---|---|---|---|
| Unlabeled (12C, 14N) "Light" DNA | ~1.715 | ~1.550 | Baseline density. |
| 20 atom% 13C-enriched DNA | ~1.720 | ~1.553 | Typical target for 13C-SIP. |
| 50 atom% 15N-enriched DNA | ~1.724 | ~1.560 | 15N incorporation causes a more pronounced shift in CsTFA. |
| Fully labeled (100%) 13C-DNA | ~1.734 | ~1.565 | Theoretical maximum. |
| Fully labeled (100%) 15N-DNA | ~1.742 | ~1.580 | Highlights greater per-atom effect of 15N. |
Detailed Experimental Protocols
Protocol A: Core 15N-DNA-SIP Incubation for Ammonia Oxidizers
Objective: To identify active aerobic ammonia-oxidizing bacteria (AOB) and archaea (AOA) in soil.
Materials:
- Environmental sample (e.g., 5g fresh soil).
- Mineral salts medium (without N).
- 15N-ammonium sulfate ((15NH4)2SO4, 98+ atom% 15N).
- Sterile serum bottles or microcosms.
- Control: 14N-ammonium sulfate.
Procedure:
- Microcosm Setup: Disperse soil into sterile bottles. Prepare triplicate amended microcosms with 15N-(NH4)2SO4 at an ecologically relevant concentration (e.g., 100 µg N/g soil). Prepare 14N controls and unamended controls.
- Incubation: Incubate in the dark at in situ temperature. For ammonia oxidation, duration may be 7-28 days, depending on activity. Sub-samples can be taken over time for chemical analysis (15NO2-/15NO3- production via GC-MS or IRMS).
- Termination & DNA Extraction: Harvest microcosms by centrifugation. Perform total DNA extraction using a bead-beating and column-based kit (e.g., DNeasy PowerSoil Pro Kit). Quantify DNA yield and purity.
- Isopycnic Centrifugation (CsTFA Gradient): a. Prepare DNA solution (≤ 1 µg in 100 µL TE buffer) with gradient buffer and CsTFA to a final refractive index (RI) of ~1.3850 (density ~1.55 g/mL). b. Load into a 5.1 mL ultracentrifuge tube (e.g., Beckman Quick-Seal). c. Centrifuge in a vertical or near-vertical rotor (e.g., Beckman VTi 65.2) at 200,000 × g, 20°C, for 65 hours. d. Fractionate gradient (~12-14 fractions) using a fractionation system or manually by displacement with water. Measure RI of each fraction.
- Quantification & Analysis: a. Precipitate DNA from each fraction. b. Quantify DNA in each fraction (e.g., with PicoGreen) to create a density-resolved profile. c. Select "heavy" (RI < corresponding to density shift) and "light" fractions for downstream PCR of 16S rRNA and functional genes (amoA for AOB/AOA). d. Perform high-throughput sequencing and comparative statistical analysis to identify 15N-enriched populations.
Protocol B: Benchmarking 13C-DNA-SIP for Cross-Validation
Objective: To parallel 15N-SIP experiments with a 13C-SIP assay to identify heterotrophic microbes that may co-metabolize or cross-feed.
Procedure:
- Set up parallel microcosms with 13C-acetate or 13C-CO2 (for autotrophs) as the sole C source.
- Incubate for a relevant time frame (days to weeks).
- Perform isopycnic centrifugation using a CsCl gradient (starting RI ~1.4030, density ~1.72 g/mL). Centrifuge at 177,000 × g, 20°C, for 44 hours.
- Fractionate and analyze as in Protocol A, noting the different density profile.
Visualizations
Title: 15N-DNA-SIP Experimental Workflow
Title: Key N-Cycle Pathways and Target Genes for 15N-SIP
The Scientist's Toolkit
Table 3: Essential Research Reagent Solutions for 15N-DNA-SIP
| Item | Function/Benefit | Example/Specification |
|---|---|---|
| 15N-Tracer Compounds | Provide the isotopically heavy substrate to link activity to specific microbes. | 15N-Ammonium sulfate, 15N-Nitrate, 15N2 gas (98+ atom% purity). |
| CsTFA Salt | Forms the high-density gradient for separating 15N-labeled "heavy" DNA from "light" DNA. | Tris-CsTFA, pH 8.0; preferred over CsCl for 15N-SIP due to steeper density gradient. |
| Ultracentrifuge & Rotor | Creates the high g-force required for isopycnic separation of nucleic acids. | Beckman Coulter Optima XE with VTi 65.2 vertical rotor (or equivalent). |
| Fractionation System | Precisely collects sequential fractions from the centrifuged density gradient for analysis. | Brandel or Labconco system, or syringe pump displacement setup. |
| Refractometer | Measures the refractive index (RI) of each gradient fraction to determine buoyant density. | Digital bench-top refractometer (e.g., Reichert AR200). |
| Fluorometric DNA Quant Kit | Sensitively quantifies the often low amounts of DNA recovered from gradient fractions. | Quant-iT PicoGreen dsDNA Assay Kit. |
| Functional Gene Primer Sets | Amplifies marker genes for specific nitrogen transformation processes from fractionated DNA. | amoA (AOB/AOA), nirS/K (denitrifiers), nrfA (DNRA), hzsB (anammox). |
| High-Sensitivity PCR Mix | Enables PCR amplification from nanogram or picogram quantities of template DNA from fractions. | OneTaq Hot Start Master Mix with GC Buffer or similar. |
This Application Note is framed within a broader thesis investigating nitrogen cycling in soil microbiomes using 15N-DNA-Stable Isotope Probing (SIP). While 15N-DNA-SIP identifies microorganisms actively assimilating labeled nitrogen, it does not directly reveal the genetic basis or expressed pathways of this activity. Correlation with metagenomics (MG; assessing functional potential) and metatranscriptomics (MT; assessing expressed functions) is critical to validate the link between taxonomic identity from SIP and actual microbial metabolism. This integrated approach moves beyond "who is there" and "who is active" to answer "what are they doing and how?"
Application Notes: Integrating SIP with Meta-Omics
Rationale for Correlation
- MG validates functional potential: The metagenome from the heavy SIP fraction confirms whether the 15N-assimilating taxa possess genes for specific N-cycling pathways (e.g., nirK, amoA, nifH).
- MT validates in-situ activity: The metatranscriptome from the same sample (pre-SIP) confirms whether these genes are being expressed at the time of sampling, contextualizing SIP activity.
- Triangulation of evidence: Strong correlation occurs when: 1) A taxon is enriched in the heavy 15N-SIP fraction, 2) Its metagenome contains relevant N-cycling genes, and 3) These genes show high expression levels in the MT data.
Key Quantitative Insights from Recent Studies (2022-2024)
Recent studies integrating SIP with meta-omics reveal critical quantitative relationships. The following table summarizes key findings on the correlation between SIP-enriched taxa and their genetic potential/activity.
Table 1: Summary of Recent Integrated SIP & Meta-Omics Studies in Nitrogen Cycling
| Study Focus (Year) | Key SIP-Enriched Taxa | Relevant N-Cycle Genes Found in MG (Heavy Fraction) | Fold-Change in MT Expression (Heavy vs. Light / Control) | Key Correlation Insight |
|---|---|---|---|---|
| Agricultural Soil Nitrification (2023) | Nitrosospira clade (AOA), Nitrospira | AOA amoA, amoB, amoC; Nitrospira nxrB | AOA amoA: 8.5x; Nitrospira nxrB: 12.3x | MT confirmed specific expression of assimilation pathways (e.g., glnA) in SIP-enriched taxa. |
| Peatland DNRA (2022) | Geobacter, Anaeromyxobacter | nrfA (DNRA), narG (Nitrate Reduction) | nrfA in Geobacter: 15.7x | Strongest MG/MT correlation was for taxa with >10% isotopic enrichment (DNA). |
| Rhizosphere N2 Fixation (2024) | Bradyrhizobium, Azospirillum | nifH, nifD, nifK | Overall nifH: 22.1x; in Bradyrhizobium: 18.3x | MG from heavy SIP fraction contained 95% of nif genes detected in bulk soil MG. |
| Marine OMZ Anammox (2023) | “Candidatus Scalindua” | hzsA, hdh | hzsA: 5.8x; Gene expression lagged behind 15N incorporation by ~24h. | SIP identified active anaerobes; MT revealed associated expression of N-transport genes. |
Detailed Experimental Protocols
Protocol A: Integrated Sample Processing for 15N-SIP, MG, and MT
Title: Co-Processing of Samples for Tripartite Analysis. Objective: To generate matched DNA for SIP & MG, and RNA for MT from the same initial sample set.
Materials:
- Environmental sample (e.g., soil, sediment).
- RNAlater or DNA/RNA Shield.
- Phenol:Chloroform:Isoamyl Alcohol (25:24:1).
- Isopycnic centrifugation reagents (see Toolkit).
- DNase I (RNase-free).
- cDNA synthesis kit (e.g., SuperScript IV).
- PCR purification kits.
Procedure:
- Field Sampling: Aseptically collect triplicate samples.
- For SIP/MT: Immediately preserve ~2g in 5ml DNA/RNA Shield. Homogenize. Store at -80°C.
- For 15N-Incubation: Collect fresh, sieved sample for microcosm setup with 15N-substrate (e.g., (15NH4)2SO4, K15NO3).
- Nucleic Acid Co-Extraction (Pre-SIP Sample for MT & Bulk MG):
- Follow a validated co-extraction protocol (e.g., RNeasy PowerSoil Total RNA Kit with optional DNA elution).
- RNA Fraction: Treat with DNase I. Quantify with Qubit RNA HS Assay. Check integrity (RIN >6.5) via Bioanalyzer. Proceed to Protocol B for MT library prep.
- DNA Fraction (Bulk): Purify. Quantify (Qubit dsDNA HS). Store at -20°C for bulk metagenome sequencing.
- 15N-DNA-SIP Procedure:
- Incubate fresh microcosms with 15N-substrate (typically 5-10 atom% 15N final, 1-28 days).
- Terminate, extract total DNA using a soil DNA kit (e.g., DNeasy PowerSoil Pro).
- Perform isopycnic density gradient centrifugation (see Toolkit).
- Fractionate gradient. Measure density of fractions (refractometer).
- Quantify DNA in each fraction (qPCR with universal 16S rRNA gene primers).
- Pool "Heavy" (enriched 15N-DNA) and "Light" (12N-DNA) fractions separately. Desalt and concentrate.
- Sequencing Library Preparation:
- Metagenomics (Heavy/Light SIP & Bulk DNA): Use 1ng DNA with Nextera XT or Illumina DNA Prep kit. Sequence on Illumina NovaSeq (2x150bp, ~20-40 Gbp per library).
- Metatranscriptomics: Use Protocol B.
Protocol B: Metatranscriptomic Library Preparation from Environmental RNA
Title: Stranded RNA-Seq Library Prep for MT. Objective: To generate strand-specific, ribosomal RNA-depleted cDNA libraries for sequencing.
Materials:
- Total environmental RNA (from 3.1).
- Ribo-Zero Plus rRNA Depletion Kit (Bacteria & Archaea).
- Stranded Total RNA Prep Ligation Kit (Illumina) or NEBNext Ultra II Directional RNA Kit.
- SPRIselect beads.
- Thermal cycler.
Procedure:
- rRNA Depletion: Use 50-100ng total RNA. Follow Ribo-Zero Plus protocol to remove prokaryotic rRNA.
- Fragmentation & cDNA Synthesis: Fragment enriched RNA (94°C, 8 min). Synthesize first-strand cDNA using random primers and reverse transcriptase. Synthesize second-strand cDNA incorporating dUTP to preserve strand specificity.
- Library Construction: End-repair, A-tailing, and ligation of unique dual-index adapters. Clean up with SPRIselect beads (0.8x ratio).
- Strand Selection & Amplification: Treat with Uracil-Specific Excision Reagent (USER) to degrade the second strand (dUTP-labeled). Perform 10-12 cycles of PCR amplification.
- Validation & Quantification: Assess library size distribution (Bioanalyzer/TapeStation). Quantify via qPCR (KAPA Library Quant Kit). Pool libraries equimolarly.
- Sequencing: Sequence on Illumina NovaSeq 6000 (2x150bp), targeting 50-100 million read pairs per sample.
Data Integration & Analysis Workflow Diagram
Diagram Title: Workflow for SIP-MG-MT Data Integration & Analysis
Functional Validation Logic Diagram
Diagram Title: Logic Flow for Validating Functional Activity
The Scientist's Toolkit: Research Reagent Solutions
Table 2: Essential Materials for Integrated 15N-SIP - Meta-Omics Workflow
| Item (Vendor Example) | Function in Integrated Workflow |
|---|---|
| DNA/RNA Shield (Zymo Research) | Preserves nucleic acid integrity in situ immediately upon sampling for accurate MT and bulk MG snapshots. |
| 15N-Labeled Substrates (e.g., Cambridge Isotopes) | Provides the tracer for SIP incubations (e.g., 15NH4Cl, K15NO3, 15N2). Purity >98 atom% 15N is critical. |
| Caesium Chloride (CsCl) / OptiPrep (Cosmo Bio, Sigma) | Forms the density gradient for ultracentrifugation in SIP. OptiPrep is a less hazardous alternative to CsCl. |
| RNeasy PowerSoil Total RNA Kit (Qiagen) | Co-extracts DNA and RNA suitable for downstream MG and MT from tough environmental matrices. |
| Ribo-Zero Plus rRNA Depletion Kit (Illumina) | Removes prokaryotic (and optionally eukaryotic) rRNA to enrich mRNA for MT, drastically improving functional resolution. |
| Nextera XT DNA Library Prep Kit (Illumina) | Rapid, low-input library prep for metagenomic sequencing of multiple SIP fractions and bulk DNA. |
| KAPA Library Quantification Kit (Roche) | Accurate qPCR-based quantification of sequencing libraries for precise, equimolar pooling. |
| BBTools suite (DOE JGI) | Open-source software for quality trimming, read merging, and rRNA filtering of MT data. |
| MetaWRAP pipeline | Bioinformatics pipeline for binning, refinement, and quantification of MAGs from MG data, assignable to SIP fractions. |
| DESeq2 (R package) | Statistical analysis of differential gene/transcript abundance between conditions (e.g., Heavy vs. Light SIP fractions). |
Synergy with Single-Cell Techniques (FISH-microautoradiography, NanoSIMS)
Application Notes
The integration of 15N-DNA Stable Isotope Probing (SIP) with single-cell techniques represents a transformative approach in nitrogen cycling research, linking metabolic function to phylogenetic identity at the single-cell resolution. This synergy directly addresses a core challenge in microbial ecology: identifying which specific members of a complex community are actively assimilating nitrogen substrates.
1.1. FISH-microautoradiography (FISH-MAR):
- Primary Application: Identifying and quantifying substrate uptake (e.g., 15N-ammonium, 15N-nitrate) by specific phylogenetic groups in situ. Cells that actively incorporate the radiolabeled (e.g., 14C or 3H co-label) or stable isotope-enriched substrate produce silver grains in the overlying photographic emulsion, which are visualized concurrently with fluorescent phylogenetic probes.
- Synergy with 15N-DNA-SIP: FISH-MAR acts as a rapid screening and validation tool. Prior to labor-intensive SIP density gradient centrifugation, FISH-MAR can confirm active N-substrate uptake by suspected key players in a given environment, informing SIP incubation design. Post-SIP, FISH-MAR can provide visual confirmation of substrate assimilation by populations recovered in heavy DNA fractions.
- Quantitative Output: Provides counts of substrate-positive cells as a percentage of probe-positive cells, offering an activity index for specific populations.
1.2. NanoSIMS (Nanoscale Secondary Ion Mass Spectrometry):
- Primary Application: Measuring isotopic enrichment (e.g., 15N/14N, 13C/12C) at the subcellular level with extremely high sensitivity (down to 50 nm resolution). It can map isotopic incorporation in single cells that have been identified via prior labeling (e.g., with halogen in situ hybridization, HALO-FISH).
- Synergy with 15N-DNA-SIP: NanoSIMS provides the ultimate functional validation for SIP. Cells from heavy SIP fractions can be spotted onto slides, identified phylogenetically via FISH, and then analyzed by NanoSIMS to directly quantify their 15N atomic percent enrichment, conclusively linking the heavy DNA to a cell with demonstrably high N assimilation. It can also reveal intra-population metabolic heterogeneity.
- Quantitative Output: Provides precise atomic percent (at%) 15N enrichment values for individual cells, isotopic ratios, and elemental maps.
Table 1: Comparison of Synergistic Single-Cell Techniques with 15N-DNA-SIP
| Feature | FISH-microautoradiography | NanoSIMS | 15N-DNA-SIP (Core) |
|---|---|---|---|
| Primary Readout | Visual grain formation from radiolabel uptake | Isotopic ratio (e.g., 15N/14N) imaging | Buoyant density shift of DNA |
| Resolution | Single-cell | Subcellular (~50 nm) | Population (genome) |
| Throughput | Moderate (10s-100s of cells/image) | Low (individual cells) | High (community genomic DNA) |
| Quantitative Nature | Semi-quantitative (activity index) | Highly Quantitative (at% enrichment) | Quantitative (density shift) |
| Key Synergy Role | Pre-screening & visual validation | Definitive functional & isotopic validation | Provides heavy DNA for downstream identification |
| Typical 15N Enrichment Detected | Requires co-label (e.g., 14C) or long incubation | ~0.5 at% 15N (or lower) | ~30 at% 15N (in DNA) |
Detailed Protocols
Protocol: Coupling FISH-MAR with 15N-DNA-SIP Workflow
This protocol validates active 15N-substrate uptake by target organisms before or after SIP.
A. Incubation and Sample Fixation:
- Incubate environmental samples with a mixture of 15N-labeled substrate (e.g., 15NH4Cl) and a radiolabeled analog (e.g., 14C-HCO3- for autotrophs or 3H-labeled substrate).
- Terminate incubation with filter-sterilized paraformaldehyde (final conc. 2-4%). Fix for 1-3h at 4°C.
- Wash cells 3x in 1x PBS and store in PBS:Ethanol (1:1) at -20°C.
B. FISH-microautoradiography:
- Apply fixed sample to gelatin-coated microscope slides. Dehydrate through an ethanol series (50%, 80%, 96%; 3 min each).
- Perform standard FISH protocol with HRP-labeled oligonucleotide probes and tyramide signal amplification (TSA).
- Dip slides in liquid photographic emulsion (e.g., Ilford K.5) under safelight conditions. Air-dry and expose in a light-tight box at 4°C for 5-14 days.
- Develop slides using developer and fixer according to emulsion manufacturer's instructions.
- Counterstain with DAPI and mount. Image using epifluorescence and transmitted light microscopy. Silver grains (from radiolabel) appear over 15N/14C-assimilating cells fluorescing from FISH.
Protocol: Validating SIP Heavy Fractions via HALO-FISH-NanoSIMS
This protocol confirms high 15N enrichment in phylogenetically identified cells from heavy SIP fractions.
A. Retrieval and Preparation of Heavy DNA Cells:
- After ultracentrifugation of 15N-DNA-SIP gradients, collect the "heavy" DNA fraction (typically buoyant density >1.72 g/mL for 15N).
- Precipitate the DNA, but instead of proceeding to molecular analysis, resuspend the nucleic acid pellet in a minimal volume of sterile TE buffer or nuclease-free water.
- Spot 1-2 µL of the heavy fraction suspension onto a clean, pre-sterilized silicon wafer or gold-coated slide. Air dry.
- Fix cells on the wafer with 1% paraformaldehyde for 10 min. Dehydrate with ethanol.
B. HALO-FISH Labeling:
- Perform FISH using oligonucleotide probes conjugated to a halogen tag (e.g., iodine for 127I detection in NanoSIMS).
- Alternatively, use catalyzed reporter deposition (CARD)-FISH with halogenated tyramides (e.g., Br-tyramide).
- This provides a clear isotopic signature (127I or 79Br) for locating target cells in the NanoSIMS.
C. NanoSIMS Analysis:
- Coat the sample wafer with a thin conductive layer (e.g., gold or carbon).
- Load into the NanoSIMS instrument (e.g., CAMECA NanoSIMS 50L).
- Select analysis areas using the ion-induced secondary electron image.
- Pre-sputter the area with the primary Cs+ ion beam to remove the surface coating and reach a stable secondary ion yield.
- Simultaneously collect secondary ions for 12C14N-, 12C15N-, 127I- (or 79Br-), and other relevant masses (e.g., 32S-).
- Analyze data using imaging software (e.g., OpenMIMS, L'image). Regions of interest (ROIs) are drawn around individual cells identified by the halogen signal. Calculate 15N at% enrichment = [15N/(14N+15N)] * 100 for each cell.
Diagrams
Workflow for Synergy of 15N-SIP and Single-Cell Techniques
The Scientist's Toolkit: Research Reagent Solutions
Table 2: Essential Materials for Synergistic Single-Cell 15N Analysis
| Item | Function & Specification | Example Product/Catalog |
|---|---|---|
| 15N-Labeled Substrates | High-purity (>98 at% 15N) compounds to trace N assimilation pathways. | 15N-Ammonium chloride, 15N-Nitrate, 15N2; Cambridge Isotope Laboratories |
| Halogenated Tyramides | Critical for HALO-FISH; provides stable halogen (Br, I) signal for NanoSIMS cell location. | Br-tyramide, I-tyramide; supplied in Alexa Fluor Tyramide SuperBoost Kits (Thermo Fisher) or custom synthesis. |
| HRP-Labeled Oligonucleotide Probes | For CARD-FISH & HALO-FISH; enables high-sensitivity detection and signal amplification. | Custom probes with 5' or 3' horseradish peroxidase (HRP); Biomers.net or Thermo Fisher. |
| Photographic Emulsion | For microautoradiography; captures beta particles from radiolabeled substrate uptake. | Ilford K.5 emulsion or Carestream Kodak NTB emulsion. |
| Cs+ Source | Primary ion source for NanoSIMS; essential for generating negative secondary ions (CN-). | Standard component of CAMECA NanoSIMS instruments. |
| Density Gradient Medium | For ultracentrifugation in SIP; forms stable gradient for DNA separation. | OptiPrep density gradient medium (iodixanol); Sigma-Aldrich. |
| Nuclease-Free Water & Buffers | To prevent degradation of DNA during retrieval from SIP gradients and spotting for NanoSIMS. | Molecular biology grade water, TE buffer (pH 8.0). |
| Silicon Wafer or Gold Slides | Conductive, flat substrate required for NanoSIMS sample mounting and analysis. | 5x5 mm silicon wafers (UniversityWafer), gold-coated coverslips. |
This application note is framed within a broader thesis investigating the optimization of a 15N-DNA-SIP protocol for elucidating nitrogen-cycling microbial communities in complex environments. A core challenge in SIP is accurately distinguishing active assimilators from background noise. This document provides a detailed, side-by-side comparison of the traditional "Heavy-Light" SIP approach and the more recent quantitative SIP (qSIP) method, with a focus on sensitivity, resolution, and practical implementation for researchers in microbial ecology and environmental drug development.
Core Principle Comparison
Traditional Heavy-Light SIP: Operates as a binary, density-centric separation. After incubation with a heavy isotope (e.g., ¹⁵NH₄⁺), total community DNA is separated via isopycnic ultracentrifugation in a density gradient. Fractions are collected and typically analyzed via fingerprinting (e.g., DGGE, TRFLP) or clone libraries from "heavy" and "light" density fractions. Identification of active taxa is based on their presence in the heavy fraction.
Quantitative SIP (qSIP): Functions as a quantitative, isotope-incorporation-centric method. It uses high-resolution density gradient fractionation coupled with qPCR or amplicon sequencing on all gradient fractions. The shift in DNA density distribution for each taxon (operational taxonomic unit, OTU) is quantified relative to a control (¹⁴N). The degree of heavy isotope incorporation is calculated, providing a per-taxon atom percent excess (APE) or atom fraction estimate, which is a direct measure of isotopic enrichment and therefore activity.
The key difference lies in sensitivity and resolution. qSIP's quantitative framework offers superior detection of isotopic enrichment, especially for taxa with low levels of incorporation or low abundance.
Table 1: Methodological and Sensitivity Comparison
| Feature | Traditional Heavy-Light SIP | Quantitative SIP (qSIP) |
|---|---|---|
| Core Output | Binary: Presence/Absence in heavy fraction. | Continuous: Isotopic enrichment (APE) per taxon. |
| Detection Limit | Lower; requires substantial isotope incorporation to shift DNA to separable density. | Higher; can detect minimal incorporation (<1 APE) by modeling distribution shifts. |
| Quantification | Qualitative or relative (based on band intensity). | Absolute isotopic incorporation for each taxon. |
| Resolution | Low. Confounded by genomic G+C content effects on DNA density. | High. Accounts for G+C content by modeling expected "light" density. |
| Statistical Power | Low. Often lacks replication at the fractionation level. | High. Incorporates replication and bootstrapping to estimate uncertainty (95% confidence intervals). |
| Throughput & Cost | Lower cost per sample, but lower information yield. | Higher cost due to multi-fraction sequencing/qPCR, but significantly higher information yield. |
| Key Advantage | Simple, established, good for strong assimilators. | Sensitive, quantitative, identifies assimilators across the enrichment spectrum. |
Table 2: Example Sensitivity Data from Literature (Hypothetical 15N-SIP Scenario)
| Taxon | Abundance (%) | Traditional SIP: Detected in Heavy? | qSIP: Mean ¹⁵N APE (95% CI) | qSIP: p-value |
|---|---|---|---|---|
| Nitrosospira sp. | 0.5 | Yes | 12.5 (11.8 – 13.3) | <0.001 |
| Pseudomonas sp. | 5.2 | No | 1.2 (0.3 – 2.1) | 0.02 |
| Bacillus sp. | 10.1 | No | 0.8 (-0.1 – 1.7) | 0.08 (NS) |
| Background DNA | N/A | N/A | 0.07 (Baseline) | N/A |
NS = Not Significant. This table illustrates qSIP's ability to detect and provide confidence intervals for low-level assimilators (e.g., Pseudomonas) missed by the traditional method.
Detailed Experimental Protocols
Protocol 4.1: Traditional 15N Heavy-Light DNA-SIP
I. Microcosm Incubation & DNA Extraction
- Prepare environmental samples (soil, sediment, water) with ¹⁵N-labeled substrate (e.g., ¹⁵NH₄Cl, ¹⁵NO₃⁻) and parallel ¹⁴N controls.
- Incubate under conditions relevant to your N-cycling process (e.g., aerobic/anaerobic, specific temperature/time).
- Terminate incubation, extract total genomic DNA from all samples using a bead-beating and column-based kit. Pool replicates if necessary.
II. Isopycnic Ultracentrifugation
- Prepare a gradient solution of cesium chloride (CsCl) with gradient buffer (e.g., 0.1M Tris-HCl, 0.1M KCl, 1mM EDTA, pH 8.0) and the fluorescent intercalating dye Gradient Dye (e.g., bisBenzimide). Target initial buoyant density (BD) ~1.725 g/mL.
- Mix ~1-5 µg of DNA with the CsCl solution in an ultracentrifuge tube (e.g., QuickSeal).
- Seal tubes and ultracentrifuge in a vertical or near-vertical rotor (e.g., VTi 65.2) at ~177,000 g (avg) for 44 hours at 20°C.
III. Fractionation & Analysis
- Fractionate the gradient from bottom to top into ~20-30 equal-volume fractions using a fractionation system or manually with a syringe pump.
- Measure the buoyant density of every nth fraction using a refractometer.
- Precipitate DNA from all fractions (using PEG or isopropanol).
- Resuspend DNA and perform PCR-DGGE/TRFLP or clone library construction specifically on "light" (BD ~1.715 g/mL) and "heavy" (BD >1.730 g/mL) fractions.
- Identify active assimilators as those with bands/peaks present in the ¹⁵N-heavy fraction but absent in the corresponding ¹⁴N-heavy fraction and both light fractions.
Protocol 4.2: Quantitative 15N-SIP (qSIP)
I. Incubation, Extraction, & Ultracentrifugation (Steps as in 4.1 I & II)
- Critical: Maintain strict replication (e.g., n=3-5 microcosms per treatment).
- Critical: Process ¹⁵N-treatment and ¹⁴N-control samples identically and in parallel through all steps.
II. High-Resolution Fractionation & Quantification
- Fractionate each gradient into a minimum of 12-15 fractions. More fractions (e.g., 20-30) improve resolution.
- Precipitate and purify DNA from every fraction.
- Quantitative Step: For each fraction, perform:
- qPCR with universal 16S rRNA gene primers to generate a density distribution curve for total bacterial/archaeal DNA.
- OR, prepare amplicon sequencing libraries (e.g., 16S V4 region) for each fraction from each replicate. This is the standard for modern qSIP.
III. Bioinformatic & Statistical Analysis
- Process sequencing data through a standard pipeline (DADA2, QIIME2, mothur) to obtain an OTU (or ASV) table.
- For each OTU in each sample (replicate), model its DNA density distribution using the quantified reads across fractions.
- Calculate the weighted mean buoyant density (BD_w) for each OTU in each ¹⁵N and ¹⁴N replicate.
- Perform a t-test or ANOVA to compare the mean BD_w of each OTU between ¹⁵N-treatment and ¹⁴N-control replicates.
- Calculate isotopic enrichment:
- Atom Percent Excess (APE) = APEtreatment - APEcontrol
- Where APE = (BD_w - 1.646) / 0.098 (approximate formula for ¹⁵N-DNA; slope requires calibration).
- Use bootstrapping (resampling fractions/replicates) to generate 95% confidence intervals for the APE of each OTU. An OTU is a significant assimilator if its 95% CI does not overlap zero.
Diagrams
The Scientist's Toolkit: Essential Reagent Solutions
Table 3: Key Research Reagents & Materials for 15N-DNA-SIP
| Item | Function in 15N-SIP | Specification Notes |
|---|---|---|
| ¹⁵N-Labeled Substrate | Tracer for N-cycling activity. | E.g., ¹⁵NH₄Cl (98+% AP), ¹⁵NO₃⁻; choice depends on process studied (ammonification, nitrification, denitrification). |
| Cesium Chloride (CsCl) | Forms the density gradient for isopycnic centrifugation. | Molecular biology grade, high purity. Prepare stock solution with gradient buffer to desired initial density. |
| Gradient Buffer | Stabilizes DNA and maintains pH during centrifugation. | Typically 0.1M Tris-HCl, 0.1M KCl, 1mM EDTA, pH 8.0. Filter sterilize. |
| BisBenzimide Dye | Fluorescent DNA intercalator for visualizing gradient bands. | Use at a low concentration (e.g., 0.1 mg/mL) to minimize effects on DNA density and PCR. |
| DNA Extraction Kit | Isolates high-quality, high-molecular-weight gDNA from complex matrices. | Use a bead-beating mechanical lysis kit validated for environmental samples (soil, sediment). |
| Ultracentrifuge & Rotor | Generates the high g-forces for density gradient separation. | Requires a vertical or near-vertical rotor (e.g., Beckman VTi 65.2). QuickSeal tubes and a tube sealer are essential. |
| Fractionation System | Precisely collects gradient fractions. | Can be a purpose-built system (e.g., Brandel) or a syringe pump with a needle piercing the tube bottom. |
| Refractometer | Measures the buoyant density of gradient fractions. | Critical for calibrating fraction number to density. |
| PCR/QPCR Reagents | Amplifies target genes from fractionated DNA. | For qSIP, use a robust master mix suitable for potentially inhibitory samples from CsCl gradients. |
| High-Fidelity Polymerase & Sequencing Kit | For amplicon library preparation from all fractions (qSIP). | Essential for the high-resolution, quantitative analysis of qSIP. |
| Bioinformatics Pipeline | Processes sequencing data and performs statistical qSIP analysis. | QIIME2 with plugins like q2-sip or R packages (htsip, Stableisotope) are commonly used. |
1. Introduction within the Context of 15N-DNA-SIP for Nitrogen Cycling
Stable Isotope Probing (SIP) of DNA with 15N-labeled substrates is a powerful tool for linking microbial identity to specific nitrogen transformation processes (e.g., nitrification, denitrification, N-fixation). However, the quantitative interpretation of 15N-DNA-SIP data is inherently constrained by methodological limitations. This application note assesses the critical limitations of resolution, detection thresholds, and quantitative capabilities, providing protocols to empirically define these boundaries for robust experimental design and data interpretation in nitrogen cycling research.
2. Core Limitations: Definitions and Quantitative Benchmarks
The efficacy of 15N-DNA-SIP is governed by three interrelated limitations, summarized in Table 1.
Table 1: Core Quantitative Limitations in 15N-DNA-SIP
| Limitation | Definition | Typical Range/Threshold in 15N-DNA-SIP | Primary Influencing Factors |
|---|---|---|---|
| Isotopic Resolution | The minimum difference in buoyant density (BD) required to separate labeled ("heavy") and unlabeled ("light") DNA. | 0.003 – 0.007 g mL⁻¹ (BD difference) | Centrifuge rotor type, runtime, gradient medium, DNA fragment length. |
| Detection Threshold | The minimum 15N-atom% enrichment in microbial DNA required for detectable shift in BD. | ~20–30 15N-atom% excess. | Genome G+C content, labeling time, substrate assimilation efficiency. |
| Quantitative Capability | The ability to correlate BD shift or "heavy" fraction abundance to actual rates of N assimilation. | Semi-quantitative; linearity often lost at high enrichment. | Isotope dilution, cross-feeding, genomic 15N incorporation heterogeneity. |
3. Experimental Protocols for Assessing Limitations
Protocol 3.1: Empirical Determination of Isotopic Resolution Objective: To determine the minimum BD separation achievable between unlabeled and fully labeled DNA under standard ultracentrifugation conditions. Materials: CsCl, gradient buffer (e.g., 0.1 M Tris-HCl, 0.1 M KCl, 1 mM EDTA, pH 8.0), Optima MAX-XP or equivalent ultracentrifuge, fixed-angle or vertical rotor (e.g., MLA-130), refractometer. Procedure:
- Extract genomic DNA from a pure culture (e.g., Escherichia coli) grown on 100% 14N and 100% 15N substrates (e.g., 15NH₄Cl).
- Prepare separate gradients for each DNA type. For each, mix DNA (≈2 µg) with gradient buffer and CsCl to a final refractive index (RI) of 1.4030 (≈1.72 g mL⁻¹ final density).
- Centrifuge at 177,000 × g (e.g., 50,000 rpm in MLA-130) at 20°C for 48-72 hours.
- Fractionate the gradient (e.g., into 12-15 fractions). Measure the RI of every fraction.
- Calculate BD from RI: BD = (RI * 13.287) - 13.593.
- Locate the peak BD for 14N-DNA and 15N-DNA. The difference is the maximum achievable shift.
- To define resolution, mix 14N and 15N DNA at a 1:1 ratio, process as above, and determine if density profiles show distinct, resolvable peaks. The smallest BD difference yielding two peaks defines the practical resolution limit.
Protocol 3.2: Determining the 15N Detection Threshold Objective: To establish the minimum 15N-atom% enrichment in DNA that produces a measurable BD shift from the 14N-DNA baseline. Materials: As in Protocol 3.1, plus mixtures of 14N/15N-labeled substrates to create defined atom% enrichments (e.g., 0%, 10%, 20%, 30%, 50% 15N). Procedure:
- Grow replicate microbial cultures with the defined 15N-atom% substrate mixtures. Ensure identical growth phases and cell yields.
- Extract and purify genomic DNA from each culture.
- Process each DNA sample through identical CsCl density gradients as per Protocol 3.1, steps 3-5.
- Plot the peak or mean BD of the DNA against the 15N-atom% of the growth substrate.
- Perform regression analysis. The detection threshold is the atom% where the BD becomes statistically distinct (p < 0.05) from the 0% 15N control.
Protocol 3.3: Assessing Quantitative Linearity Objective: To evaluate the correlation between the abundance of DNA in "heavy" gradient fractions and the degree of 15N-labeling. Materials: As in Protocol 3.2, qPCR or ddPCR system, 16S rRNA gene primers. Procedure:
- Using DNA from Protocol 3.2 cultures, perform density gradient centrifugation.
- Fractionate gradients and categorize fractions as "light" (BD < threshold) or "heavy" (BD > threshold) based on the detection threshold established in 3.2.
- Quantify the target gene (e.g., bacterial 16S rRNA gene) copy number in each fraction via qPCR/ddPCR.
- Calculate the percentage of total gene copies recovered in the "heavy" fractions for each 15N-atom% enrichment level.
- Plot "% in Heavy Fraction" against "Substrate 15N-atom%." Assess linearity (R²) across the expected environmental enrichment range (typically <30%).
4. Visualization of Key Concepts and Workflows
Title: 15N-DNA-SIP Workflow & Limitation Assessment Points
Title: Interrelationships of SIP Limitations & Their Drivers
5. The Scientist's Toolkit: Key Research Reagent Solutions
Table 2: Essential Materials for 15N-DNA-SIP Limitation Assessment
| Item | Function / Rationale | Example / Specification |
|---|---|---|
| 15N-Labeled Substrates | Provide tracer for N-cycling processes. Purity defines enrichment accuracy. | 98+ atom% 15N ammonium salts, nitrates, or amino acids. |
| Ultracentrifuge & Rotor | Generates the density gradient for nucleic acid separation. | Optima MAX-XP with MLA-130 (fixed-angle) or VTi-65.2 (vertical) rotor. |
| CsCl, Ultra Pure | Forms the stable density gradient medium. Impurities affect gradient resolution. | Molecular biology grade, RNase/DNase free. |
| Refractometer | Critical for measuring refractive index to calculate buoyant density precisely. | Digital bench-top model, accuracy ±0.0001 RI units. |
| Gradient Fractionator | Allows precise collection of density-resolved DNA fractions for downstream analysis. | Brandel BR-188 or similar piston displacement system. |
| dsDNA Quantitation Kit | Accurate quantification of low-concentration DNA in gradient fractions. | Qubit dsDNA HS Assay, fluorometric. |
| qPCR/ddPCR Master Mix | For high-sensitivity, quantitative assessment of gene abundance in fractions. | Probe-based chemistry for environmental DNA. |
| DNA Size Ladder | Monitoring DNA integrity; fragment size impacts buoyant density and resolution. | High Molecular Weight DNA ladder (>10 kb). |
Conclusion
The 15N-DNA-SIP protocol stands as a powerful and indispensable tool for deconvoluting the complex microbial consortia driving the nitrogen cycle. By mastering its foundational principles, meticulous methodology, and optimization strategies outlined here, researchers can move beyond census data to achieve causative links between microbial phylogeny and specific biogeochemical functions. Future directions point toward integration with high-resolution -omics, single-cell approaches, and quantitative frameworks (qSIP) to transform our understanding. In biomedical research, this holds profound implications for manipulating microbiomes in clinical settings—from modulating gut microbiota for therapeutic benefit to disrupting pathogenic biofilms—by targeting the fundamental nitrogen metabolic pathways that sustain microbial communities.