Mastering DNA-SIP with 13C: A Comprehensive Protocol for Microbial Functional Identification and Drug Discovery
This article provides a detailed, step-by-step guide to the DNA Stable Isotope Probing (DNA-SIP) protocol utilizing 13C-labeled substrates, tailored for researchers in biomedical science and drug development.
Mastering DNA-SIP with 13C: A Comprehensive Protocol for Microbial Functional Identification and Drug Discovery
Abstract
This article provides a detailed, step-by-step guide to the DNA Stable Isotope Probing (DNA-SIP) protocol utilizing 13C-labeled substrates, tailored for researchers in biomedical science and drug development. It begins with foundational concepts of SIP technology and the rationale for using 13C, then systematically walks through methodological execution from substrate preparation to gradient fractionation. The guide addresses common troubleshooting challenges and optimization strategies for increased sensitivity and specificity. Finally, it covers critical validation techniques and compares DNA-SIP to alternative methods like RNA-SIP and protein-SIP, concluding with its powerful implications for identifying uncultivable microbes, elucidating metabolic pathways, and informing targeted therapeutic strategies.
DNA-SIP and 13C Labeling Explained: Core Principles for Microbial Ecology and Metabolism Research
What is DNA Stable Isotope Probing (SIP)? Defining the Core Concept.
Core Concept: DNA Stable Isotope Probing (DNA-SIP) is a cultivation-independent technique that links microbial identity with function in complex environments. It tracks the assimilation of a stable isotope-enriched substrate (e.g., ¹³C, ¹⁵N) into microbial DNA, thereby identifying the active populations that metabolize the substrate. "Heavy" isotope-labeled DNA from these active microbes is physically separated from "light" unlabeled DNA via density-gradient ultracentrifugation, followed by molecular analysis (e.g., 16S rRNA gene sequencing, metagenomics).
Thesis Context: This document provides detailed application notes and protocols within the context of a broader thesis focused on optimizing and applying DNA-SIP protocols with ¹³C-labeled substrates to identify novel microbial biocatalysts relevant to pharmaceutical precursor synthesis.
Application Notes
Primary Applications:
- Identifying Key Microbes in Biogeochemical Cycling: Pinpointing microbes responsible for methane oxidation (¹³CH₄), pollutant degradation (e.g., ¹³C-phenol), or carbon fixation.
- Drug Discovery & Development: Uncultivated microbes as sources of novel enzymes (e.g., oxygenases, synthases) for biocatalysis. DNA-SIP with ¹³C-precursor compounds can identify microbes hosting pathways of interest.
- Microbiome Function: Elucidating which gut microbiota metabolize specific drugs or dietary compounds (e.g., ¹³C-inulin), impacting pharmacokinetics and nutraceuticals.
- Plant-Microbe Interactions: Tracing photosynthate (¹³CO₂) flow from plant to rhizosphere microbiome.
Critical Considerations:
- Substrate Choice: Must be bioavailable, relevant, and sufficiently enriched (typically 99 atom% ¹³C).
- Incubation Time: Must balance between sufficient label incorporation and avoiding cross-feeding (secondary label transfer to non-target microbes).
- DNA Extraction & Shearing: Consistent, high-yield extraction and controlled shearing (~500 bp fragments) are vital for gradient resolution.
- Density Resolution: Success hinges on clear separation of "heavy" and "light" DNA. Appropriate centrifugation conditions are non-negotiable.
Table 1: Common ¹³C-Labeled Substrates and Typical Incubation Parameters
| Substrate | Target Process/Community | Typical ¹³C Atom % | Incubation Duration Range | Key Reference Application |
|---|---|---|---|---|
| ¹³CH₄ (Methane) | Methanotrophs | 99% | 3-14 days | [Neufeld et al., 2007 Nat Protoc] |
| ¹³C-Glucose | Heterotrophic generalists | 98-99% | 24-72 hours | [Youngblut et al., 2018 mSystems] |
| ¹³C-Phenol / Toluene | Hydrocarbon Degraders | 99% | 7-28 days | [Singleton et al., 2005 Appl Environ Microbiol] |
| ¹³C-Bicarbonate | Autotrophs (e.g., CO₂-fixing bacteria) | 99% | 7-56 days | [Freeman et al., 2020 ISME J] |
| ¹³C-Cellulose | Cellulolytic Microbes | 98% | 14-30 days | [Pepe-Ranney et al., 2016 Front Microbiol] |
Table 2: Ultracentrifugation Parameters for CsCl Density Gradients
| Parameter | Standard Condition | Alternative/Note |
|---|---|---|
| Gradient Buffer | 0.1 M Tris-HCl, 0.1 M KCl, 1 mM EDTA (pH 8.0) | TE buffer also common |
| CsCl Starting Density | ~1.725 g/mL (with 0.5-1.0 µg DNA/µL) | Adjusted refractometrically |
| Ultracentrifuge Rotor | Fixed-angle (e.g., Beckman Type 70.1 Ti) | Vertical rotors reduce time |
| Speed & Duration | 177,000 x g (45,000 rpm for 70.1 Ti), 36-48 hrs | 24 hrs for vertical rotors |
| Temperature | 20°C | Controlled, non-refrigerated |
Experimental Protocols
Protocol 1: Core DNA-SIP Workflow for ¹³C-Substrate Incubation
Title: Microcosm Setup, Incubation, and Nucleic Acid Harvest.
Materials:
- Environmental sample (soil, sediment, sludge).
- ¹³C-substrate (e.g., 99 atom% ¹³C-sodium acetate).
- ¹²C-control substrate.
- Serum bottles or microcosm vessels.
- Inert sealing (butyl stoppers, aluminum crimps).
Method:
- Microcosm Preparation: Disperse 5-10 g (wet weight) of sample into replicate serum bottles under an appropriate atmosphere (aerobic/anaerobic).
- Substrate Addition: Sparge bottles with inert gas if anaerobic. Inject ¹³C-substrate (e.g., 1-5 mM final conc.) into experimental bottles. Inject an equivalent amount of ¹²C-substrate into control bottles.
- Incubation: Incubate in the dark at in situ temperature. Duration is substrate-dependent (see Table 1). Monitor substrate consumption if possible (e.g., GC, HPLC).
- Termination & Extraction: Terminate by flash-freezing in liquid N₂ or immediate processing. Extract total community DNA using a bead-beating and column-based kit (e.g., DNeasy PowerSoil Pro). Assess DNA quality/purity via spectrophotometry (A260/280 ~1.8).
Protocol 2: Isopycnic Ultracentrifugation and Fractionation
Title: Density Gradient Centrifugation and DNA Recovery.
Materials:
- Extracted DNA (2-5 µg total).
- Gradient Buffer (GB: 0.1 M Tris-HCl, 0.1 M KCl, 1 mM EDTA, pH 8.0).
- Caesium Chloride (CsCl), molecular biology grade.
- Refractometer.
- Ultracentrifuge, fixed-angle rotor (e.g., Type 70.1 Ti), polyallomer quick-seal tubes.
- Fraction recovery system (e.g., needle-puncture, piston gradient fractionator).
Method:
- Gradient Preparation: In a 5 mL polyallomer tube, mix 2-3 µg DNA with GB and solid CsCl to a final volume of 4.4 mL and a target density of 1.725 g/mL. Verify density by measuring refractive index (η) at 20°C: ρ = (10.9276 * η) - 13.593. Adjust with GB or solid CsCl.
- Seal & Centrifuge: Heat-seal tube, weigh to balance pairs (±0.01 g). Centrifuge at 177,000 x g (45,000 rpm for 70.1 Ti) at 20°C for 40 hours.
- Fractionation: Puncture tube bottom or use a fractionator. Collect 12-15 fractions (~300 µL each) dropwise into sterile tubes.
- Density Measurement: Measure the refractive index of every 2nd-3rd fraction to determine CsCl density profile.
- DNA Precipitation: Dilute each fraction with 2 volumes of sterile PEG solution (30% PEG 6000 in 1.6 M NaCl), incubate, pellet DNA, wash with 70% ethanol, and resuspend in TE buffer or nuclease-free water.
Protocol 3: Molecular Analysis of Gradient Fractions
Title: qPCR Screening and Library Preparation for Sequencing.
Materials:
- Resuspended DNA fractions.
- SYBR Green qPCR master mix.
- 16S rRNA gene primers (e.g., 515F/806R for Bacteria/Archaea).
- Standard cycling reagents for PCR/sequencing.
Method:
- qPCR Screening: Perform qPCR on all fractions using universal 16S rRNA gene primers. Plot DNA quantity (Cq value) against fraction density/buoyancy. Identify "heavy" (¹³C-DNA) and "light" (¹²C-DNA) peaks.
- Pooling & Amplification: Pool fractions constituting the "heavy" peak from ¹³C-treatment and the corresponding "light" peak from the ¹²C-control. Perform PCR amplification for the target gene (e.g., 16S rRNA V4 region).
- Sequencing & Analysis: Purify amplicons, construct libraries, and sequence on an Illumina MiSeq platform. Process sequences via QIIME2 or Mothur: demultiplex, denoise, cluster into OTUs/ASVs, and assign taxonomy. Compare "heavy" ¹³C vs. "light" ¹²C communities to identify enriched taxa (¹³C-assimilating populations).
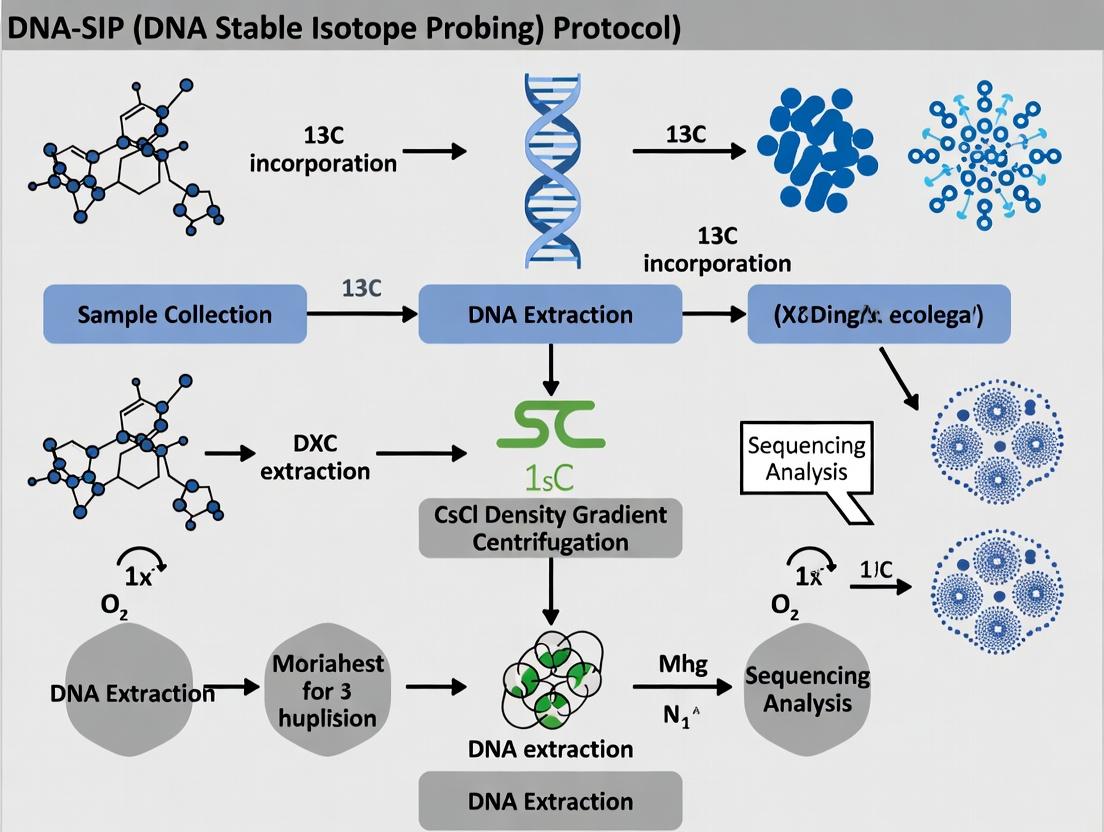
Diagrams
Title: DNA-SIP Experimental Workflow
The Scientist's Toolkit
Table 3: Essential Research Reagents & Materials for DNA-SIP
| Item | Function & Specification | Critical Notes |
|---|---|---|
| ¹³C-Substrate | High-purity (98-99 atom% ¹³C) compound to trace metabolic activity. | Choice defines the microbial guild targeted. Consider solubility and volatility. |
| CsCl (UltraPure) | Forms density gradient for separation of ¹³C-DNA from ¹²C-DNA. | Must be nuclease-free. Density is precisely adjusted using a refractometer. |
| Density Gradient Buffer | Stabilizes pH and prevents DNA degradation during centrifugation (Tris/KCl/EDTA). | Critical for maintaining DNA integrity over long spins. |
| Bead-Beating DNA Extraction Kit | Lyzes diverse cells in environmental samples for high-yield, sheared DNA. | Consistent shearing (~500 bp) improves gradient resolution. |
| Polyallomer Quick-Seal Tubes | Withstand ultracentrifugation forces for CsCl gradients. | Must be heat-sealed properly to avoid collapse or leakage. |
| Fixed-Angle Ultracentrifuge Rotor | Enables high g-force centrifugation for density equilibrium (e.g., Beckman 70.1 Ti). | Allows high sample capacity. Vertical rotors are faster but lower capacity. |
| Refractometer | Precisely measures refractive index to calculate CsCl density of every fraction. | Essential for correlating DNA buoyancy with label incorporation. |
| Universal 16S rRNA qPCR Primers | Quantifies bacterial/archaeal DNA across gradient fractions to identify "heavy" peak. | Screening step to locate labeled DNA before expensive sequencing. |
| PEG/NaCl Precipitation Solution | Efficiently recovers picogram-nanogram amounts of DNA from CsCl fractions. | More reliable than ethanol precipitation for dilute, salt-rich fractions. |
Why 13C? The Advantages of Carbon-13 as a Stable Isotope Tracer.
Carbon-13 (¹³C) is a stable, non-radioactive isotope of carbon, constituting approximately 1.1% of natural abundance. In metabolic research, particularly within DNA Stable Isotope Probing (DNA-SIP) protocols, ¹³C-labeled substrates are indispensable tools for linking microbial identity to function. This application note details the advantages of ¹³C, presents core protocols, and contextualizes its use within a DNA-SIP framework for drug development and environmental research.
Advantages of ¹³C as a Tracer
- Stability and Safety: Unlike radioactive ¹⁴C, ¹³C is stable and poses no radiation hazard, simplifying laboratory handling, disposal, and permitting.
- High-Resolution Detection: ¹³C incorporation can be precisely measured using Isotope Ratio Mass Spectrometry (IRMS) or Nuclear Magnetic Resonance (NMR) spectroscopy, providing quantitative metabolic flux data.
- DNA-SIP Compatibility: The significant buoyant density shift of ¹³C-DNA (vs. ¹²C-DNA) allows for separation via ultracentrifugation, enabling the identification of microbes actively assimilating the labeled substrate.
- Versatility: A wide array of ¹³C-labeled compounds (e.g., glucose, acetate, methane, phenolic compounds) are commercially available to probe diverse metabolic pathways.
Table 1: Quantitative Comparison of Carbon Isotopes
| Property | Carbon-12 (¹²C) | Carbon-13 (¹³C) | Carbon-14 (¹⁴C) |
|---|---|---|---|
| Natural Abundance | ~98.9% | ~1.1% | Trace (Radiogenic) |
| Stability | Stable | Stable | Radioactive (β⁻ decay) |
| Half-life | N/A | N/A | 5,730 years |
| Primary Detection Method | N/A | NMR, IRMS, GC-MS | Scintillation Counting |
| Safety Requirements | None | None | Radiation safety protocols |
| Buoyant Density in CsCl Gradient (g/mL)* | ~1.695 | ~1.720 | Similar to ¹²C |
*Representative values for DNA; exact density depends on G+C content.
Core Protocol: DNA-SIP with ¹³C-Labeled Substrates
This protocol outlines the key steps for identifying active microorganisms using ¹³C-DNA-SIP.
Materials & Reagents
The Scientist's Toolkit: Essential Reagents for DNA-SIP
| Item | Function in Protocol |
|---|---|
| ¹³C-Labeled Substrate (e.g., ¹³C-Glucose, 99% atom) | Tracer compound assimilated by metabolically active microbes. |
| CsCl (UltraPure Grade) | Forms the density gradient for ultracentrifugation. |
| Gradient Buffer (e.g., 0.1 M Tris-HCl, 0.1 M EDTA, pH 8.0) | Stabilizes DNA and maintains gradient integrity. |
| SYBR Safe DNA Gel Stain | For visualizing gradient fractions under blue light. |
| DNA Purification Kit (PCR cleanup or column-based) | For desalting and concentrating DNA from CsCl fractions. |
| Proofreading DNA Polymerase (e.g., Phusion) | For subsequent amplification of 16S rRNA genes from fractionated DNA. |
| Isopycnic Ultracentrifuge & Rotor (e.g., Near-Vertical) | Essential for high-resolution density separation. |
Protocol Steps
1. Incubation & DNA Extraction:
- Incubate your environmental sample (soil, water, gut microbiome) with the ¹³C-labeled substrate under relevant conditions. Include a ¹²C-control.
- After incubation, terminate the reaction and extract total genomic DNA using a standardized method (e.g., MoBio PowerSoil kit). Quantify DNA.
2. Density Gradient Centrifugation:
- Prepare a CsCl gradient mix: Combine ~2 µg of total DNA with gradient buffer and CsCl to a final density of ~1.725 g/mL in an ultracentrifuge tube (e.g., 5.1 mL QuickSeal tube).
- Seal tubes and centrifuge in a near-vertical rotor (e.g., Beckman NVT 65.2) at 177,000 x g (avg) for 36-48 hours at 20°C.
3. Fractionation & Analysis:
- Fractionate the gradient by displacing the contents with water or oil from the bottom, collecting ~200 µL fractions.
- Measure the buoyant density of each fraction using a refractometer.
- Precipitate or desalt DNA from each fraction. Use qPCR targeting 16S rRNA genes to construct a density profile. The "heavy" DNA (¹³C-enriched) will appear in higher density fractions compared to the "light" DNA (¹²C) control.
4. Molecular Analysis:
- Amplify 16S rRNA genes from the "heavy" (¹³C) and "light" (control) fractions.
- Perform high-throughput sequencing and phylogenetic analysis to identify the microbial populations enriched in the ¹³C-DNA.
Diagram Title: DNA-SIP Experimental Workflow
Application in Drug Development
In drug development, ¹³C-DNA-SIP can elucidate how gut microbiota metabolize pharmaceutical compounds (e.g., ¹³C-labeled drugs), identifying microbial consortia responsible for activation or degradation. This informs personalized medicine and microbiome-based therapeutics.
Diagram Title: Identifying Drug-Degrading Microbes
Key Considerations & Best Practices
- Substrate Choice: Select a ¹³C compound that is a relevant carbon source for the target metabolic process.
- Incubation Time: Optimize to ensure sufficient ¹³C incorporation without cross-feeding (secondary labeling).
- Gradient Resolution: Use high-quality CsCl and calibrated ultracentrifugation conditions for clear separation.
- Controls: Always run parallel incubations with ¹²C substrates to establish baseline density profiles.
Carbon-13 is the cornerstone of modern stable isotope probing due to its safety, detectability, and unique utility in separating nucleic acids. Integrated into DNA-SIP protocols, it provides an unparalleled method for directly linking microbial phylogeny to metabolic function, a capability critical for advancing microbial ecology, drug metabolism studies, and biotechnology.
Application Notes: Integrating DNA-SIP with Multi-Omics for Functional-Genetic Linkage
The central hypothesis posits that active metabolic functions within a complex microbiome can be directly linked to the genetic identity of the specific microorganisms performing them. Stable Isotope Probing (SIP) with 13C-labeled substrates is the cornerstone experimental technique for testing this hypothesis. The following notes detail its application and integration.
1.1 Core Principle: When a microbial community is fed a 13C-labeled substrate (e.g., 13C-glucose, 13C-phenol), only metabolically active organisms incorporating the substrate into their biomass become enriched in heavy 13C. Density gradient centrifugation separates this "heavy" DNA (13C-DNA) from "light" DNA (12C-DNA). Subsequent sequencing of the heavy fraction identifies the active, substrate-utilizing population.
1.2 Key Quantitative Considerations: Successful linkage depends on critical experimental parameters. Insufficient 13C incorporation leads to false negatives, while cross-feeding can blur functional associations.
Table 1: Critical Quantitative Parameters for DNA-SIP Experiments
| Parameter | Typical Target/Threshold | Rationale & Impact |
|---|---|---|
| Atom Percent Excess (APE) 13C in Substrate | 98-99% | Maximizes density shift, minimizing required incubation time. |
| Incubation Time | Hours to weeks (substrate-dependent) | Must balance between sufficient 13C-DNA yield and significant cross-feeding (secondary utilization of 13C-labeled metabolites). |
| Buoyant Density (BD) Shift | ~0.036 g/mL per 100% 13C incorporation | Theoretical shift for pure DNA. A shift >0.01 g/mL is often considered significant for GC-balanced genomes. |
| GC Content Bias | High-GC DNA is inherently denser | Requires isopycnic centrifugation controls (12C-treatment) and qSIP statistical correction for accurate identification. |
| DNA Yield for Sequencing | >1 ng from heavy fraction | Minimum for robust library preparation; low yield is a primary technical failure point. |
1.3 Multi-Omics Integration: To robustly link function to genetic identity, DNA-SIP is increasingly paired with other -omics:
- Meta-transcriptomics (RNA-SIP): Confirms active gene expression in heavy fractions.
- Metaproteomics (Protein-SIP): Directly identifies 13C-labeled enzymes and metabolic pathways.
- Metabolomics: Tracks fate of 13C in the environment and within metabolic networks.
Detailed Protocol: DNA-SIP with 13C-Labeled Substrates for Microbiome Analysis
2.1 Materials & Reagent Solutions
Table 2: Research Reagent Solutions Toolkit
| Item | Function & Specification |
|---|---|
| 13C-Labeled Substrate | Core tracer; define position of label (e.g., U-13C6 glucose). Use >98 APE. |
| Caesium Chloride (CsCl) | Ultra-pure, molecular biology grade. Forms the density gradient. |
| Gradient Buffer | 10 mM Tris-HCl, 100 mM KCl, 1 mM EDTA (pH 8.0). Maintains DNA stability and pH. |
| SYBR Gold Nucleic Acid Stain | For gradient fractionation visualization. Less mutagenic than ethidium bromide. |
| DNA-Binding Spin Columns | For desalting and concentrating DNA from CsCl fractions (e.g., Qiagen DNeasy). |
| Polyethylene Glycol (PEG) 6000 | For high-efficiency precipitation of low-concentration DNA from fractions. |
| Quant-iT PicoGreen dsDNA Assay Kit | Fluorometric quantification of low-DNA concentrations in gradient fractions. |
| Proofreading High-Fidelity DNA Polymerase | For amplification of 16S rRNA gene or shotgun libraries from minute DNA amounts. |
2.2 Protocol Workflow
Step 1: Microcosm Incubation
- Prepare triplicate microcosms with environmental inoculum (e.g., soil slurry, gut microbiota) and defined medium.
- Experimental: Add 13C-labeled substrate at ecologically relevant concentration.
- Control 1: Add 12C-labeled substrate.
- Control 2: No substrate (background activity).
- Incubate in the dark with shaking at in situ temperature. Determine optimal incubation time via pilot study.
Step 2: Nucleic Acid Extraction & Purification
- Harvest biomass by centrifugation. Extract total community DNA using a robust kit (e.g., MP Biomedicals FastDNA SPIN Kit for soil).
- Assess DNA purity (A260/A280 ~1.8) and quantity. A minimum of 3 µg total DNA is recommended for gradient construction.
Step 3: Isopycnic Ultracentrifugation
- Prepare CsCl/gradient buffer solution to a final refractive index (RI) of ~1.4040 (BD ~1.725 g/mL). Use formula: BD (g/mL) = (RI * 13.287) - 13.593.
- Mix 3 µg DNA with CsCl solution in a 5.1 mL ultracentrifuge tube. Adjust final volume to 4.8 mL and final RI to 1.3990 (BD ~1.71-1.72 g/mL).
- Balance tubes to within 0.01 g. Centrifuge in a Beckman Coulter Optima XE or equivalent with a vertical rotor (e.g., VTi 65.2) at 177,000 x g (avg), 20°C, for 40-48 hours.
Step 4: Gradient Fractionation & Analysis
- Collect 12-14 equal fractions (~350 µL) from the top of the gradient using a fractionation system or careful manual displacement.
- Measure the refractive index of every fraction to determine buoyant density.
- Precipitate DNA from each fraction using PEG 6000/NaCl, wash with 70% ethanol, and resuspend in TE buffer.
- Quantify DNA in each fraction using PicoGreen assay.
Step 5: Identifying "Heavy" Fractions & Downstream Analysis
- Plot DNA quantity vs. buoyant density for 13C and 12C treatments.
- Identify "heavy" fractions where DNA concentration is elevated in the 13C treatment but absent in the 12C control.
- Pool selected "heavy" and "light" fractions separately. Desalt using spin columns.
- Proceed with:
- 16S rRNA Gene Amplicon Sequencing: For phylogenetic identification of active taxa.
- Shotgun Metagenomic Sequencing: For reconstruction of genomes (MAGs) and metabolic pathways of active organisms.
Visualization: Experimental Workflow & Data Integration
Title: DNA-SIP Experimental & Analysis Workflow
Title: Hypothesis Testing via SIP & Multi-Omics Integration
Application Notes
The application of DNA-based Stable Isotope Probing (DNA-SIP) with ¹³C-labeled substrates is a cornerstone technique for linking microbial identity to metabolic function across diverse ecosystems. Its power lies in separating ¹³C-enriched "heavy" DNA from ¹²C "light" DNA via density gradient ultracentrifugation, allowing for the direct identification of microbes assimilating the specific substrate. This protocol is integral to a broader thesis investigating metabolic networks in complex microbiomes.
Table 1: Key Quantitative Parameters for DNA-SIP Ultracentrifugation
| Parameter | Typical Value or Range | Notes |
|---|---|---|
| ¹³C Substrate Enrichment | 98-99 atom% | Purity critical for sufficient density shift. |
| CsCl Gradient Density | 1.725 g/mL (± 0.005 g/mL) | Optimized for bacterial/archaeal DNA. |
| Ultracentrifugation Speed | 45,000 rpm (e.g., VT-65 rotor) | ~178,000 g. |
| Ultracentrifugation Time | 36-48 hours | Ensures isopycnic equilibrium. |
| DNA Density Shift (¹²C vs. ¹³C) | ~0.036 g/mL | Heavier DNA band lower in tube. |
| Fraction Volume Collected | 200-500 µL per fraction | Yields ~20 fractions per gradient. |
| Required DNA Input | 0.5-5 µg per gradient | For effective fractionation and downstream analysis. |
Table 2: Comparative Application Metrics Across Fields
| Field | Typical ¹³C Substrate | Incubation Duration | Primary Analytical Downstream |
|---|---|---|---|
| Environmental Biogeochemistry | [¹³C]Methane, [¹³C]Bicarbonate, [¹³C]Cellulose | Weeks to months | 16S rRNA amplicon sequencing, metagenomics. |
| Human Gut Microbiome | [¹³C]Inulin, [¹³C]Xylose, [¹³C]Bile Acids | 24-72 hours | 16S rRNA sequencing, shotgun metagenomics, qPCR. |
| Drug Metabolism & Toxicology | [¹³C]Drug (e.g., [¹³C]-Acetaminophen), [¹³C]Xenobiotic | Hours to days | Metagenomics, metatranscriptomics, targeted PCR. |
Experimental Protocols
Protocol 1: Generic DNA-SIP Workflow for Microbiome Samples
Principle: Actively metabolizing microorganisms incorporate ¹³C from labeled substrates into their biomass, including DNA, increasing its buoyant density.
Materials & Incubation:
- Sample Preparation: Inoculate environmental (e.g., soil slurry) or synthetic (e.g., fecal culture) samples with ¹³C-labeled substrate. Include a parallel ¹²C control.
- Incubation: Incubate under physiologically relevant conditions (e.g., anaerobic chamber for gut samples). Duration depends on substrate turnover rate (see Table 2).
- Harvest & DNA Extraction: Terminate incubation, harvest cells/pellets. Extract total community genomic DNA using a bead-beating protocol (e.g., DNeasy PowerSoil Pro Kit) to ensure lysis of diverse taxa.
Gradient Ultracentrifugation & Fractionation:
- Gradient Setup: Prepare CsCl solution (1.725 g/mL) with Gradient Buffer (e.g., 0.1M Tris, 0.1M EDTA, 0.5M NaCl, pH 8.0) and fluorescent intercalating dye (e.g., GelGreen). Mix with 0.5-5 µg DNA. Load into a quick-seal ultracentrifugation tube.
- Ultracentrifugation: Balance tubes precisely. Centrifuge at 45,000 rpm (e.g., Beckman Coulter Optima XE with VT-65 rotor) at 20°C for 40 hours.
- Fraction Collection: Puncture tube bottom. Collect ~20 fractions of 200 µL each manually or via a fractionator. Measure density of every 3rd-5th fraction using a refractometer.
Downstream Analysis:
- DNA Recovery & Purification: Precipitate DNA from each fraction with PEG solution, wash with ethanol, and resuspend.
- Quantification & Screening: Quantify DNA in each fraction (e.g., PicoGreen assay). Perform qPCR of target genes (e.g., 16S rRNA) to identify "heavy" and "light" fractions.
- Microbial Community Analysis: Amplify and sequence 16S rRNA genes from heavy (¹³C-enriched) and light (¹²C-control) fractions. Compare via bioinformatics to identify taxa enriched in the heavy DNA.
Protocol 2: Targeted SIP for Gut Microbial Drug Metabolism
Objective: Identify specific gut microbes responsible for metabolizing a ¹³C-labeled drug.
Specialized Procedure:
- In Vitro Culturing: Anaerobically incubate defined human gut microbiota consortium or fecal slurry with therapeutic dose of [¹³C]-labeled drug (e.g., [¹³C-ring]-digoxin).
- Extended Incubation: Incubate for 12-48h, monitoring drug depletion via LC-MS to confirm metabolism.
- Density-Resolved Metagenomics: Perform SIP as in Protocol 1. Instead of 16S amplicon sequencing, prepare shotgun metagenomic libraries from heavy DNA fractions. This allows assembly of genomes and identification of catalytic genes (e.g., cgr operon for digoxin reduction).
Visualization
Title: DNA-SIP Experimental Workflow
Title: Gut Microbiome Drug Metabolism via SIP
The Scientist's Toolkit
Table 3: Essential Research Reagent Solutions for DNA-SIP
| Item | Function | Critical Notes |
|---|---|---|
| ¹³C-Labeled Substrate (High atom%) | Provides the isotopic label for tracing metabolic activity into DNA. | Purity (>98%) is essential. Choose labeling position relevant to metabolic pathway. |
| Caesium Chloride (CsCl), Ultra Pure | Forms the density gradient for separation of nucleic acids by buoyant density. | Must be molecular biology grade, nuclease-free. |
| Gradient Buffer (e.g., TE + NaCl) | Maintains pH and ionic strength, prevents DNA aggregation during centrifugation. | EDTA chelates Mg²⁺, inhibiting nucleases. |
| Fluorescent Nucleic Acid Stain (e.g., GelGreen) | Allows visualization of DNA bands under blue light. | Use a stain less mutagenic than ethidium bromide. |
| Buoyant Density Standards | Calibrates refractometer readings to calculate exact density of fractions. | Required for precise density determination. |
| PEG 6000/NaCl Precipitation Solution | Efficiently precipitates low-concentration DNA from high-salt CsCl fractions. | More effective than ethanol for short DNA fragments. |
| Nuclease-Free Water | Resuspension and dilution of DNA from fractions. | Essential for downstream enzymatic applications (qPCR, library prep). |
| PCR/QPCR Reagents for Target Genes (e.g., 16S rRNA) | Screens fractions to identify those containing ¹³C-enriched "heavy" DNA. | Use high-fidelity polymerases for subsequent sequencing. |
Stable Isotope Probing (SIP) with 13C-labeled substrates is a cornerstone technique for linking microbial identity to function in complex environments. Within the broader thesis on optimizing DNA-SIP protocols for drug development research—such as tracing the metabolism of 13C-labeled drug candidates or excipients by gut microbiota—the foundational steps of equipment readiness, safety, and isotopic planning are critical. Failure in these prerequisites compromises all subsequent experimental data.
Essential Equipment and Infrastructure
A successful DNA-SIP study requires specialized equipment for handling, processing, and analyzing isotopically enriched samples. The core infrastructure is detailed below.
Table 1: Core Equipment for DNA-SIP with 13C Substrates
| Equipment Category | Specific Instrument | Key Specification/Requirement | Primary Function in SIP Workflow |
|---|---|---|---|
| Ultracentrifugation | Preparative Ultracentrifuge | Vacuum system, temperature control (±1°C), ≥ 70,000 rpm | Density gradient formation and isopycnic separation of nucleic acids. |
| Fixed-Angle or Near-Vertical Rotor | Compatible with thick-walled polypropylene tubes (e.g., 5.1 mL), max RCF ≥ 180,000 g | Holds samples during ultracentrifugation for gradient separation. | |
| Density Gradient Handling | Fractionation System | Precision pump or syringe drive, UV monitor (254 nm), fraction collector | Precise, reproducible collection of density gradient fractions. |
| Refractometer | Digital, high-resolution (±0.0001 g mL⁻¹) | Accurate measurement of buoyant density (BD) of each fraction. | |
| Nucleic Acid Processing | PCR Workstation / Laminar Flow Hood | HEPA-filtered, UV sterilization | Sterile environment for PCR setup to prevent contamination of sensitive post-fractionation samples. |
| Real-Time PCR System | High sensitivity, multiplex capability | Quantification of 16S rRNA genes or target markers in gradient fractions to identify "heavy" DNA. | |
| Isotope Analysis | Isotope Ratio Mass Spectrometer (IRMS) | Coupled to an elemental analyzer (EA) or liquid interface | Gold-standard confirmation of 13C incorporation into bulk nucleic acids. |
| High-Resolution Mass Spectrometer (HRMS) | LC- or GC-coupled | Detection and quantification of specific 13C-labeled metabolites (optional, for metabolic tracing). |
Safety Protocols: Biological, Chemical, and Radiological
While 13C is non-radioactive, SIP labs handle biological hazards and concentrated caesium salts, requiring stringent safety protocols.
3.1 Chemical Safety (Caesium Chloride & Ethidium Bromide Alternatives)
- CsCl Hazards: Highly hygroscopic and toxic. Use in a fume hood for weighing and solution preparation. Wear a lab coat, gloves, and eye protection.
- Waste Disposal: Collect all CsCl waste separately as heavy metal hazardous waste. Do NOT pour down the sink.
- Fluorescent Dyes: SYBR Safe or GelGreen are recommended over mutagenic ethidium bromide. Treat all gel stain waste as hazardous chemical waste.
3.2 Biological Safety
- Samples (e.g., soil, sediment, fecal matter) are potential biohazards (BSL-2). Perform all initial sample processing in a BSL-2 cabinet.
- Inactivate samples prior to ultracentrifugation (e.g., with SDS lysis buffer) to minimize aerosolized pathogens during potential tube failure.
3.3 Ultracentrifuge Safety
- Tube Inspection: Visually inspect polypropylene tubes for cracks or stress marks before each run. Do not exceed manufacturer-stated run limits.
- Balance: Tolerances must be within 0.1 g for a pair. Use balanced dummy gradients if necessary.
- Vacuum: Ensure proper vacuum is established before starting run to prevent overheating and rotor failure.
Isotope Considerations: 13C Substrate Selection and Handling
The choice of the 13C-labeled compound is dictated by the research question.
Table 2: Common 13C Substrates and Key Considerations
| Substrate Type | Example Compounds | Typinal Enrichment | Considerations for Drug Development Context | Approx. Cost (USD per gram) |
|---|---|---|---|---|
| Universal | [13C6]-Glucose, [13C3]-Acetate, [13C]-Bicarbonate | 98-99 atom% | Readily assimilated by many microbes; good for general activity surveys. | $100 - $350 |
| Drug-centric | 13C-labeled drug candidate, [13C]-Lactulose, [13C]-Inulin | 98-99 atom% | Trace metabolism of specific drug or prebiotic. Requires custom synthesis. | $1,000 - $5,000+ |
| Complex/Mixture | 13C-Algal amino acids, [13C]-Cellulose | 97-98 atom% | Mimics complex natural substrates. Lower enrichment is common. | $200 - $800 |
| Inhibitor | [13C]-Methanol (with unlabeled methanogen inhibitor) | 99 atom% | For tracing specific functional guilds (e.g., methylotrophs). | $400 - $600 |
Protocol 4.1: Preparation and Addition of 13C Substrate to Microcosms
- Calculate Required Mass: Determine total carbon mass needed for your microcosm. Calculate mass of 13C-substrate using:
Mass (g) = (Total C required (mol) * Molecular Weight (g/mol)) / (Atom% enrichment / 100). Include excess for analytical checks. - Prepare Stock Solution: In a fume hood, dissolve the precise mass of 13C-substrate in sterile, deionized water or appropriate solvent (e.g., DMSO for hydrophobic drugs). Filter-sterilize (0.2 µm).
- Add to Microcosm: Aseptically add the stock solution to the environmental sample (e.g., soil, fecal slurry, activated sludge) in its incubation vessel. Mix thoroughly to ensure even distribution.
- Control Amendment: Prepare a parallel set of microcosms amended with an equivalent amount of unlabeled (12C) substrate at the same concentration.
- Incubate: Incubate under environmentally relevant conditions (temperature, pH, anaerobic chamber, etc.) for a duration optimized to allow sufficient 13C assimilation into DNA (typically 3-10 generations of target organisms).
Core Protocol: Density Gradient Preparation and Ultracentrifugation
This is the central technique for separating "heavy" (13C-labeled) from "light" (unlabeled) DNA.
Protocol 5.1: CsCl Density Gradient Ultracentrifugation for DNA-SIP Materials: Gradients are prepared in 5.1 mL polypropylene ultracentrifuge tubes using a gradient fractionation system and a refractometer.
- Extract Total Nucleic Acids: Extract total community DNA from 13C- and 12C-treated samples using a bead-beating and phenol-chloroform protocol. Purify and resuspend in TE buffer.
- Prepare Gradient Solution: For a target buoyant density (BD) of ~1.725 g mL⁻¹ for DNA, prepare a CsCl/GB solution. For 1 g of DNA solution, add 1.05 g of solid CsCl and 0.95 mL of Gradient Buffer (GB: 0.1 M Tris-HCl, 0.1 M KCl, 1 mM EDTA, pH 8.0). Final volume ~3 mL.
- Measure & Adjust Density:
- Transfer 100 µL to a refractometer.
- Measure refractive index (RI) and calculate BD using the equation: BD (g mL⁻¹) = (RI * 13.18) - 13.97.
- Adjust BD by adding small amounts of solid CsCl (to increase) or GB (to decrease). Target RI = 1.4035 (BD ≈ 1.725 g mL⁻¹).
- Load and Balance Tubes: Transfer exactly 3.6 mL of adjusted solution to a 5.1 mL tube. Fill remaining space with light mineral oil. Weigh and balance pairs to within 0.1 g.
- Ultracentrifugation: Place tubes in a rotor (e.g., Thermo Scientific SureSpin 630). Centrifuge at 177,000 g (e.g., 44,100 rpm for a SureSpin 630) at 20°C for 36-44 hours. Use maximum acceleration and no brake for deceleration.
- Fractionate Gradient:
- Pierce tube bottom with a 22-gauge needle connected to a fractionation system.
- Pump a dense chase solution (e.g., Fluorinert) into the top to displace gradient from bottom to top.
- Collect 12-14 equal fractions (≈ 300 µL each) into sterile tubes while monitoring UV absorbance at 254 nm.
- Measure Buoyant Density: Measure the RI of every second fraction and calculate BD as in Step 3.
- DNA Precipitation: Add 2 volumes of PEG precipitation solution (30% PEG 6000 in 1.6 M NaCl) to each fraction, incubate, pellet DNA, wash with 70% ethanol, and resuspend in TE buffer for downstream analysis (qPCR, sequencing).
The Scientist's Toolkit: Research Reagent Solutions
Table 3: Essential Reagents and Materials for DNA-SIP
| Reagent/Material | Function | Key Notes |
|---|---|---|
| Caesium Chloride (CsCl), ultra-pure grade | Forms the density gradient for isopycnic separation. | Hygroscopic; store in a desiccator. Critical for achieving high-resolution separation. |
| Gradient Buffer (GB: 0.1 M Tris-HCl, 0.1 M KCl, 1 mM EDTA, pH 8.0) | Provides a stable chemical environment for DNA during ultracentrifugation. | The EDTA chelates divalent cations to prevent DNA degradation. |
| PEG/NaCl Precipitation Solution | Precipitates DNA from high-salt CsCl fractions efficiently. | More effective than ethanol for precipitating DNA from dense CsCl solutions. |
| SYBR Safe DNA Gel Stain | Safer alternative to ethidium bromide for visualizing DNA in gels. | Requires blue-light transilluminator for visualization. |
| PCR-Grade Water (Nuclease-Free) | Used for resuspending DNA and preparing PCR mixes. | Essential to prevent degradation of low-biomass DNA from gradient fractions. |
| Proofreading High-Fidelity DNA Polymerase (e.g., Q5, KAPA HiFi) | For amplifying 16S rRNA genes from gradient fractions for sequencing. | Minimizes PCR errors that distort community analysis. |
| Internal Density Standards (optional) | Fluorescent beads of known density for gradient calibration. | Can be added prior to centrifugation to mark specific densities. |
Visualizations
DNA-SIP Core Experimental Workflow
DNA-SIP Critical Safety Considerations
Step-by-Step DNA-SIP Protocol with 13C: From Incubation to Gradient Fractionation
Within a DNA Stable Isotope Probing (DNA-SIP) research thesis, Phase 1 is the critical foundational stage that determines the entire project's success. This phase focuses on the meticulous design of the incubation experiment and the strategic selection and preparation of (^{13})C-labeled substrates. The goal is to create conditions that allow targeted microbial guilds to incorporate the heavy isotope into their biomass, enabling subsequent separation and molecular analysis. Proper execution of this phase minimizes confounding factors and ensures clear isotopic labeling.
Key Experimental Design Considerations
The experimental design must account for variables that influence microbial activity and (^{13})C incorporation. Key considerations are summarized in Table 1.
Table 1: Key Experimental Design Parameters for DNA-SIP
| Parameter | Typical Range/Options | Rationale & Impact |
|---|---|---|
| (^{13})C Substrate Enrichment | 98-99 atom% (^{13})C | Maximizes isotopic label density for effective DNA separation in ultracentrifugation. Lower enrichment reduces sensitivity. |
| Substrate Concentration | µM to mM range (e.g., 1-10 mM for common compounds) | Must be high enough to sustain growth but not so high as to cause toxicity or non-specific labeling via co-metabolism. |
| Incubation Duration | Hours to weeks; often 3-28 days. | Must allow for sufficient (^{13})C incorporation into genomic DNA by active populations. Too short: weak label. Too long: cross-feeding. |
| Replication | Minimum of 3-5 microcosms per treatment. | Accounts for biological variability and enables statistical validation. |
| Control Microcosms | (^{12})C-substrate (natural abundance), no-substrate, killed controls. | (^{12})C controls are essential for benchmarking "heavy" DNA; killed controls assess abiotic processes. |
| Sampling Timepoints | Multiple destructive timepoints (e.g., days 1, 3, 7, 14). | Tracks the dynamics of (^{13})C incorporation and microbial succession. |
| Environmental Matrix | Soil slurry, sediment, water, bioreactor sample. | Matrix determines extraction protocol and may require pre-sieving or homogenization. |
13C-Substrate Selection and Preparation Protocol
Substrate Selection Logic
The choice of substrate is hypothesis-driven, based on the metabolic process or microbial guild under investigation.
- Compound-Specific: Using a single compound (e.g., (^{13})C-phenanthrene, (^{13})C-methane, (^{13})C-glucose) targets primary degraders or assimilators.
- Complex Mixtures: Using plant litter or biomass (e.g., (^{13})C-cellulose, (^{13})C-lignin) targets broader consortia involved in decomposition.
- Position-Specific Labeling: Using a compound labeled at a specific atomic position (e.g., (^{13})C-1-butanol vs (^{13})C-4-butanol) can elucidate specific metabolic pathways.
Table 2: Common 13C-Substrates and Their Applications
| Substrate Type | Example Compounds | Target Microbial Processes/Guilds |
|---|---|---|
| Simple Organics | [(^{13})C]-Glucose, [(^{13})C]-Acetate, [(^{13})C]-Bicarbonate | Heterotrophic bacteria/fungi, acetoclasts, autotrophs (CO(_2) fixation). |
| Pollutants | [U-(^{13})C]-Naphthalene, [(^{13})C(_6)]-Benzene | Hydrocarbon-degrading bacteria. |
| Gaseous Substrates | (^{13})CH(4), (^{13})CO(2) | Methanotrophs, methanogens, autotrophs. |
| Complex Polymers | [(^{13})C]-Cellulose, [(^{13})C]-Chitin | Polymer-degrading specialists (e.g., Cellulomonas, fungi). |
| Amino Acids | [U-(^{13})C]-Leucine, [U-(^{13})C]-Glycine | Fast-growing bacterial populations. |
Protocol: Preparation of Aqueous 13C-Substrate Stock Solutions
Objective: To prepare a sterile, concentrated stock solution of the (^{13})C-labeled substrate for precise dosing into experimental microcosms.
Materials:
- (^{13})C-labeled compound (solid or liquid)
- Appropriate solvent (sterile deionized H(_2)O, phosphate buffer, or minimal medium)
- Analytical balance
- Sterile vials (e.g., 10-20 mL scintillation vials or serum bottles)
- Syringe filters (0.2 µm pore size, PTFE or nylon)
- Syringes (5-10 mL)
- Gloves and appropriate personal protective equipment (PPE)
Methodology:
- Calculate Mass: Determine the mass of (^{13})C-substrate required to make a stock solution 100-1000x the desired final concentration in the microcosm. Example: For a final concentration of 1 mM glucose in 100 mL of soil slurry, a 100 mM stock is needed. For 100 mL of stock, use 1.8 g of [U-(^{13})C] glucose (MW ~180 g/mol).
- Weigh Substrate: In a chemical fume hood if using volatile/toxic compounds, accurately weigh the required mass of the (^{13})C-substrate using an analytical balance.
- Dissolve: Transfer the compound to a sterile vial. Add the calculated volume of sterile solvent (e.g., water or minimal medium). Cap and vortex or stir vigorously until fully dissolved.
- Filter Sterilize: Aseptically draw the solution into a sterile syringe. Attach a 0.2 µm syringe filter and expel the solution into a new, sterile, labeled vial. This removes microbial contaminants.
- Verify Concentration (Optional): Analyze a diluted aliquot via appropriate methods (e.g., HPLC, GC) to confirm stock concentration.
- Storage: Store stock solutions at -20°C (for labile organics) or 4°C (for stable compounds) in the dark. Avoid repeated freeze-thaw cycles.
Protocol: Dosing of Gaseous 13C-Substrates
Objective: To create microcosms with a defined headspace concentration of a gaseous (^{13})C-substrate (e.g., (^{13})CH(4), (^{13})CO(2)).
Materials:
- Sealed microcosm vessels (e.g., serum bottles with butyl rubber stoppers and aluminum crimp seals)
- Gas-tight syringes (e.g., Pressure-Lok series)
- Source of (^{13})C-gas (gas cylinder or ampoule)
- Manometer (for precise pressure measurements, optional)
Methodology:
- Prepare Microcosms: Add the environmental sample to sterile serum bottles. Seal with sterile butyl rubber stoppers and crimp. Evacuate the headspace and flush with an inert gas (e.g., N(_2) or He) if anoxic conditions are required.
- Calculate Volume: Use the ideal gas law to calculate the volume of pure (^{13})C-gas to inject to achieve the desired final headspace concentration (e.g., 10% v/v (^{13})CH(_4)).
- Inject Gas: Using a gas-tight syringe, withdraw the calculated volume of (^{13})C-gas from the source. Immediately inject it through the stopper into the microcosm headspace.
- Mix: Gently shake the bottle to facilitate dissolution/distribution of the gas.
- Monitor Pressure: For long incubations, monitor headspace pressure to ensure it does not become excessive due to microbial gas production.
The Scientist's Toolkit: Key Reagents & Materials
Table 3: Essential Research Reagent Solutions for Phase 1
| Item | Function/Application | Key Considerations |
|---|---|---|
| High-Purity 13C-Substrate | Provides the isotopic label for target microorganisms. | Select atom% (^{13})C >98%; verify chemical and isotopic purity via supplier certificate of analysis. |
| Sterile Solvent/Medium | For dissolving and diluting substrates without introducing contaminants. | Must be compatible with the substrate and microbial community (e.g., saline for marine samples). |
| Butyl Rubber Stoppers | Creates a gas-tight seal for microcosms using volatile or gaseous substrates. | Autoclavable; must be compatible with the substrate (some organics can degrade rubber). |
| 0.2 µm Syringe Filters | Sterilizes substrate stock solutions without heat degradation. | Choose membrane material (PTFE, nylon) based on substrate solubility and adsorption properties. |
| Gas-Tight Syringes | Precisely transfers gaseous or volatile liquid substrates. | Prevents leakage and ensures accurate dosing; calibrate regularly. |
| Anoxic/Anaerobic Balts | Creates and maintains oxygen-free conditions for studying anaerobic processes. | Essential for methanogens, denitrifiers, or sulfate-reducing bacteria targeted with (^{13})C-acetate, (^{13})CO(_2), etc. |
| Microcosm Vessels | Containers for incubations (e.g., serum bottles, flasks). | Material (glass preferred) should not adsorb the substrate; size should allow for sufficient headspace and sample. |
Visualizations
Phase 1 SIP Workflow Overview
Fate of 13C in a SIP Microcosm
Application Notes
This protocol details the critical second phase of a DNA-based Stable Isotope Probing (DNA-SIP) study, designed to link microbial metabolic function to phylogenetic identity within a complex environmental sample. The objective is to establish replicate microcosms that simulate key environmental conditions, inoculate them with the sample of interest, and administer a 13C-labeled substrate under controlled incubation. Successful execution enables the selective isotopic labeling of DNA from microbial populations actively assimilating the target substrate, which is essential for subsequent nucleic acid extraction, density gradient ultracentrifugation, and fractionation (Phases 3 & 4). This phase is foundational for generating meaningful, high-quality SIP data.
Key Considerations:
- Microcosm Design: Must balance experimental control with ecological relevance.
- Substrate Choice & Labeling: 13C-purity and concentration are paramount for sufficient DNA label incorporation.
- Incubation Parameters: Time, temperature, and other conditions must support active metabolism of the target substrate without inducing community shifts unrelated to the treatment.
- Controls: Appropriate controls are non-negotiable for data interpretation.
Table 1: Typical Microcosm Setup Parameters for Common Sample Types
| Sample Type | Recommended Volume | Typical 13C-Substrate Concentration | Incubation Temperature | Common Incubation Duration | Replication (n) |
|---|---|---|---|---|---|
| Soil Slurry | 10 - 30 mL | 1 - 5 mM (e.g., glucose, acetate) | 15 - 28°C | 7 - 28 days | 5 |
| Aquatic / Marine | 50 - 200 mL | 50 - 200 µM (e.g., bicarbonate, methane) | In situ or 4 - 20°C | 14 - 42 days | 5 |
| Wastewater / Activated Sludge | 20 - 50 mL | 0.5 - 2 mM (e.g., phenol, pyridine) | 20 - 30°C | 3 - 14 days | 5 |
| Sediment Slurry | 10 - 20 mL | 1 - 5 mM (e.g., urea, acetate) | In situ or 10 - 25°C | 14 - 35 days | 5 |
Table 2: Essential Controls for DNA-SIP Incubation
| Control Type | Purpose | 13C-Substrate? | Key Comparison |
|---|---|---|---|
| 12C-Control | Distinguish buoyant density shifts due to 13C-incorporation from natural variation. | No (natural abundance) | vs. 13C-microcosm |
| Killed Control (e.g., autoclaved) | Account for abiotic adsorption of label to biomass or sediment. | Yes | vs. Live 13C-microcosm |
| Background/Time Zero | Provides baseline community structure and density profile. | No | Harvested immediately after inoculation. |
| Substrate-Amended 12C | Assess non-isotopic effects of substrate addition on community. | No | vs. Unamended 12C-control |
Experimental Protocols
Protocol: Setup of Replicate Soil Slurry Microcosms
Objective: To establish homogeneous, replicated soil microcosms amended with 13C-glucose for SIP incubation.
Materials: Fresh environmental soil sample, 13C6-glucose (99 atom%), 12C-glucose, sterile basal salts medium (BSM: 0.5 g/L NH4Cl, 0.2 g/L MgSO4·7H2O, 0.01 g/L CaCl2, 1.0 g/L K2HPO4, pH 7.2), sterile serum bottles (120 mL), butyl rubber stoppers, aluminum crimps, crimper, anaerobic chamber (if required).
Method:
- Soil Slurry Preparation: Aseptically combine soil with sterile BSM in a 1:2 (w/v) ratio in an anaerobic chamber. Homogenize by stirring for 1 hour.
- Dispensing: Aliquot 10 mL of soil slurry into each sterile 120 mL serum bottle under appropriate (aerobic/anaerobic) conditions.
- Substrate Amendment:
- 13C-Treatment: Add 13C6-glucose from a sterile stock solution to a final concentration of 2 mM.
- 12C-Control: Add 12C-glucose to a final concentration of 2 mM.
- Killed Control: Autoclave microcosms, then amend with 13C6-glucose as above.
- Sealing: Seal bottles with sterile butyl rubber stoppers and aluminum crimps.
- Initial Sampling: Prepare 5 additional replicates as "Time Zero" controls. Process these immediately for DNA extraction.
- Incubation: Place bottles in the dark at 20°C. Monitor headspace pressure if gases are produced.
Protocol: Inoculation and Incubation for Aqueous Samples
Objective: To inoculate and incubate water column samples with 13C-bicarbonate for photoautotroph SIP studies.
Materials: Lake/sea water sample (pre-filtered through 3.0 µm to remove grazers), NaH13CO3 (99 atom%), NaH12CO3, sterile polycarbonate bottles (250 mL), gas-tight septa, incubator with light bank.
Method:
- Inoculation: Aseptically fill 250 mL bottles with 200 mL of filtered sample, leaving minimal headspace.
- Substrate Amendment:
- 13C-Treatment: Inject sterile NaH13CO3 stock to a final concentration of 150 µM.
- 12C-Control: Inject equivalent NaH12CO3.
- Sealing: Cap tightly, ensuring no air bubbles.
- Incubation: Place bottles in an incubator at in situ temperature with a 12h:12h light-dark cycle for 14 days.
- Harvest: Filter biomass onto 0.22 µm polyethersulfone filters at incubation end and store at -80°C.
Diagrams
Title: DNA-SIP Experimental Workflow
Title: Phase 2 Microcosm Setup and Inoculation Logic
The Scientist's Toolkit
Table 3: Key Research Reagent Solutions & Materials for Phase 2
| Item | Function & Specification |
|---|---|
| 13C-Labeled Substrate | The core reagent. High isotopic purity (>98 atom% 13C) is critical to maximize label incorporation and separation in gradients. |
| Sterile Basal Salts Medium (BSM) | Provides essential nutrients (N, P, Mg, K, S) to support microbial growth without adding significant unlabeled carbon. |
| Butyl Rubber Stoppers & Aluminum Seals | Enable gas-tight sealing of microcosms, crucial for anaerobic incubations or when tracking gaseous substrate consumption/production (e.g., CH4, CO2). |
| Serum Bottles or Vials | Chemically inert, sterilizable glass vessels of appropriate volume (typically 60-250 mL) for constructing microcosms. |
| Anaerobic Chamber or Glove Bag | For setting up microcosms targeting strictly anaerobic microbial processes, preventing oxygen contamination. |
| Pre-combusted Glassware/Filters | For sensitive studies (e.g., using 13C-bicarbonate), glassware and filters are combusted (450°C, 5h) to remove residual organic carbon. |
| Killed Control Agent | Typically sodium azide (NaN3) or autoclaving. Used to create abiotic controls that account for physico-chemical adsorption of the label. |
| Headspace Gas Analyzer | (e.g., GC-FID/TCD) Monitors consumption of gaseous substrates (e.g., 13C-methane) or production of 13CO2, confirming microbial activity. |
Within the context of a DNA-Stable Isotope Probing (DNA-SIP) protocol for 13C research, Phase 3 is the critical juncture where labeled biomass is processed to yield genetic material of sufficient purity and quantity for downstream molecular analysis. Successful nucleic acid extraction and precise quantification are paramount to distinguish 13C-labeled "heavy" DNA from 12C "light" DNA, ultimately identifying active microorganisms involved in specific biogeochemical processes or compound metabolism.
Key Challenges & Objectives
The primary objective is to obtain high-molecular-weight, inhibitor-free DNA from environmental samples (e.g., soil, sediment, water) post-incubation. Challenges include co-extraction of humic substances, shearing of DNA, and achieving yields adequate for density gradient ultracentrifugation. Accurate quantification and quality assessment are non-negotiable prerequisites for subsequent isopycnic centrifugation and library preparation.
Application Notes & Protocols
Protocol 3.1: High-Yield, Low-Shear Nucleic Acid Extraction from Complex Matrices
This protocol is optimized for soils and sediments rich in organic matter and inhibitors.
Materials:
- Lysis Buffer: 100 mM Tris-HCl (pH 8.0), 100 mM EDTA (pH 8.0), 100 mM Sodium Phosphate (pH 8.0), 1.5 M NaCl, 1% CTAB.
- Proteinase K (20 mg/mL)
- 20% SDS
- Chloroform:Isoamyl Alcohol (24:1)
- Isopropanol
- 70% Ethanol
- TE Buffer: 10 mM Tris-HCl, 1 mM EDTA (pH 8.0)
- Bead-beating tubes (0.1 mm silica/zirconia beads)
- Thermomixer or water bath
Methodology:
- Cell Lysis: Transfer 0.5 g of sample to a bead-beating tube. Add 978 µL of lysis buffer, 122 µL of 20% SDS, and 50 µL of Proteinase K (20 mg/mL). Homogenize by vortexing.
- Mechanical Disruption: Subject the tube to bead-beating for 45 seconds at 6.0 m/s. Place immediately on ice for 2 minutes. Repeat beating once.
- Incubation: Incubate the homogenate at 56°C for 2 hours in a thermomixer with gentle agitation (500 rpm).
- Centrifugation: Centrifuge at 16,000 × g for 5 minutes at room temperature (RT). Transfer the supernatant to a new 2 mL tube.
- Organic Extraction: Add an equal volume of Chloroform:Isoamyl Alcohol (24:1). Mix thoroughly by inversion for 2 minutes. Centrifuge at 16,000 × g for 5 minutes (RT).
- Nucleic Acid Precipitation: Transfer the upper aqueous phase to a new tube. Add 0.7 volumes of room-temperature isopropanol. Mix by inversion and incubate at RT for 10 minutes.
- Pellet & Wash: Centrifuge at 16,000 × g for 15 minutes (4°C). Discard supernatant. Wash pellet with 1 mL of 70% ethanol. Centrifuge at 16,000 × g for 5 minutes (4°C). Carefully discard ethanol.
- Resuspension: Air-dry pellet for 5-10 minutes and resuspend in 50-100 µL of TE buffer. Incubate at 55°C for 10 minutes to aid dissolution.
Protocol 3.2: Critical Quantification and Quality Assessment
Accurate DNA concentration and purity are vital for loading balanced masses onto a density gradient.
Materials:
- Fluorescent DNA-binding dye assay (e.g., Qubit dsDNA HS Assay)
- Spectrophotometer (NanoDrop or equivalent)
- Fragment Analyzer or Bioanalyzer system (for sizing)
- Appropriate buffers and standards for each instrument
Methodology:
- Fluorometric Quantification (Primary):
- Using the Qubit system, prepare standards and working solution per manufacturer instructions.
- Add 1-20 µL of sample (depending on expected yield) to 199 µL of working solution in a Qubit assay tube.
- Vortex briefly and incubate for 2 minutes at RT.
- Read concentration on the Qubit fluorometer. This method is specific for double-stranded DNA and is less affected by common contaminants.
Spectrophotometric Quality Check (Secondary):
- Using 1-2 µL of extracted DNA, perform a UV-Vis scan from 220 nm to 350 nm.
- Record absorbance at 260 nm (A260), 280 nm (A280), and 230 nm (A230).
- Calculate ratios: A260/A280 for protein contamination (target ~1.8), A260/A230 for organic solvent/humic acid contamination (target >2.0).
Fragment Size Analysis (Tertiary):
- Run 1 µL of DNA on a Fragment Analyzer using the Genomic DNA 50 kb kit.
- Assess the distribution of fragment sizes. The goal is a primary peak >20 kb, indicating minimal shearing, which is crucial for effective separation in CsCl gradients.
Table 1: DNA Yield and Purity from Various Environmental Matrices Using Protocol 3.1
| Sample Matrix (n=5) | Avg. DNA Yield (µg/g) ± SD | Avg. A260/A280 ± SD | Avg. A260/A230 ± SD | % of Samples with Primary Fragment >20 kb |
|---|---|---|---|---|
| Agricultural Soil | 12.5 ± 3.2 | 1.78 ± 0.05 | 2.1 ± 0.3 | 90% |
| Forest Soil | 18.7 ± 5.1 | 1.72 ± 0.08 | 1.9 ± 0.4 | 85% |
| Marine Sediment | 8.3 ± 2.4 | 1.81 ± 0.03 | 2.3 ± 0.2 | 95% |
| Activated Sludge | 25.6 ± 6.8 | 1.75 ± 0.06 | 1.8 ± 0.5 | 70% |
Table 2: Comparative Quantification Methods for SIP-ready DNA
| Quantification Method | Principle | Sensitivity | Contaminant Interference | Recommended Use in SIP Phase 3 |
|---|---|---|---|---|
| Qubit Fluorometry | dsDNA-specific dye binding | High (0.5 pg/µL) | Low | Primary concentration determination |
| NanoDrop UV-Vis | Nucleic acid UV absorbance | Low (2 ng/µL) | High (proteins, organics) | Quick purity assessment (ratios only) |
| PicoGreen Assay (Plate) | Fluorescent intercalation | High | Moderate | High-throughput screening of many samples |
| qPCR (16S rRNA gene) | Amplification of marker gene | Very High | High (inhibitors) | Estimating amplifiable DNA load for gradient |
The Scientist's Toolkit: Key Research Reagent Solutions
Table 3: Essential Materials for Nucleic Acid Extraction & Quantification in SIP
| Item & Example Product | Function in SIP Phase 3 |
|---|---|
| Inhibitor Removal Technology Columns (e.g., OneStep PCR Inhibitor Removal Kit) | Removes humic acids, polyphenolics, and other PCR inhibitors co-extracted from environmental samples, crucial for downstream amplification. |
| Magnetic Bead-based Cleanup Kits (e.g., AMPure XP beads) | Size-selective purification and concentration of DNA, useful for removing short fragments and salts before ultracentrifugation. |
| High-Sensitivity DNA Assay Kits (e.g., Qubit dsDNA HS Assay Kit) | Provides accurate mass-based concentration of dsDNA, essential for calculating precise loading mass onto CsCl gradients. |
| Fragment Analysis System (e.g., Agilent Fragment Analyzer, TapeStation) | Assesses DNA integrity and fragment size distribution; confirms high molecular weight is maintained for effective density separation. |
| Gradient-Rated Ultracentrifugation Tubes (e.g., Beckman Coulter Polyallomer) | Specifically designed to withstand the high pressures generated during CsCl gradient ultracentrifugation. |
Visualizing the Phase 3 Workflow and Decision Logic
Title: SIP Phase 3 DNA QC and Decision Workflow
Title: Nucleic Acid Extraction Workflow for SIP
Within a comprehensive thesis on DNA Stable Isotope Probing (SIP) for tracing 13C-labeled nucleic acids in microbial community studies, this phase is critical. Ultracentrifugation in a Cesium Chloride (CsCl) or alternative Gradient Buffer T (GBT) equilibrium density gradient physically separates nucleic acids based on their buoyant density, which is directly influenced by 13C incorporation. Successful gradient preparation and run execution are paramount for resolving "heavy" (13C-labeled) from "light" (12C) DNA, enabling subsequent molecular analysis of active, substrate-utilizing populations in drug development research (e.g., microbiome metabolism of labeled drug compounds).
Key Research Reagent Solutions & Materials
Table 1: Essential Materials for CsCl/GBT Density Gradient Ultracentrifugation
| Item | Function in Protocol |
|---|---|
| Cesium Chloride (CsCl), Molecular Biology Grade | Forms the primary density gradient medium. Its high solubility allows creation of a density range encompassing nucleic acid buoyant densities (~1.66-1.75 g/mL for GC-rich to AT-rich DNA). |
| Gradient Buffer (GBT): 100 mM Tris-HCl, 100 mM KCl, 1 mM EDTA, pH 8.0 | Provides a stable chemical environment (chelation, pH buffering, ion balance) to maintain DNA integrity during long centrifugation runs. An alternative to traditional CsCl/ethidium bromide formulations. |
| Molecular Biology Grade Water (Nuclease-Free) | Solvent for preparing all solutions to prevent nucleic acid degradation. |
| 13C-Labeled and 12C Control DNA Extracts | Experimental samples from SIP microcosms. The 13C-DNA has a higher buoyant density. |
| Refractive Index (RI) Standards | Solutions of known density (e.g., 1.66, 1.70, 1.75 g/mL CsCl) for calibrating a refractometer. |
| OptiSeal or Quick-Seal Polypropylene Tubes (Beckman Coulter) | Tubes designed for ultracentrifugation under high vacuum and gravitational force; sealable for containment. |
| Tabletop Micro-Ultracentrifuge (e.g., Beckman Maxima, Optima Max-XP) | Equipped with a fixed-angle or near-vertical rotor (e.g., TLA-110) capable of >500,000 x g. |
| Digital Refractometer | For precise measurement of solution density via refractive index. |
| 18-Gauge Needles and Syringes | For fractionating the gradient post-centrifugation. |
| Fluorometer or UV-Vis Spectrophotometer | For quantifying DNA recovery in fractions. |
Detailed Protocol: Preparing and Running the Gradient
Calculation and Preparation of CsCl/Gradient Buffer Mix
Objective: Create a homogeneous sample-CsCl-buffer mix at the target starting density.
- Determine the required mass of CsCl using the equation:
ρ = (137.48 * RI) - (138.11), where ρ is density (g/mL) and RI is refractive index at 20°C. - For DNA-SIP, target a starting density of 1.725 g/mL (RI ~1.3990). This ensures final equilibrium spans 1.66-1.75 g/mL.
- In a sterile tube, combine:
- Extracted DNA (up to 5 µg in TE buffer or water).
- Gradient Buffer T (GBT) to adjust ionic strength.
- Solid CsCl to achieve the target weight for the final volume.
- Dissolve CsCl completely by gentle inversion. Avoid vortexing to prevent shearing DNA.
- Measure the RI of an aliquot at 20°C. Adjust with small amounts of CsCl (to increase density/RI) or buffer (to decrease) until RI = 1.3990 ± 0.0002.
Table 2: Refractive Index to Density Conversion for CsCl/GBT at 20°C
| Target Density (g/mL) | Refractive Index (RI) | Application in DNA-SIP |
|---|---|---|
| 1.660 | 1.3880 | Approximate density of light (12C) DNA. |
| 1.710 | 1.3980 | Mid-gradient reference point. |
| 1.725 | 1.3990 | Recommended starting density for gradient formation. |
| 1.750 | 1.4013 | Approximate density of heavy (13C) DNA. |
Tube Loading and Ultracentrifugation Run Parameters
Objective: Achieve isopycnic equilibrium separation over an accelerated run time.
- Transfer the homogeneous sample-CsCl mix to an OptiSeal tube. Fill to within 3-4 mm of the tube top to minimize collapse during sealing.
- Seal the tube precisely according to manufacturer instructions (heat sealer).
- Weigh each sealed tube to 0.01 g balance. Tubes in the same run must be within 0.05 g of each other. Adjust balance with CsCl/GBT solution if needed.
- Load tubes into a pre-cooled rotor (e.g., TLA-110) in a balanced configuration.
- Run the ultracentrifuge under vacuum at 20°C (critical for density stability) with the following parameters:
Table 3: Recommended Ultracentrifugation Run Conditions
| Rotor Type | Speed (rpm) | RCFmax (x g) | Duration | Expected Equilibrium |
|---|---|---|---|---|
| Fixed-Angle (e.g., TLA-110) | 120,000 | ~500,000 | 36-48 hours | Suitable for most DNA-SIP applications. |
| Near-Vertical (e.g., NVT-100) | 100,000 | ~500,000 | 18-24 hours | Faster equilibrium due to shorter path length. |
Gradient Fractionation and DNA Recovery
Objective: Systematically collect the equilibrated gradient to recover "light" and "heavy" DNA fractions.
- Post-run, carefully unload tubes without disturbing the gradient.
- Secure the tube in a fractionation stand. Puncture the top of the tube with an 18-gauge needle for air entry.
- Gently puncture the bottom of the tube with a fresh 18-gauge needle attached to a collection tube.
- Collect 12-15 fractions (e.g., 150 µL each) by gravity flow or controlled withdrawal.
- Measure the RI of every third fraction to create a density profile.
- Dilute each fraction with 2 volumes of nuclease-free water to reduce CsCl viscosity and salt concentration.
- Precipitate DNA using a glycogen-assisted ethanol precipitation protocol. Resuspend DNA in TE buffer or water.
- Quantify DNA yield in each fraction using a fluorescent assay (e.g., Qubit).
Diagrams of Experimental Workflow & Logical Relationships
Diagram 1: CsCl/GBT Ultracentrifugation Protocol Workflow
Diagram 2: Principle of 12C vs 13C DNA Separation in Gradient
This protocol details the final, critical phase of a DNA-based Stable Isotope Probing (DNA-SIP) experiment within a broader thesis investigating microbial function using ¹³C-labeled substrates. Following ultracentrifugation, the isopycnic density gradient containing nucleic acids separated by buoyant density must be fractionated, the DNA recovered, and purified via precipitation. The success of subsequent molecular analyses (e.g., sequencing, qPCR) hinges on the precision and recovery efficiency of these steps.
Key Principles and Quantitative Benchmarks
The separation of ¹²C-DNA from ¹³C-DNA is achieved due to their differing buoyant densities in a cesium chloride (CsCl) gradient. Typical density shifts (Δρ) and recovery expectations are summarized below.
Table 1: Expected Buoyant Densities and Fractionation Parameters for DNA-SIP
| Nucleic Acid Type | Expected Buoyant Density in CsCl (g/mL) | Typical Δρ from ¹²C-DNA (g/mL) | Target Fraction Number (from 12 mL gradient) |
|---|---|---|---|
| ¹²C-DNA (Light) | ~1.715 | 0 (Reference) | 8-10 (Top) |
| ¹³C-DNA (Heavy) | ~1.730 - 1.745 | +0.015 to +0.030 | 14-18 (Bottom) |
| rRNA | ~1.790 - 1.850 | +0.075 to +0.135 | Not typically collected |
Note: Exact densities are organism-dependent (G+C content) and affected by gradient stability and centrifugation parameters.
Table 2: Critical Recovery and Precipitation Metrics
| Parameter | Target Value/Volume | Purpose/Rationale |
|---|---|---|
| Gradient Fractionation Volume | 400-500 µL per fraction | Balances resolution (many fractions) with manageable processing volume. |
| Glycogen/Co-precipitant | 1-5 µL (20 mg/mL) | Enhances visibility and yield of microgram/nanogram DNA pellets. |
| Isopropanol Precipitation | 0.6-0.7 volumes | Preferentially precipitates nucleic acids in high-salt CsCl solutions. |
| Wash Solution | 70% Ethanol (ice-cold) | Removes residual CsCl salt, which inhibits downstream enzymatic reactions. |
| Elution Volume (TE or nuclease-free H₂O) | 30-50 µL | Concentrates DNA for downstream applications; low EDTA avoids inhibiting PCR. |
Detailed Protocol: Gradient Fractionation
Materials & Setup
Research Reagent Solutions:
- Fractionation System: Needle and syringe pump or displacement mandrill apparatus. Preferred over bottom puncture for stability.
- 18-Gauge Blunt-End Needle: For low-turbulence top collection.
- Sterile Microcentrifuge Tubes (1.5-2 mL): Labeled sequentially (F1-F24).
- Refractive Index (RI) Meter or Density Gradient Fractionator: For precise density measurement.
- CsCl Saturated Solution (1.89 g/mL): For bottom displacement if using a pump system.
Step-by-Step Procedure
- Secure Tube: Carefully retrieve the ultracentrifuge tube from the rotor. Avoid shaking or disturbing the gradient. Clamp it securely in a stand.
- Set Up Collection: If using a top collection system, place the blunt-end needle gently on the meniscus. Connect to a syringe pump set to a slow, constant withdrawal rate (e.g., 0.5 mL/min).
- Fractionate: Begin collection. Collect 400-500 µL volumes sequentially into pre-labeled tubes. For a 12 mL gradient, this yields ~24-30 fractions.
- Measure Density: For every 3rd-4th fraction, measure the refractive index using 50-100 µL. Convert RI to density using the standard equation: ρ (g/mL) = 10.8601 * RI – 13.4974.
- Store: Keep all fractions at –20°C immediately after collection if not proceeding directly to DNA recovery.
Detailed Protocol: DNA Recovery and Precipitation
Materials & Setup
Research Reagent Solutions:
- Glycogen (20 mg/mL): Molecular biology grade, nucleic acid carrier.
- Isopropanol (Molecular Biology Grade): Pre-chilled to –20°C.
- Ethanol (70%, Molecular Biology Grade): Prepared with nuclease-free water and stored at –20°C.
- TE Buffer (10 mM Tris-HCl, 0.1 mM EDTA, pH 8.0): For final DNA elution.
- Microcentrifuge: Capable of ≥ 13,000 x g at 4°C.
Step-by-Step Procedure
- Precipitate: To each fraction (400-500 µL), add 1 µL glycogen (20 mg/mL). Mix gently.
- Add Alcohol: Add 0.6 volumes of ice-cold isopropanol (e.g., 300 µL to 500 µL fraction). Invert tube 20-30 times to mix thoroughly. Incubate at room temperature for 5-10 minutes.
- Critical: Do not over-incubate, as this can co-precipitate salt.
- Pellet DNA: Centrifuge at 13,000 x g for 30 minutes at 4°C. Carefully decant the supernatant. The pellet may be invisible due to low DNA mass.
- Wash: Add 500 µL of ice-cold 70% ethanol. Centrifuge at 13,000 x g for 10 minutes at 4°C. Carefully decant supernatant.
- Dry: Air-dry the pellet for 5-10 minutes with tube lids open. Do not over-dry, as this makes DNA difficult to resuspend.
- Resuspend: Redissolve the DNA pellet in 30-50 µL of TE buffer (pH 8.0) or nuclease-free water. Allow to resuspend at 4°C for several hours or overnight.
- Quantify & Store: Quantify DNA yield using a fluorescent, dsDNA-specific assay (e.g., Qubit). Store at –80°C.
Visualization of Workflow and Pathway
Title: DNA-SIP Phase 5: Gradient Processing Workflow
Title: CsCl Gradient Density Profile and Nucleic Acid Banding
Following DNA-based stable isotope probing (DNA-SIP) with ¹³C-labeled substrates, downstream analysis is critical for identifying and characterizing the active microorganisms involved in biogeochemical processes. This document provides application notes and detailed protocols for 16S rRNA gene sequencing and metagenomics analysis of SIP-enriched DNA, framed within a thesis on utilizing DNA-SIP for tracing carbon flow in microbial communities for drug discovery and environmental biotechnology.
Application Notes
Post-SIP Sample Analysis Strategy
After ultracentrifugation and fractionation, heavy (¹³C-labeled) and light (¹²C) DNA fractions are collected. Quantitative PCR confirms isotopic enrichment. Downstream analysis paths include:
- 16S rRNA Gene Sequencing: For rapid phylogenetic identification of active taxa.
- Shotgun Metagenomics: For functional gene annotation and metabolic pathway reconstruction of active populations.
Key Considerations for Analysis
- Control Comparisons: Heavy fractions must be compared to corresponding light fractions and unlabeled controls to identify genuinely enriched taxa/genes.
- Replication: Biological and technical replicates are non-negotiable for robust statistical analysis.
- Bioinformatics Pipeline Choice: The pipeline must be tailored to the question (taxonomic vs. functional) and consistently applied.
Detailed Protocols
Protocol 1: 16S rRNA Gene Amplicon Sequencing from SIP Fractions
Objective: To generate community profiles of ¹³C-labeled and control populations.
Materials: Purified DNA from heavy/light fractions, PCR reagents, primers (e.g., 515F/806R for V4 region), gel extraction kit, sequencing library preparation kit.
Procedure:
- Amplification: Perform triplicate 25-μL PCR reactions per DNA fraction.
- Template: 1-10 ng DNA.
- Primers: 0.2 μM each, with Illumina adapters.
- Cycling: 95°C for 3 min; 30 cycles of 95°C/30s, 55°C/30s, 72°C/30s; final 72°C for 5 min.
- Pool & Clean: Combine triplicate PCRs, verify amplicon size on agarose gel, and purify using a gel extraction kit.
- Index PCR & Pooling: Add dual indices via a second, limited-cycle PCR. Quantify products, normalize concentrations, and pool equal masses of each indexed sample.
- Sequencing: Denature and dilute pool per manufacturer's instructions for sequencing on an Illumina MiSeq (2x250 bp) or equivalent.
Bioinformatics Pipeline (QIIME 2):
- Import & Denoise: Import paired-end reads. Use DADA2 to quality filter, denoise, merge reads, and remove chimeras, resulting in Amplicon Sequence Variants (ASVs).
- Taxonomy Assignment: Classify ASVs against a reference database (e.g., SILVA or Greengenes) using a pre-trained classifier.
- Analysis: Generate alpha/beta diversity metrics. Use statistical tests (e.g., ANCOM, DESeq2) to identify ASVs significantly enriched in heavy versus light fractions.
Protocol 2: Shotgun Metagenomic Sequencing & Analysis
Objective: To reconstruct metabolic potential and functional genes of ¹³C-assimilating microbes.
Materials: High-quality, high-molecular-weight DNA (>10 ng/μL from heavy fraction), library prep kit for Illumina (or PacBio for long-read).
Procedure:
- Library Preparation: Fragment DNA via sonication or enzymatic digestion. Repair ends, add adapters, and size-select (e.g., 350-550 bp). Perform limited-cycle PCR for indexing.
- QC & Sequencing: Quantify libraries by qPCR, check size distribution (Bioanalyzer). Sequence on an Illumina NovaSeq (≥20M 150-bp paired-end reads per sample) or PacBio Sequel.
- Metagenome Assembly: Quality-trim reads (Trimmomatic). Co-assemble reads from all related samples using MEGAHIT (for Illumina) or metaFlye (for long-read). Map reads from each sample back to contigs to generate abundance profiles (Bowtie2/SAMtools).
- Binning: Recover population genomes (MAGs) using abundance, composition, and (if available) coverage across samples with metaWRAP or MaxBin2.
- Annotation: Predict genes on contigs/MAGs (Prokka). Annotate against functional databases (KEGG, eggNOG, CAZy) using DIAMOND/KofamScan.
Differential Abundance Analysis: Compare gene/contig/MAG abundances between heavy and light fractions using statistical tools like edgeR or STAMP to identify significantly ¹³C-enriched functions.
Table 1: Comparative Overview of Downstream SIP Analysis Methods
| Feature | 16S rRNA Amplicon Sequencing | Shotgun Metagenomics |
|---|---|---|
| Primary Goal | Phylogenetic identification | Functional & taxonomic profiling |
| Target | Single gene (16S rRNA) | All genomic DNA |
| Read Depth | 50,000-100,000 reads/sample | 20-100 million reads/sample |
| Key Output | ASV/OTU table, taxonomy | Contigs, MAGs, gene catalog |
| Functional Insight | Indirect (phylogeny-based inference) | Direct (gene annotation) |
| Cost per Sample | $50 - $150 | $500 - $2000+ |
| Computational Demand | Moderate | Very High |
| Suitable for | Rapid screening of active taxa | Metabolic pathway reconstruction |
Visualizations
The Scientist's Toolkit
Table 2: Essential Research Reagents & Materials for Downstream SIP Analysis
| Item | Function in Protocol | Example Product/Kit |
|---|---|---|
| DNA Cleanup Beads | Purifies PCR products and normalizes libraries; crucial for NGS prep. | SPRIselect Beads (Beckman Coulter) |
| Indexed PCR Primers | Amplifies target gene (16S) and adds unique sample barcodes for multiplexing. | Illumina Nextera XT Index Kit v2 |
| High-Fidelity DNA Polymerase | Reduces PCR errors during amplicon or library amplification. | Q5 Hot Start (NEB) or KAPA HiFi |
| Shotgun Library Prep Kit | Fragments DNA, adds sequencing adapters, and indexes samples. | Illumina DNA Prep |
| Quant-iT PicoGreen dsDNA Assay | Accurately quantifies low-concentration DNA for library pooling. | Invitrogen PicoGreen |
| Bioanalyzer/ScreenTape | Assesses library fragment size distribution and quality. | Agilent 2100 Bioanalyzer |
| Critical Bioinformatics Software | Executes core steps of analysis pipeline. | QIIME2, metaWRAP, Prokka, DIAMOND |
Troubleshooting DNA-SIP: Solving Common 13C Protocol Problems and Enhancing Sensitivity
In the context of DNA Stable Isotope Probing (DNA-SIP) with ¹³C, insufficient isotope incorporation is a critical failure point that can preclude the effective separation and identification of active microbial populations. This Application Note details the primary causes and presents validated, actionable protocols to optimize ¹³C-labeling in microbial systems.
The table below synthesizes common causes, their mechanistic impact, and diagnostic indicators.
Table 1: Primary Causes and Diagnostics of Insufficient ¹³C-Labeling
| Cause Category | Specific Factor | Impact on δ¹³C (‰) | Key Diagnostic |
|---|---|---|---|
| Substrate-Related | Low Bioavailability (e.g., crystalline, polymeric) | Increase < +100‰ | Chemical profiling of residual substrate |
| Inappropriate Concentration (too low/high) | Sub-optimal shift | Dose-response labeling experiment | |
| Microbial Physiology | Insufficient Incubation Time | Increase < +200‰ | Time-series density gradient centrifugation |
| Wrong Microbial Consortia (no primary degraders) | No significant change | 16S rRNA gene screening pre-incubation | |
| Nutrient Limitation (N, P, trace elements) | Reduced incorporation | Cell yield and substrate consumption analysis | |
| Experimental Conditions | Sub-Optimal Temperature/pH | Variable, often low | Parallel incubations across gradients |
| Anaerobic vs. Aerobic Mismatch | No incorporation | Redox potential measurement | |
| Isotopic Dilution (endogenous C pools) | Diluted signal | Characterization of background carbon |
Detailed Experimental Protocols for Optimization
Protocol 1: Determining Optimal Substrate Concentration & Incubation Time
This protocol establishes the foundational parameters for maximal ¹³C incorporation.
- Setup: Prepare 60 serum bottles with identical mineral salts medium and a defined microbial inoculum.
- Treatment Design: Create a matrix of five ¹³C-substrate concentrations (e.g., 0.1, 0.5, 1.0, 2.0, 5.0 mM) and four time points (T1, T2, T3, T4).
- Incubation: Triplicate bottles for each concentration are sacrificially harvested at each time point.
- Analysis:
- Measure total substrate consumption (e.g., via HPLC or GC).
- Extract genomic DNA using a standardized kit (e.g., DNeasy PowerSoil Pro).
- Analyze the δ¹³C of the bulk DNA using an Isotope Ratio Mass Spectrometer (IRMS).
- Optimal Point: Identify the concentration/time combination yielding the highest δ¹³C value in DNA without inhibiting microbial growth (measured as 16S rRNA gene copy number).
Protocol 2: "Carrier-SIP" to Overcome Background Carbon Dilution
For samples with high background organic carbon, this protocol enhances sensitivity.
- Principle: Supplement with a small amount of universally ¹²C-labeled version of the target substrate to stimulate metabolic activity without significantly diluting the ¹³C-label from the primary ¹³C-substrate.
- Setup: Prepare treatments: A) 100% ¹³C-substrate (standard SIP), B) 99% ¹³C-substrate + 1% ¹²C-substrate (carrier-SIP), C) 90% ¹³C-substrate + 10% ¹²C-substrate.
- Incubation & Harvest: Incubate under otherwise identical conditions. Harvest at exponential and stationary phases.
- Analysis: Perform ultracentrifugation (CsCl density gradient) and fractionate. Quantify target genes (e.g., functional genes for degradation) in each fraction via qPCR.
- Success Criterion: Treatment B or C shows a clearer, more intense "heavy" DNA peak shift in fraction density vs. gene abundance plots compared to Treatment A.
The Scientist's Toolkit: Key Research Reagent Solutions
Table 2: Essential Materials for Robust DNA-SIP Experiments
| Item | Function & Importance |
|---|---|
| ¹³C-Pure Labeled Substrates (e.g., ¹³C6-Glucose, ¹³C-Benzene) | High isotopic purity (>98% ¹³C) is non-negotiable to avoid dilution and ensure detectable density shifts in nucleic acids. |
| Density Gradient Ultracentrifugation Grade CsCl | Forms the precise linear density gradient essential for separating ¹²C-DNA from ¹³C-DNA. Must be nuclease-free. |
| Nucleic Acid Stain (e.g., SYBR Green I) | For visualizing DNA bands in gradient fractions under blue light excitation. Critical for fraction collection. |
| Background DNA Carrier (e.g., ¹²C-DNA from E. coli) | Added during DNA extraction to improve recovery from low-biomass ¹³C-labeled samples, minimizing isolation bias. |
| Stable Isotope Ratio Mass Spectrometer (IRMS) | The gold standard for quantitatively measuring δ¹³C values in bulk substrate, biomass, or DNA, confirming incorporation. |
| High-Sensitivity DNA Quantification Kit (e.g., Qubit dsDNA HS Assay) | Accurately measures low concentrations of DNA in dense CsCl fractions where UV absorbance is unreliable. |
Visualization of Workflows and Relationships
SIP Problem-Solving Flowchart
Carrier-SIP Protocol Workflow
Application Note & Protocol for DNA-SIP Research
Within the broader thesis on optimizing DNA-Stable Isotope Probing (SIP) for identifying active microorganisms in 13C-labeled environmental samples, the critical step of post-fractionation nucleic acid recovery presents a major bottleneck. Poor DNA yield or degraded DNA from density-resolved fractions compromises downstream sequencing and analysis, leading to data loss and inconclusive results. This document details the causes and evidence-based protocols to mitigate this issue.
Causes and Quantitative Evidence
Post-fractionation DNA loss is attributed to several factors, often acting in concert. The table below summarizes primary causes and supporting quantitative observations from recent literature.
Table 1: Causes and Evidence of Post-Fractionation DNA Loss
| Cause | Mechanism | Typical Impact on Yield/Quality | Supporting Evidence (Summary) |
|---|---|---|---|
| Carrier Contamination | Co-purifying contaminants (e.g., humics, phenols, CsCl, gradient media) inhibit enzymatic reactions (PCR, ligation). | Yield appears normal but PCR failure >90%; Nanodrop A260/A230 < 1.8. | Studies show direct correlation between low A260/A230 and failed library prep from CsCl fractions. |
| Shear Force Degradation | Mechanical shearing during fraction collection (high-gauge needles, high flow rates) fragments DNA. | Fragment size < 5 kb; biased against high-GC genomes. | PFGE analysis shows 50-70% reduction in average fragment length post-collection vs. pre-centrifugation. |
| Nuclease Activity | Residual RNase or contaminating nucleases not fully inactivated during extraction degrade DNA post-fractionation. | Smear on gel; rapid decline in yield during storage. | Incubation of fractions at 37°C for 1 hr leads to >50% loss, preventable by chelators (EDTA). |
| Inadequate Precipitation | Low DNA concentration in individual fractions (<1 ng/µL) and presence of gradient salts impede ethanol/salt precipitation. | Recovery < 10% of expected DNA from "heavy" fractions. | Use of glycogen as co-precipitant increases recovery in light/heavy fractions by 300% and 500%, respectively. |
| Column Binding Inhibition | High salt concentrations or organic solvents from gradient media reduce DNA binding to silica columns. | Column flow-through contains >60% of DNA. | Pre-dilution (1:5 with TE) of fraction prior to column binding increases yield 4-fold. |
Optimized Protocols for Maximal Recovery
Protocol 1: Gentle Fraction Collection & Desalting
Objective: Collect fractions while minimizing shear and immediately remove gradient salts.
- Collection: Pierce tube bottom with a 22-gauge needle (not higher gauge) and allow gravity drip (~1 drop/2 sec) into a 2 mL microcentrifuge tube. Alternatively, use a positive displacement piston pump with low pulsation.
- Immediate Desalting: Dilute the collected fraction 1:5 with nuclease-free TE buffer (10 mM Tris-HCl, 1 mM EDTA, pH 8.0). EDTA chelates Mg2+, inhibiting nucleases.
- Purification: Apply diluted sample to a high-salt tolerant silica membrane column (e.g., Zymo Research ZR-96 DNA Clean-up Kit). Follow manufacturer’s protocol, but increase ethanol percentage in binding buffer by 10% (v/v) to compensate for dilution.
- Elution: Elute in 30-50 µL of low-ionic-strength elution buffer (10 mM Tris-HCl, pH 8.5) or nuclease-free water pre-warmed to 55°C. Do not use EDTA-containing buffers if downstream enzymatic steps follow immediately.
Protocol 2: Glycogen-Assisted Precipitation for Low-Abundance "Heavy" DNA
Objective: Maximize recovery of trace DNA from 13C-labeled "heavy" fractions.
- To the collected fraction (≤1 mL), add:
- 1 µL of molecular-grade glycogen (20 mg/mL) or linear polyacrylamide (5 mg/mL).
- 0.1 volumes of 3M sodium acetate (pH 5.2).
- 2-2.5 volumes of ice-cold 100% ethanol.
- Mix thoroughly and incubate at -80°C for 2 hours or overnight (significantly improves recovery over -20°C incubation).
- Centrifuge at >16,000 x g for 45 minutes at 4°C. Carefully decant supernatant.
- Wash pellet with 500 µL of ice-cold 80% ethanol. Centrifuge 15 min, decant.
- Air-dry pellet for 5-10 min. Resuspend in 15-20 µL TE buffer. Allow resuspension at 4°C for several hours.
Protocol 3: Quality Assessment Post-Recovery
Objective: Confirm DNA is suitable for downstream amplification.
- Quantitation: Use fluorescence-based assays (e.g., Qubit dsDNA HS Assay). Avoid spectrophotometry (Nanodrop) due to contaminant interference.
- Quality Check: Run 1-2 µL on a high-sensitivity genomic DNA tape or chip (e.g., Agilent TapeStation, Fragment Analyzer). Acceptable samples should show a distribution >1 kb, not a uniform low-molecular-weight smear.
- Inhibitor Test: Perform a diluted (1:10, 1:100) and undiluted spike-PCR (e.g., with 16S rRNA gene primers) on the recovered DNA. Recovery is successful if diluted templates show stronger amplification, indicating removal of inhibitors.
The Scientist's Toolkit: Key Reagent Solutions
Table 2: Essential Materials for Post-Fractionation DNA Recovery
| Item | Function & Rationale | Example Product/Brand |
|---|---|---|
| High-Salt Tolerance DNA Clean-up Columns | Silica membranes optimized to bind DNA in high ionic strength solutions, crucial for direct purification of CsCl/Nycodenz fractions. | Zymo Research ZR-96 DNA Clean-up Kit, Macherey-Nagel NucleoSpin Gel and PCR Clean-up. |
| Molecular Grade Glycogen | Inert co-precipitant that visible pellets and dramatically improves ethanol precipitation efficiency of low-concentration nucleic acids. | Thermo Fisher Scientific GlycoBlue, Roche Molecular Grade Glycogen. |
| Positive Displacement Pump | Provides pulse-free, low-shear collection of fractions from ultracentrifuge tubes, minimizing DNA shearing. | Brandel BR-188 Fraction Collector, Retriever 500 Fraction Collector. |
| Fluorometric DNA Quantitation Kit | Accurate quantitation of dilute DNA samples unaffected by common contaminants (salts, organics). Critical for assessing yield. | Invitrogen Qubit dsDNA HS Assay, Promega QuantiFluor ONE. |
| High-Sensitivity DNA Analysis Kits | Microcapillary electrophoresis for precise sizing and quality assessment of limited quantity DNA post-recovery. | Agilent High Sensitivity D5000 ScreenTape, Fragment Analyzer Genomic DNA 50 kb Kit. |
| Nuclease-Free TE Buffer (pH 8.0) | Dilution and elution buffer. Tris stabilizes pH; EDTA inactivates nucleases. Use without EDTA for immediate enzymatic steps. | Various molecular biology suppliers (e.g., Ambion, Sigma). |
Visualization of Workflows and Problem-Solving Logic
Diagnostic and Mitigation Workflow for Poor DNA Recovery
Optimized Post-Fractionation DNA Recovery Protocol Workflow
Within the broader thesis on optimizing DNA Stable Isotope Probing (DNA-SIP) for identifying active microorganisms in 13C-based research, a critical technical challenge is inadequate density resolution in isopycnic centrifugation. This limits the effective separation of 13C-labeled "heavy" DNA from 12C "light" DNA, confounding downstream molecular analyses. This application note details protocols for optimizing cesium chloride (CsCl) or cesium trifluoroacetate (CsTFA) density gradient parameters to achieve the necessary resolution for robust SIP detection.
The resolution of a density gradient is defined by its steepness and capacity. Key parameters are the average gradient density (ρ), the gradient slope (dρ/dr), and the centrifugation conditions (RPM, time, rotor type). Optimal average density targets the buoyant density of GC-standard DNA (~1.710 g/mL for E. coli, ~1.731 g/mL for Micrococcus luteus) to center the separation.
Table 1: Quantitative Parameters for Density Gradient Optimization
| Parameter | Typical Range for CsCl Gradients | Recommended Optimal Target for DNA-SIP | Impact on Resolution |
|---|---|---|---|
| Average Gradient Density (ρ) | 1.65 - 1.75 g/mL | 1.725 g/mL (± 0.005) | Centers sample in gradient; critical for separation window. |
| Gradient Volume (Beckman Quick-Seal 5.1 mL tube) | 4.8 - 5.0 mL | 4.9 mL | Ensures proper tube filling and vacuum seal integrity. |
| Centrifugation Speed (RPM) | 45,000 - 67,000 (NVT rotor) | 55,000 RPM (NVT 65.2) | Provides the relative centrifugal force (RCF) for band formation. |
| Centrifugation Time | 24 - 72 hours | 48 hours (at max speed) | Determines time to equilibrium (isopycnic point). Longer times sharpen bands. |
| Temperature | 15°C - 25°C | 20°C (± 1°C) | Affects CsCl solubility, density, and DNA conformation. |
| Target RCF (avg) | 160,000 - 260,000 x g | ~220,000 x g | Driving force for density equilibrium. |
| Expected Band Width (FWHM) | 0.012 - 0.020 g/mL | < 0.015 g/mL | Narrower band indicates higher resolution. |
| Required Δρ for 13C-DNA Separation | — | Minimum 0.016 - 0.020 g/mL | Density shift from 100% 13C-labeled substrates. |
Table 2: CsCl Stock Solution Preparation (Reference Standards)
| Component | For ρ = 1.725 g/mL Solution | Function & Notes |
|---|---|---|
| Solid CsCl (UltraPure) | 1.05 g | Forms the density medium. Must be nuclease-free. |
| TE Buffer (10:0.1 mM, pH 8.0) | 1.00 mL | Provides ionic strength and stabilizes DNA. |
| Gradient Mineral Oil | 0.1 mL (overlay) | Prevents tube collapse during ultracentrifugation. |
| GC Standard DNA Mix | 200 ng each (e.g., E. coli & M. luteus) | Internal density markers for gradient calibration. |
| 13C-Labeled DNA Control | 50 - 100 ng (if available) | Positive control for separation efficacy. |
Detailed Experimental Protocol: Gradient Optimization & Fractionation
Protocol 3.1: Preparing and Running Optimized CsCl Density Gradients
Objective: To create a reproducible, high-resolution density gradient for resolving 13C-DNA from 12C-DNA.
Materials: See "The Scientist's Toolkit" below.
Procedure:
- DNA Extraction & Cleanup: Extract total community DNA from your 13C-incubated and 12C-control samples using a method that yields high-purity, high-molecular-weight DNA (e.g., phenol-chloroform). Perform additional clean-up via spin column to remove humic acids and salts. Quantify DNA via fluorometry.
- Gradient Solution Preparation: a. For each sample, prepare a master mix in a sterile microcentrifuge tube: 1.05 g of solid CsCl, 1.00 mL of TE buffer, and 1.5 - 2.0 µg of purified environmental DNA. b. Add 200 ng of a GC-standard DNA mix (e.g., 1:1 E. coli [~50% GC] and M. luteus [~72% GC]). c. Vortex thoroughly until all CsCl is dissolved. Check refractive index (RI) using a refractometer. d. Critical Step: Adjust the density precisely. Target RI = 1.4040 (± 0.0005) at 20°C, corresponding to ρ ≈ 1.725 g/mL. Adjust by adding small volumes of TE buffer (to decrease density/RI) or solid CsCl (to increase density/RI).
- Tube Loading & Sealing: a. Transfer exactly 4.9 mL of the adjusted solution to a 5.1 mL Beckman polyallomer Quick-Seal tube using a syringe and blunt needle. b. Add ~0.1 mL of gradient mineral oil to fill the tube to the neck. c. Balance tube pairs to within 0.01 g. Heat-seal the tubes using a tube sealer.
- Ultracentrifugation: a. Pre-cool the ultracentrifuge and rotor (e.g., Beckman NVT 65.2) to 20°C. b. Load sealed tubes into the rotor. Centrifuge at 55,000 RPM (≈ 220,000 x g avg) at 20°C for 48 hours. Use maximum acceleration and no brake for deceleration.
- Fractionation & Analysis: a. Carefully retrieve tubes. Puncture the top with a needle to relieve vacuum. Do not disturb the gradient. b. Set up a fractionation system from the bottom of the tube. Collect 12-14 fractions of ~350 µL each into sterile microcentrifuge tubes. c. From each fraction, measure the refractive index (converted to density) and DNA concentration (via fluorometry after 100x dilution in TE). d. Plot density vs. fraction number to visualize the gradient profile and DNA distribution. The 12C-DNA should peak near the density of the added GC standards, while 13C-DNA (if present) should appear in denser fractions.
Protocol 3.2: Calibrating Gradient Resolution with Internal Standards
Objective: To quantitatively assess gradient performance and resolution prior to analyzing experimental SIP samples.
Procedure:
- Prepare and run a gradient exactly as in Protocol 3.1, but substitute experimental DNA with a mock mixture of known 12C-DNA (e.g., from an unlabeled pure culture) and a 13C-labeled DNA control (if available).
- After fractionation, quantify DNA in each fraction. Also, perform qPCR targeting the 16S rRNA gene of the labeled control organism (if applicable) on each fraction.
- Calculate the buoyant density of the peak DNA fraction from the measured RI.
- Calculate resolution (R) between two peaks (e.g., two GC standards) using the formula: R = (ρ2 - ρ1) / (0.5 * (w1 + w2)), where ρ is peak density and w is the peak width at half-maximum height. A resolution >1.0 indicates baseline separation.
Visualizations
Title: DNA-SIP Density Gradient Workflow
Title: Parameter Impact on Gradient Resolution
The Scientist's Toolkit
Table 3: Key Research Reagent Solutions for DNA-SIP Density Gradients
| Item | Function & Importance in SIP | Example Product / Specification |
|---|---|---|
| UltraPure Cesium Chloride (CsCl) | Forms the density medium for isopycnic separation. Purity is critical to avoid nuclease contamination or fluorescence interference. | Invitrogen UltraPure CsCl, RNase/DNase free. |
| Cesium Trifluoroacetate (CsTFA) | Alternative to CsCl. More soluble, allows faster runs and is more denaturing, which can improve separation of RNA or DNA from contaminants. | Pharmacia Biotech, molecular biology grade. |
| GC-Standard DNA | Internal density markers for precise gradient calibration and peak identification during fractionation. | Defined GC% bacterial DNA (e.g., 50% and 72%). |
| TE Buffer (pH 8.0) | Standard elution/binding buffer. Provides a stable ionic environment for DNA in the gradient. | 10 mM Tris-HCl, 0.1 mM EDTA, pH 8.0, sterile filtered. |
| Gradient Mineral Oil | Used to top off ultracentrifuge tubes to prevent collapse under vacuum during sealing and centrifugation. | Beckman Coulter Gradient Oil. |
| Polyallomer Quick-Seal Tubes | Specific tubes for ultracentrifugation that can be heat-sealed. Essential for creating the vacuum necessary for long, high-speed spins. | Beckman Coulter, 5.1 mL capacity. |
| Refractometer | Essential instrument for precisely measuring the refractive index of gradient solutions to calculate and adjust density before centrifugation. | Digital refractometer with ±0.0001 RI precision. |
| Fraction Recovery System | Apparatus for precise, consistent collection of gradient fractions from the bottom of the tube after centrifugation. | Brandel BR-188 or manual syringe-pump system. |
| Fluorometric DNA Quantification Kit | Essential for quantifying the very low concentrations of DNA present in gradient fractions with high sensitivity and specificity. | Qubit dsDNA HS Assay or equivalent. |
1. Introduction and Thesis Context Within the broader thesis on optimizing DNA Stable Isotope Probing (DNA-SIP) for identifying active microorganisms utilizing 13C-labeled substrates, a critical methodological challenge is cross-feeding. Cross-feeding, or secondary labeling, occurs when labeled metabolic byproducts from primary utilizers are incorporated by non-target, secondary microorganisms. This dilutes the SIP signal, generates false positives, and confounds the identification of true substrate assimilators. This application note details experimental design mitigations to constrain and account for this phenomenon, ensuring robust, interpretable data for microbial ecology and drug development professionals seeking to elucidate functional microbial consortia.
2. Quantitative Data Summary: Key Studies on Cross-Feeding Dynamics
Table 1: Parameters Influencing Cross-Feeding in SIP Experiments
| Parameter | Typical Range/Value Observed to Accelerate Cross-Feeding | Recommended Mitigation Strategy | Key Reference (Concept) |
|---|---|---|---|
| Incubation Time | >72-96 hours for many substrates | Conduct a time-series experiment (e.g., 6, 24, 48, 72h). | (Pratscher et al., 2011) |
| Substrate Concentration | Very high (e.g., >5 mM for simple organics) | Use tracer-level concentrations (e.g., μM range). | (Neufeld et al., 2007) |
| Substrate Complexity | Low (e.g., acetate, glucose) | Use complex, structurally analogous substrates. | (DeRito et al., 2005) |
| Community Complexity | High (e.g., soil, sediment) | Increase density gradient resolution; use multiple controls. | (Youngblut & Buckley, 2014) |
| % 13C Label | 100% (Atom%) | Use lower label percentage (e.g., 20-50 atom% 13C). | (Cupples et al., 2007) |
Table 2: Diagnostic Nucleic Acid Density Shifts Indicative of Cross-Feeding
| Nucleic Acid Fraction | ΔBuoyant Density (g mL⁻¹) for Primary Utilizer | ΔBuoyant Density (g mL⁻¹) Suggestive of Cross-Feeding | Analytical Method |
|---|---|---|---|
| DNA (CsCl) | +0.016 to +0.030 (Fully labeled) | +0.001 to +0.010 (Partially labeled) | Ultracentrifugation, qSIP |
| RNA (CsTFA) | +0.015 to +0.025 | +0.003 to +0.012 | Ultracentrifugation |
| rRNA (Gradient Gel) | Clear band shift | Smear or multiple minor bands | DGGE/T-RFLP of gradient fractions |
3. Detailed Experimental Mitigation Protocols
Protocol 3.1: Time-Series DNA-SIP with Multiple Harvests Objective: To distinguish primary assimilators from secondary feeders by tracking the progression of label incorporation.
- Experimental Setup: Prepare replicate microcosms with environmental inoculum and 13C-substrate (e.g., 20 atom% 13C phenol).
- Harvest Schedule: Sacrifice triplicate microcosms at T0, T6, T12, T24, T48, T72, and T96 hours post-substrate addition.
- DNA Extraction & Density Separation: At each time point, extract total community DNA. Subject DNA to isopycnic ultracentrifugation in CsCl gradients (gradient prepared with an average density of 1.725 g mL⁻¹, centrifuged at 176,000 x g for 40h at 20°C).
- Fractionation & Analysis: Fractionate gradient (14 fractions) and measure density via refractometry. Quantify total DNA per fraction and perform 16S rRNA gene amplicon sequencing on selected "heavy" (>1.735 g mL⁻¹) and "light" (<1.715 g mL⁻¹) fractions.
- Data Interpretation: Organisms appearing in the "heavy" DNA fraction at early time points (T12-T24) are primary utilizers. Taxa appearing in the "heavy" fraction only at later time points (T72+) are putative cross-feeders.
Protocol 3.2: Concentration-Dependent Labeling with Tracer Substrate Objective: To limit cross-feeding by reducing the abundance of labeled metabolic byproducts.
- Substrate Calculation: Determine the natural abundance of the target compound in the environment (if possible). Use a concentration at or near tracer level (e.g., 10-100 μM, representing <1% of total bioavailable carbon).
- Labeling Strategy: Use a substrate with a lower atom% 13C (e.g., 20% 13C-glucose) instead of 99% enriched. This reduces the isotopic enrichment of released byproducts.
- Incubation & Processing: Incubate for a shorter duration (e.g., 24-48h). Process samples per standard DNA-SIP (Protocol 3.1, Step 3-4).
- qSIP Analysis: Apply quantitative SIP (qSIP) bioinformatics to calculate the atom% 13C incorporation of each taxon. Only taxa with statistically significant atom% enrichment above the background (unlabeled control) threshold are considered true assimilators, filtering out weakly labeled cross-feeders.
Protocol 3.3: Parallel Control with 13C-Labeled Metabolic Byproduct Objective: To directly identify microorganisms capable of utilizing the expected cross-fed compounds.
- Identify Likely Byproduct: Based on known degradation pathways of your primary substrate (e.g., phenol degradation may produce 13C-acetate or 13C-CO2).
- Setup Control Incubations: In parallel to the primary 13C-substrate experiment, set up separate microcosms amended with the suspected 13C-labeled byproduct (e.g., 13C-acetate) at a predicted concentration.
- Processing: Conduct DNA-SIP on these control microcosms identically to the main experiment.
- Subtractive Analysis: Compare the "heavy" DNA fractions from the primary substrate SIP with those from the byproduct SIP. Taxa found enriched in both SIP experiments are confirmed cross-feeders on that byproduct and should be interpreted cautiously in the primary experiment.
4. Visualization of Concepts and Workflows
Diagram 1: The Cross-Feeding Conundrum in DNA-SIP
Diagram 2: Three Key Mitigation Strategies
5. The Scientist's Toolkit: Key Research Reagent Solutions
Table 3: Essential Materials for Cross-Feeding Mitigation Experiments
| Item | Function & Rationale |
|---|---|
| Substrate with Controlled 13C Atom% | Enables use of lower enrichment (e.g., 20-50% 13C) to reduce label strength in metabolic byproducts, slowing cross-feeding. |
| Ultra-Pure CsCl or CsTFA | Essential for forming stable, reproducible density gradients during isopycnic ultracentrifugation for nucleic acid separation. |
| Optima-Grade Water and Buffers | Minimizes contamination with external carbon that could alter gradient density or support non-target microbial growth. |
| Density Refractometer | Critical for accurately measuring the buoyant density of each gradient fraction to precisely identify "light" and "heavy" nucleic acids. |
| Internal Density Standard (e.g., 13C-DNA) | A control DNA of known density added to gradients to calibrate fraction densities and monitor gradient performance across runs. |
| Phenol:Chloroform:IAA (25:24:1) | For high-purity, inhibitor-free nucleic acid extraction from complex environmental samples prior to ultracentrifugation. |
| Proof-reading Polymerase for PCR | Essential for generating amplicons from gradient fractions with minimal bias for downstream sequencing and community analysis. |
| qSIP Bioinformatics Pipeline (R packages) | Software tools (e.g., htsip) to quantitatively calculate atom% 13C incorporation per taxon, statistically identifying true assimilators. |
This application note details the optimization of critical parameters for DNA-based Stable Isotope Probing (DNA-SIP) with 13C-labeled substrates. The protocols are framed within a broader thesis investigating microbial function and identity in complex environmental or host-associated samples. Precise optimization of incubation time, substrate concentration, and the use of carrier DNA is paramount for achieving sufficient 13C-incorporation into microbial DNA, enabling effective separation via density gradient centrifugation and subsequent molecular analysis.
Table 1: Optimization Ranges for Key SIP Parameters
| Parameter | Typical Test Range | Recommended Optimal Starting Point | Key Consideration |
|---|---|---|---|
| Incubation Time | 24 hours - 14 days | 5-7 days for active communities | Must balance label incorporation against community shifts. Shorter for lab cultures, longer for environmental samples. |
| 13C-Substrate Concentration | 0.1 mM - 10 mM (or μg/g soil) | 1-2 mM (or manufacturer's Ks) | Should be non-inhibitory but saturating. Use tracer-level (≤ 0.5 mM) for toxic substrates. |
| Carrier DNA (Sheared) | 0 - 500 ng per gradient fraction | 100-200 ng per fraction | Required for efficient precipitation of low-biomass "heavy" DNA. Use DNA from a non-target organism. |
| Gradient Ultracentrifugation | 176,000 × g, 36-44 hours | 40 hours, 20°C | Time and speed critical for resolution of 13C-DNA ("heavy") from 12C-DNA ("light"). |
Table 2: Impact of Parameter Variation on SIP Outcomes
| Sub-Optimal Parameter | Effect on "Heavy" DNA Yield | Risk of Cross-Contamination | Potential for False Positives/Negatives |
|---|---|---|---|
| Insufficient Incubation Time | Very Low | Low | High false negatives (active assimilators missed). |
| Excessive Incubation Time | May be high, but diluted | High | High false positives (due to cross-feeding). |
| Low Substrate Concentration | Low | Low | High false negatives. |
| High Substrate Concentration | Potentially high | Moderate | Community inhibition; non-physiological responses. |
| No Carrier DNA | Very Low/None (loss) | N/A | Total loss of target DNA; false negatives. |
| Excessive Carrier DNA | High, but diluted | Very High | Co-precipitation of "light" DNA; false positives. |
Detailed Experimental Protocols
Protocol 3.1: Determining Optimal Incubation Time
Objective: To identify the time point yielding sufficient 13C-DNA incorporation without significant cross-feeding. Materials: Microcosms, 13C-substrate, DNA extraction kit. Procedure:
- Set up replicate microcosms with identical substrate concentration.
- Sacrifice replicates in triplicate at time points (e.g., 1, 3, 5, 7, 10, 14 days).
- Immediately extract total genomic DNA from each replicate using a standardized kit (e.g., DNeasy PowerSoil Pro).
- Quantify total DNA yield.
- Subject DNA to density gradient centrifugation (see Protocol 3.3).
- Quantify 13C-DNA ("heavy" fraction) yield via fluorescence (e.g., Qubit).
- Optimal time: The earliest point where 13C-DNA yield plateaus, prior to a significant increase in total community DNA (indicating cross-feeding).
Protocol 3.2: Titrating Substrate Concentration
Objective: To find the substrate level that maximizes 13C-incorporation without inhibiting the microbial community. Materials: Microcosms, range of 13C-substrate concentrations, ATP assay kit or respiration monitor. Procedure:
- Prepare microcosms amended with a logarithmic range of 13C-substrate concentrations (e.g., 0.01, 0.1, 0.5, 1, 5, 10 mM).
- Incubate for a fixed, relatively short time (e.g., 48-72 hours) to assess initial response.
- Measure microbial activity at each concentration (e.g., via CO2 evolution, ATP production, or substrate depletion).
- Extract DNA from all microcosms after a standard incubation period (from Protocol 3.1).
- Perform SIP and quantify 13C-DNA yield.
- Optimal concentration: The highest concentration that does not suppress overall microbial activity, resulting in peak 13C-DNA yield.
Protocol 3.3: Density Gradient Centrifugation with Carrier DNA
Objective: To effectively separate and recover 13C-labeled "heavy" DNA from total community DNA. Materials: CsCl stock solution, gradient buffer, SYBR Safe DNA stain, ultracentrifuge with vertical rotor (e.g., VT165.1), fractionation system, glycogen, isopropanol. Procedure:
- Gradient Setup: Mix 1-5 µg of total extracted DNA with gradient buffer and solid CsCl to a final buoyant density of ~1.725 g/mL and a final volume of 5.1 mL. Add SYBR Safe for visualization. Include a 13C-DNA control.
- Ultracentrifugation: Load heat-sealed tubes into a vertical rotor. Centrifuge at 176,000 × g (e.g., 45,000 rpm in VT165.1) at 20°C for 40 hours. Allow rotor to stop without brake.
- Fractionation: Puncture tube bottom and collect ~300 µL fractions (16-18 total) into a 96-well plate. Measure density of every 3rd fraction refractometrically.
- DNA Precipitation & Carrier Addition: To each fraction, add 2 volumes of molecular grade water, 1 µL of glycogen (20 mg/mL), and 200 ng of sheared, non-homologous carrier DNA (e.g., salmon sperm DNA). Mix.
- Add 0.6 volumes of room-temperature isopropanol, incubate at room temp for 1 hour, and centrifuge at 16,000 × g for 45 min at 4°C.
- Wash pellet with 500 µL ice-cold 70% ethanol, air-dry, and resuspend in 30 µL TE buffer.
- Analyze fractions via qPCR or 16S rRNA gene amplicon sequencing to identify "heavy" and "light" DNA distributions.
Visualizations
DNA-SIP Optimization Workflow
Parameter Impact on DNA Separation
The Scientist's Toolkit: Essential Research Reagent Solutions
| Item | Function & Rationale | Example/Notes |
|---|---|---|
| High-Purity 13C-Substrate | Provides the isotopically heavy label for tracing assimilation. Purity is critical to avoid unintended 12C carbon sources. | 99 atom% 13C-glucose, phenol, methane, etc. |
| CsCl, Ultracentrifuge Grade | Forms the density gradient for separating nucleic acids based on buoyant density (G+C content + 13C incorporation). | Requires high purity for consistent density and UV transparency. |
| Sheared Carrier DNA | Enhances precipitation and recovery of picogram quantities of target "heavy" DNA from gradient fractions. | Salmon sperm or herring sperm DNA, sheared to ~500 bp, non-homologous to sample. |
| DNA-Binding Fluorescent Stain | Allows visualization of DNA bands within the CsCl gradient under blue light to guide fractionation. | SYBR Safe, GelGreen; prefer safer alternatives to ethidium bromide. |
| Gradient Buffer | Maintains pH and ionic strength during ultracentrifugation, preventing DNA denaturation and ensuring accurate separation. | Typically Tris-EDTA (TE) buffer or phosphate buffer with EDTA. |
| Glycogen (Molecular Grade) | Acts as an inert coprecipitant, further improving the recovery of minute amounts of DNA during the fraction precipitation step. | Added prior to the isopropanol precipitation step. |
| Non-13C Labeled Control DNA | Provides a reference "light" DNA peak (density ~1.715 g/mL) to confirm proper gradient formation and fractionation. | DNA extracted from a pure culture grown on 12C substrate. |
Within the broader thesis on refining DNA-Stable Isotope Probing (DNA-SIP) protocols for 13C research, a critical challenge is the reliable detection of microbial utilizers that are either low in abundance or exhibit extremely slow growth rates. These populations are often key drivers in rate-limiting processes but are routinely overshadowed by dominant, fast-growing taxa. This application note details advanced, integrated methodologies to push the detection limits of DNA-SIP, enabling the identification and characterization of these elusive functional guilds.
Key Strategies for Enhanced Detection
The core approach involves amplifying the isotopic signal while minimizing background noise through a combination of extended incubation, sophisticated fractionation, targeted molecular analysis, and computational refinement.
Table 1: Quantitative Framework for Pushing SIP Detection Limits
| Strategy | Key Parameter | Typical Range / Target | Impact on Detection |
|---|---|---|---|
| Incubation & Labeling | 13C-Substrate Concentration | 0.1 - 1 mM (Ultra-low) | Reduces cross-feeding & favors specialists. |
| Incubation Duration | Weeks to Months | Allows for generational turnover of slow growers. | |
| Atom % Excess 13C | >30% (Preferably >60%) | Amplifies isotopic enrichment signal. | |
| Gradient Fractionation | Fraction Collection Density | Ultra-high resolution (≥18 fractions) | Increases separation fidelity of 'heavy' DNA. |
| Target Buoyant Density Shift | ≥0.016 g/mL over control | Clear indicator of assimilation. | |
| Nucleic Acid Analysis | DNA Required for Sequencing | ≥1 ng per fraction | Enables deep metagenomic coverage. |
| Sequencing Depth | ≥50,000 reads per fraction | Captures rare genomic sequences. | |
| Bioinformatic Filtering | Minimum Z-score (ρ) | ≥2.0 | Statistically robust identification of enriched taxa. |
| Relative Abundance in Heavy | >5x increase vs. Light/Control | Confirms biological relevance. |
Detailed Experimental Protocols
Protocol 1: Ultra-Long Incubation with Pulse-Low Dose Substrate
- Objective: To label slow-growing microorganisms while minimizing isotopic dilution and cross-feeding.
- Materials: Microcosms, 13C-substrate (e.g., 13C-phenol, 13C-cellulose), sterile background nutrients.
- Procedure:
- Prepare environmental microcosms in triplicate. Include 12C-control and unamended control.
- Add 13C-substrate at a concentration 1-2 orders of magnitude lower than typical labile carbon doses (e.g., 0.05-0.2 mM). This is the "low dose."
- Incubate under in situ conditions (temperature, pH) for an extended period (e.g., 4-12 weeks).
- Every 14 days, "pulse" an additional, identical low dose of 13C-substrate to maintain bioavailable label without promoting excessive growth of generalists.
- Sacrifice replicates at defined time points for nucleic acid extraction.
Protocol 2: Ultra-High-Resolution Isopycnic Centrifugation
- Objective: To achieve maximal separation of lightly labeled 'heavy' DNA from unlabeled 'light' DNA.
- Materials: CsCl gradient medium, ultracentrifuge, density gradient fractionator, refractometer.
- Procedure:
- Mix extracted DNA (≥500 ng) with CsCl solution to a final volume of 5.0 mL and a target initial buoyant density of ~1.725 g/mL.
- Centrifuge in a ultracentrifuge (e.g., Beckman Coulter Optima XE) with a vertical rotor (e.g., VTi 65.2) at 177,000 × g for 40-44 hours at 20°C.
- Fractionate the gradient from the bottom into at least 18 equal fractions (≈275 µL each) using a precision pump system.
- Measure the buoyant density of every fraction using a digital refractometer.
- Precipitate DNA from each fraction and quantify via fluorometry.
Protocol 3: Targeted Enrichment & Hybridization Capture Pre-Sequencing
- Objective: To selectively sequence the genomes of putative utilizers from heavy fractions before metagenomic analysis.
- Materials: Biotin-labeled oligonucleotide probes (e.g., genus-specific), magnetic streptavidin beads.
- Procedure:
- Pool DNA from the 3-5 'heaviest' fractions.
- Fragment DNA and add universal linkers via ligation.
- Hybridize the DNA library with a panel of biotinylated 16S rRNA or functional gene (e.g., amoA, mcrA) probes targeting suspected slow-growing clades.
- Capture probe-bound DNA fragments using streptavidin-coated magnetic beads.
- Wash stringently, elute the captured DNA, and amplify with linker-specific primers.
- Proceed to high-throughput sequencing. This enriches the relevant sequences, improving coverage for downstream assembly and analysis.
Visualizations
Diagram Title: Advanced DNA-SIP Workflow for Detecting Slow-Growing Utilizers
Diagram Title: Statistical Filtering to Identify Low-Abundance Utilizers
The Scientist's Toolkit: Research Reagent Solutions
Table 2: Essential Materials for Advanced DNA-SIP
| Item | Function & Rationale |
|---|---|
| High-Purity 13C-Substrates (≥99 atom% 13C) | Maximizes the isotopic label signal-to-noise ratio, crucial for detecting low levels of assimilation. |
| Ultra-Pure Caesium Chloride (CsCl) | Forms the precise density gradient for centrifugation; purity is essential for consistent buoyant densities and DNA integrity. |
| Gradient Fractionation System | A precision peristaltic pump or displacement system that allows consistent collection of ultra-small (≤300 µL) gradient fractions. |
| Digital Refractometer | Accurately measures the buoyant density of every fraction to correlate density shifts with taxonomic data. |
| High-Sensitivity DNA Fluorometric Assay (e.g., Qubit) | Quantifies minute amounts of DNA recovered from high-resolution gradient fractions. |
| Biotinylated Oligonucleotide Probes | For targeted capture of phylogenetic or functional gene markers from complex heavy-fraction metagenomes. |
| Streptavidin Magnetic Beads | Enables physical separation and purification of probe-hybridized DNA fragments during capture protocols. |
| Phusion or other High-Fidelity PCR Polymerase | Used for minimal-cycle amplification of captured or fraction DNA, reducing chimera formation and bias. |
Validating Your DNA-SIP Results: Techniques and Comparison to RNA-SIP & Other Methods
Application Notes: Validating DNA-SIP Experiments in 13C Research
The accurate interpretation of DNA-Stable Isotope Probing (SIP) experiments in microbial ecology and drug development research hinges on two essential validation steps: qPCR gradient profile analysis and IRMS verification. Within the broader thesis on DNA-SIP protocol optimization for tracing 13C-labeled substrates into microbial nucleic acids, these techniques confirm successful label incorporation and fraction separation, preventing false-positive identifications of active taxa.
Key Quantitative Data Summary:
Table 1: Typical qPCR Cycle Threshold (Ct) Profile Across a CsCl Gradient from a Successful 13C-DNA-SIP Experiment
| Fraction Number (Buoyant Density, g/mL) | "Heavy" 13C-DNA Ct Value | "Light" 12C-Control DNA Ct Value | ΔCt (Light - Heavy) |
|---|---|---|---|
| 1 (~1.66) | 32.5 ± 0.4 | 28.1 ± 0.3 | -4.4 |
| 5 (~1.72) | 30.2 ± 0.3 | 30.5 ± 0.2 | 0.3 |
| 10 (~1.725) - "Light Peak" | 25.8 ± 0.2 | 24.9 ± 0.2 | -0.9 |
| 15 (~1.735) | 28.4 ± 0.3 | 30.8 ± 0.4 | 2.4 |
| 20 (~1.745) - "Heavy Peak" | 24.1 ± 0.1 | 32.7 ± 0.5 | 8.6 |
| 25 (~1.76) | 31.9 ± 0.5 | 33.0 ± 0.6 | 1.1 |
Table 2: IRMS Data for Corresponding 13C-Labeled Substrate and DNA Fractions
| Sample | δ13C (‰ vs. V-PDB) | Atom % 13C |
|---|---|---|
| Natural Abundance DNA | -21.5 ± 0.3 | 1.090 ± 0.001 |
| 13C-Labeled Substrate (e.g., Phenol) | +987.6 ± 12.5 | >99.0 |
| SIP "Light" DNA Fraction (1.725 g/mL) | -20.8 ± 0.4 | 1.091 ± 0.001 |
| SIP "Heavy" DNA Fraction (1.745 g/mL) | +152.3 ± 8.7 | 1.210 ± 0.015 |
Detailed Protocols
Protocol 1: Generating and Analyzing qPCR Gradient Profiles
Objective: To validate the separation of 13C-labeled ("heavy") from 12C ("light") DNA via quantitative PCR across density gradient fractions.
Materials: See "The Scientist's Toolkit" below.
Methodology:
- Gradient Fractionation: After ultracentrifugation, fractionate the CsCl density gradient (e.g., into 30 fractions of 150 µL each) using a fractionation system or careful manual pipetting.
- DNA Purification: Desalt and purify DNA from each fraction using a dedicated kit for high-salt solutions. Elute in 30-50 µL of nuclease-free water or TE buffer.
- qPCR Setup:
- Target a taxon-general gene (e.g., 16S rRNA bacterial gene) or a specific functional gene.
- Prepare a master mix containing SYBR Green or TaqMan chemistry, primers, and nuclease-free water.
- Aliquot 2 µL of each purified fraction DNA as template in triplicate.
- Include a standard curve (e.g., 10-fold serial dilutions of a known DNA copy number) and no-template controls.
- Run qPCR: Use a standard thermal cycling program (e.g., 95°C for 3 min, followed by 40 cycles of 95°C for 30s, 55-60°C for 30s, 72°C for 45s).
- Data Analysis:
- Determine the Cycle Threshold (Ct) for each replicate.
- Plot the mean Ct value (or gene copy number calculated from the standard curve) against the fraction number/buoyant density.
- A successful SIP experiment shows a distinct bimodal distribution: "light" DNA peaks at its natural buoyant density (~1.715-1.725 g/mL), and "heavy" DNA is shifted to a higher density (~1.735-1.745 g/mL). The ΔCt between heavy and light peaks should be significant (often >5 cycles).
Protocol 2: IRMS Analysis of SIP DNA Fractions
Objective: To directly measure the 13C isotopic enrichment of DNA recovered from "heavy" and "light" gradient fractions.
Materials: See "The Scientist's Toolkit" below.
Methodology:
- Sample Preparation for IRMS:
- Pool the 3-5 fractions constituting the "heavy" peak and the "light" peak from Protocol 1.
- Precipitate the pooled DNA using glycogen and ethanol. Wash with 70% ethanol.
- Re-suspend the dried DNA pellet in ultrapure water.
- Quantification and Packaging:
- Precisely quantify the DNA using a fluorometric assay (e.g., Qubit).
- A minimum of 1-5 µg of carbon (requiring ~10-50 µg of DNA) is typically needed for reliable EA-IRMS analysis.
- Accurately weigh the required amount of DNA into a clean, pre-weighed tin or silver capsule for combustion.
- EA-IRMS Analysis:
- Load samples into the Elemental Analyzer (EA) autosampler.
- The EA combusts the sample at high temperature (≥1000°C) in an oxygen-rich environment, converting carbon to CO2.
- The resulting gases are carried by a helium stream, purified, and introduced into the IRMS.
- The IRMS measures the ratio of 13CO2 to 12CO2.
- Data Interpretation:
- Results are reported as δ13C (‰) relative to an international standard (Vienna Pee Dee Belemnite, V-PDB).
- "Light" control DNA should have a δ13C value typical of natural abundance (~ -20 to -30‰).
- DNA from the "heavy" fraction in a successful SIP experiment will show a significantly elevated (enriched) δ13C value, often by hundreds of per mil, confirming incorporation of the labeled substrate.
Diagrams
Title: SIP Validation Workflow Logic
Title: qPCR Profile Generation Process
The Scientist's Toolkit
Table 3: Essential Research Reagent Solutions for SIP Validation
| Item | Function & Explanation |
|---|---|
| CsCl (Ultra Pure Grade) | Forms the density gradient for separating nucleic acids based on GC-content and 13C incorporation during ultracentrifugation. |
| Gradient Fractionation System | Automated or manual system to precisely collect sequential fractions from the centrifuged CsCl gradient for downstream analysis. |
| DNA Clean-up Kit (High Salt) | Specialized spin-column kit to desalt and purify DNA from high-concentration CsCl solutions prior to qPCR or IRMS. |
| SYBR Green or TaqMan qPCR Mix | Fluorescent chemistry for quantitative PCR. Allows measurement of target gene abundance in each density gradient fraction. |
| Taxon-General 16S rRNA Primers | Primer pair (e.g., 515F/806R) targeting a conserved region to quantify total bacterial DNA across gradient fractions. |
| Glycogen (Molecular Biology Grade) | Carrier molecule to improve recovery and visibility of DNA during ethanol precipitation for IRMS sample preparation. |
| Tin/Silver Capsules (for EA) | Small, clean containers for holding and combusting dried, weighed DNA samples in the Elemental Analyzer. |
| Laboratory CO2 Standard Gas | Calibration gas with known isotopic composition (δ13C) for calibrating the IRMS instrument before sample analysis. |
| Certified Reference Materials (e.g., USGS40) | Solid organic standards with known δ13C values, analyzed alongside samples to ensure accuracy and precision of IRMS data. |
Within the broader framework of DNA-Stable Isotope Probing (DNA-SIP) protocols for 13C-based microbial ecology research, Quantitative SIP (qSIP) represents a critical methodological advancement. It transcends the qualitative identification of isotopically enriched taxa by introducing statistical rigor and quantitative metrics, primarily Atom Percent Excess (APE), to estimate the degree of isotopic incorporation and microbial growth rates. This allows researchers and drug development professionals to move from asking "who is active?" to "how active are they, and at what rate do they grow?".
Core Quantitative Concepts and Data
Calculating Atom Percent Excess (APE)
APE is the fundamental quantitative measure in qSIP. It represents the proportional increase in the heavy isotope (e.g., 13C) in a nucleic acid sample above its natural abundance background. It is calculated using quantitative PCR (qPCR) data from density gradient fractions.
Formula:
APE = Σ (buoyant density_i * proportion of total DNA_i) - mean buoyant density of control
Where i represents each gradient fraction.
Key Quantitative Outputs
The APE calculation enables the derivation of several key metrics:
| Metric | Formula/Description | Research Application |
|---|---|---|
| Atom Percent Excess (APE) | APE = BD_sample - BD_control |
Measures the degree of 13C incorporation into a specific taxon's DNA. |
| Biomass-Weighted Mean BD | Σ(BD_i * DNA_conc_i) / Σ(DNA_conc_i) per taxon. |
The central buoyant density value used for APE calculation. |
| Isotopic Incorporation (I) | Can be derived from APE and precursor pool APE. | Estimates the fraction of new, labeled biomass. |
| Growth Rate (μ) | μ = ln(1 + I) / t (where t=incubation time). |
Calculates the exponential growth rate of the active population. |
Detailed Experimental Protocol for qSIP
Protocol: qSIP Workflow for Calculating APE
This protocol follows DNA-SIP ultracentrifugation.
Step 1: Fractionation & Quantification
- Collect density gradient fractions (e.g., 32 fractions of ~100 µL each) using a fractionation system.
- Purify DNA from each fraction using a high-throughput, low-elution-volume cleanup kit.
- Quantify total bacterial/archaeal 16S rRNA gene abundance in every fraction via quantitative PCR (qPCR) using a universal primer set. Include a standard curve of known copy number.
- Quantify taxon-specific 16S rRNA gene (or functional gene) abundance in every fraction via qPCR with group-specific primers.
Step 2: Buoyant Density Determination
- Measure the density of every fraction using a digital refractometer. Convert refractive index to buoyant density (g mL⁻¹) using a CsCl standard curve.
- Align density measurements with corresponding qPCR data for each fraction.
Step 3: Data Analysis & APE Calculation
- For each taxon (and total community), plot gene copy number (from qPCR) against buoyant density for both 13C-treatment and 12C-control gradients.
- Fit a Gaussian distribution curve to the density distribution data for each taxon in each treatment.
- Calculate the biomass-weighted mean buoyant density (BD):
BD_mean = Σ (density_i * copy_number_i) / Σ (copy_number_i)for all fractions i. - Calculate Atom Percent Excess (APE) for each taxon:
APE_taxon = BD_mean (13C-treatment) - BD_mean (12C-control). - Perform statistical testing (e.g., bootstrapping or t-tests on replicate gradients) to assess if the APE for a taxon is significantly greater than zero.
Visualizing the qSIP Workflow and Concepts
qSIP Experimental Workflow for APE Calculation
Core Conceptual Framework of qSIP Analysis
The Scientist's Toolkit: Essential Research Reagents & Materials
| Item | Function in qSIP | Critical Notes |
|---|---|---|
| Cesium Chloride (CsCl), Molecular Biology Grade | Forms the density gradient for isopycnic separation of nucleic acids based on 13C incorporation. | Must be highly pure; density typically adjusted to ~1.725 g mL⁻¹. |
| Gradient Buffer (e.g., Tris-EDTA, pH 8.0) | Provides a stable chemical environment during ultracentrifugation to maintain DNA integrity. | Often includes a chelating agent and is nuclease-free. |
| SYBR Green or TaqMan qPCR Master Mix | For absolute quantification of target genes (total and taxon-specific) in each gradient fraction. | Requires high sensitivity and a validated standard curve. |
| Digital Refractometer | Precisely measures the refractive index of each gradient fraction to determine buoyant density (g mL⁻¹). | Must be calibrated with CsCl standards; critical for accuracy. |
| Ultracentrifuge & Vertical Rotor | Achieves the high centrifugal force required for isopycnic separation over a typical 36-48 hour run. | Rotor must be compatible with thin-walled, sealable tubes. |
| Fractionation System | Collects consistent, small-volume (∼100 µL) fractions from the centrifuged density gradient. | Can be manual (syringe pump) or automated; precision is key. |
| High-Recovery DNA Cleanup Kit | Purifies DNA from high-salt CsCl fractions prior to qPCR. Elution in small volume (e.g., 20 µL) is essential. | Must efficiently remove CsCl, which inhibits PCR. |
| Taxon-Specific qPCR Primers & Probes | Targets specific microbial groups for quantification across the gradient to calculate their individual APE. | Specificity and efficiency must be rigorously validated. |
| Statistical Software (R, Python) | For performing bootstrapping analyses, t-tests, and modeling density distributions to assess APE significance. | ht-qSIP (R package) is a specialized, open-source tool. |
Within the context of developing a robust DNA-SIP protocol for microbial ecology research using 13C-labeled substrates, understanding the fundamental distinctions between DNA-SIP and RNA-SIP is crucial. These techniques leverage stable isotope probing to link microbial identity with function by tracking the incorporation of 13C into nucleic acids. This application note provides a detailed comparison to guide researchers in selecting the appropriate method based on experimental objectives, focusing on turnover rates, sensitivity, and technical demands.
Table 1: Core Comparison of DNA-SIP and RNA-SIP
| Parameter | DNA-SIP | RNA-SIP |
|---|---|---|
| Target Biomolecule | Genomic DNA | Ribosomal RNA (typically 16S rRNA) |
| Turnover Rate | Slow (requires cell division/replication) | Very Fast (reflects active metabolic activity) |
| Temporal Sensitivity | Lower (integrates over longer periods) | Higher (snapshot of active populations) |
| Isotope Incubation Time | Days to weeks | Hours to days |
| Required 13C Incorporation | High (~20-50% atom enrichment for CsCl-TTFA) | Lower (~5-20% atom enrichment) |
| Detection Sensitivity | Lower (requires sufficient DNA for density shift) | Higher (multiple rRNA copies per cell amplify signal) |
| Community Representation | All genomes (active & dormant) | Primarily actively transcribing populations |
| Technical Difficulty | High (ultracentrifugation, careful handling) | Very High (RNA fragility, rapid processing) |
| Downstream Analysis | Metagenomics, 16S rRNA gene amplicon sequencing | RT-qPCR, 16S rRNA amplicon sequencing (via cDNA), metatranscriptomics |
Table 2: Typical Experimental Parameters
| Protocol Step | DNA-SIP | RNA-SIP |
|---|---|---|
| Incubation | Microcosm with 13C substrate; duration optimized for replication. | Microcosm with 13C substrate; short-term to prevent cross-feeding. |
| Nucleic Acid Extraction | Standard genomic DNA kits (e.g., PowerSoil). | RNA-specific kits with immediate RNase inhibition; rapid processing. |
| Density Gradient | CsCl + gradient buffer (e.g., Gradient Buffer, Tris-EDTA). Bis-benzimide/Hoechst for optical detection. | CsTFA + gradient buffer. No fluorescent stain typically used. |
| Ultracentrifugation | ~36-44 hrs, 20°C, ~177,000 g (e.g., in a VT-65.2 rotor). | ~48-72 hrs, 20°C, ~177,000 g. |
| Fractionation | Density-controlled fractionation system collecting ~30 fractions. | Manual or controlled collection of ~15-20 fractions. |
| Detection & Analysis | Measure density (refractometer), quantify DNA, PCR-amplify 16S genes from heavy/light fractions. | Measure density, quantify RNA, convert to cDNA for PCR/RT-qPCR. |
Detailed Experimental Protocols
Protocol 1: DNA-SIP for 13C-Labeled Microbial Communities
Objective: To isolate and identify microorganisms that have incorporated 13C from a labeled substrate into their genomic DNA.
Materials:
- 13C-labeled substrate (e.g., 13C-acetate, 13C-glucose)
- Environmental sample (soil, sediment, water)
- DNA extraction kit (e.g., DNeasy PowerSoil Pro Kit, QIAGEN)
- Gradient Buffer (0.1 M Tris-HCl, 0.1 M KCl, 1 mM EDTA, pH 7.4)
- Caesium Chloride (CsCl), optical grade
- Bis-benzimide (Hoechst 33258) dye
- Ultracentrifuge and vertical rotor (e.g., Beckman Coulter Optima XE with VT-65.2 rotor)
- Ultracentrifuge tubes (e.g., Quick-Seal, 5.1 mL)
- Refractometer
- Fractionation system (e.g., syringe pump, needle, density fractionator)
Procedure:
- Incubation: Establish microcosms with sample and 13C-substrate. Include a 12C-control. Incubate for a period sufficient for microbial growth (e.g., 7-28 days).
- DNA Extraction: Terminate incubation, extract total community DNA using the kit. Assess quality/quantity via spectrophotometry.
- Gradient Preparation: For ~4.7 mL final volume in a 5.1 mL tube, mix ~2 µg DNA with 3.95 mL of 1.68 g mL⁻¹ CsCl solution (in Gradient Buffer). Add 7.5 µL of bis-benzimide (10 mg mL⁻¹). Adjust to final density of ~1.68-1.69 g mL⁻¹. Seal tube.
- Ultracentrifugation: Centrifuge at 177,000 g (e.g., 45,000 rpm in VT-65.2) for 36-44 hours at 20°C.
- Fractionation: Puncture tube bottom. Collect ~150 µL fractions (~30 fractions total) using a fractionation system. Measure density of every 5th fraction with a refractometer.
- DNA Recovery & Analysis: Purify DNA from each fraction (via PEG precipitation or kit). Quantify fluorescence (for dye) or DNA amount. Perform 16S rRNA gene PCR on selected heavy (density > control peak) and light fractions. Analyze via sequencing.
Protocol 2: RNA-SIP for Active 13C-Assimilating Microbes
Objective: To identify microorganisms actively transcribing ribosomes while assimilating a 13C-labeled substrate.
Materials:
- 13C-labeled substrate
- Environmental sample
- RNA extraction kit with bead-beating and RNase inhibitors (e.g., RNeasy PowerSoil Total RNA Kit, QIAGEN)
- Caesium Trifluoroacetate (CsTFA), solution density 2.0 g mL⁻¹
- RNase-free water and consumables
- Ultracentrifuge and vertical rotor
- Refractometer
Procedure:
- Incubation: Establish microcosms with sample and 13C-substrate. Incubate for a short period (e.g., 6-48 hours) to capture active assimilation.
- RNA Extraction: Rapidly process samples. Add RNase inhibitor immediately. Extract total RNA using the kit. Include an on-column DNase digestion step. Assess RNA integrity (RIN > 6).
- Gradient Preparation: For ~4 mL final volume, mix up to 1 µg RNA with CsTFA solution and Gradient Buffer to a final density of ~1.78-1.82 g mL⁻¹. Do not add fluorescent dye. Seal RNase-free ultracentrifuge tubes.
- Ultracentrifugation: Centrifuge at 177,000 g for 48-72 hours at 20°C.
- Fractionation: Collect ~12-20 fractions (~200 µL each) manually from the top or using a gentle pump system. Measure density with a refractometer.
- RNA Recovery & Analysis: Purify RNA from fractions (by ethanol precipitation). Treat with DNase. Convert RNA to cDNA using reverse transcriptase. Perform 16S rRNA gene-targeted PCR (from cDNA) or RT-qPCR on heavy and light fractions for analysis.
Signaling & Workflow Diagrams
Decision Workflow: DNA-SIP vs RNA-SIP
Logic for Choosing SIP Method
The Scientist's Toolkit: Essential Reagent Solutions
Table 3: Key Research Reagents and Materials
| Item | Function in SIP | Critical Note |
|---|---|---|
| 13C-labeled Substrates (e.g., acetate, glucose, phenol) | The isotopic tracer that is assimilated by metabolically active microbes. | Purity (>99% 13C) is essential to avoid dilution. Choice defines the metabolisms targeted. |
| Optical Grade CsCl / Molecular Biology Grade CsTFA | Forms the density gradient for separating nucleic acids by buoyant density. | CsCl for DNA-SIP. CsTFA is required for RNA-SIP as it is RNase inhibitory and maintains RNA integrity. |
| Bis-benzimide (Hoechst 33258) Dye | Binds specifically to DNA in gradients, allowing UV visualization and fraction定位. | Used only in DNA-SIP. Intercalates into AT-rich regions, influencing buoyant density; use consistently. |
| Gradient Buffer (Tris-EDTA-KCl) | Provides a stable pH and ionic environment for the ultracentrifugation gradient. | Prevents nucleic acid degradation and aggregation during the long centrifugation run. |
| RNase Inhibitors & DNase | Preserve RNA integrity during RNA-SIP extraction and remove genomic DNA contamination. | Critical for RNA-SIP. Failure leads to rapid RNA degradation and false signals. |
| Vertical Rotor & Sealed Tubes (e.g., VT-65.2, Quick-Seal) | Enables the formation of a static, density-resolved gradient during ultracentrifugation. | Must be compatible with ultracentrifuge and rated for the high speeds (~45,000 rpm) used. |
| Refractometer | Precisely measures the density of each collected gradient fraction. | Essential for correlating nucleic acid abundance with buoyant density to identify "heavy" fractions. |
Within the broader thesis investigating the optimization and application of DNA-based Stable Isotope Probing (DNA-SIP) with ¹³C-labeled substrates, this document positions DNA-SIP alongside Protein-SIP and Phospholipid-Derived Fatty Acid (PLFA)-SIP. Each technique targets a distinct biomolecule pool, offering complementary insights into microbial identity (DNA-SIP), functional activity (Protein-SIP), and community membrane composition/viability (PLFA-SIP). The integrated use of these methods provides a multi-omic perspective on active microbial populations in complex environments, which is critical for researchers and drug development professionals studying microbiomes, biodegradation, and microbial ecology.
Table 1: Core Comparison of SIP Techniques Targeting Different Biomolecules
| Feature | DNA-SIP | Protein-SIP (Protein-SIP) | PLFA-SIP |
|---|---|---|---|
| Target Biomolecule | Genomic DNA (typically 16S rRNA genes) | Proteins (often enzymes) | Phospholipid-derived fatty acids from cell membranes |
| Primary Insight | Taxonomic identity of active microorganisms | Functional metabolic activity & expression | Broad community structure & physiological status (viability) |
| Temporal Resolution | Moderate (days-weeks) | High (hours-days) | Moderate (days) |
| Sensitivity | High (can detect <1% of community) | Moderate | Lower (requires ~10⁵ cells per sample) |
| Throughput | High (post-extraction) | Lower (labor-intensive) | Moderate |
| Key Quantitative Metric | % ¹³C-enrichment in gradient fractions; qPCR of target genes | Atom % ¹³C excess in peptides; peptide abundance shifts | ¹³C incorporation into specific PLFA profiles; labeling percentage |
| Main Application | Linking phylogeny to substrate utilization | Elucidating in situ metabolic pathways & regulation | Assessing community-wide response & active biomass |
Detailed Application Notes
DNA-SIP
- Application: Identifies microorganisms assimilating a specific ¹³C-substrate (e.g., phenol, methane) by analyzing the "heavy" DNA (¹³C-DNA) separated via density gradient centrifugation. Central to the thesis work on protocol refinement.
- Advantage: Provides direct phylogenetic identification via sequencing of 16S rRNA genes or metagenomes from heavy fractions.
- Limitation: Does not directly confirm protein-level expression of catabolic pathways.
Protein-SIP
- Application: Detects ¹³C incorporation into proteins, confirming active synthesis of specific enzymes. Used to study pathway regulation and measure growth rates via LC-MS/MS of labeled peptides.
- Advantage: Offers direct evidence of functional metabolic activity and can resolve contributions of closely related species via unique peptide markers.
- Limitation: Requires extensive protein extraction, digestion, and complex MS data analysis; relies on database matches.
PLFA-SIP
- Application: Measures ¹³C incorporation into membrane lipids, indicating a metabolically active (and thus living) microbial biomass. PLFA profiles can indicate broad physiological shifts (e.g., stress).
- Advantage: Provides a community-wide activity snapshot without cultivation; different PLFAs can indicate broad taxonomic groups (e.g., bacteria vs. fungi).
- Limitation: Offers lower taxonomic resolution than nucleic acid-based methods.
Experimental Protocols
Core DNA-SIP Protocol (CsCl Density Gradient Centrifugation)
A. Sample Incubation & Nucleic Acid Extraction
- Incubate environmental sample (soil, sediment, water) with ¹³C-labeled substrate (e.g., 99 atom% ¹³C) and parallel ¹²C-control. Optimize concentration and incubation time (from thesis work).
- Terminate incubation, extract total community DNA using a bead-beating/phenol-chloroform method (e.g., with CTAB buffer). Purify DNA.
B. Density Gradient Centrifugation & Fractionation
- Mix ~1-5 µg DNA with gradient buffer (e.g., TE pH 8.0) and CsCl to a final density of ~1.725 g/mL in an ultracentrifuge tube (e.g., 5.1 mL OptiSeal).
- Centrifuge in a ultracentrifuge (e.g., Beckman Coulter Optima XE) with a vertical rotor (e.g., VTi 65.2) at 177,000 x g, 20°C, for 36-48 hours.
- Fractionate gradient (~14 fractions) by displacing with water using a fractionation system. Measure density of every fraction refractometrically.
C. Analysis of Fractions
- Precipitate DNA from each fraction with PEG solution and glycogen.
- Perform quantitative PCR (qPCR) of target genes (e.g., 16S rRNA genes) across all fractions to identify "heavy" (¹³C-DNA) and "light" (¹²C-DNA) peaks.
- Pool fractions constituting heavy and light DNA for downstream sequencing (16S rRNA amplicon or shotgun metagenomics).
Protein-SIP Protocol (Key Steps)
A. Protein Extraction & Digestion
- Extract proteins from ¹³C/¹²C-incubated samples using a lysis buffer (e.g., with SDS) and bead-beating. Precipitate proteins with acetone/TCA.
- Redissolve, quantify, and reduce/alkylate proteins (DTT/IAA). Digest with trypsin overnight.
B. LC-MS/MS Analysis & Data Processing
- Analyze peptides via high-resolution LC-MS/MS (e.g., Orbitrap).
- Process raw data using software (e.g., MaxQuant, Proteome Discoverer) against a protein database.
- Calculate ¹³C incorporation per peptide by analyzing isotopic distribution shifts. Identify peptides/proteins with significant ¹³C-enrichment.
PLFA-SIP Protocol (Key Steps)
A. Lipid Extraction & Derivatization
- Extract lipids from freeze-dried samples using a single-phase chloroform-methanol-citrate buffer (1:2:0.8) via sonication.
- Separate into neutral/polar lipids via silicic acid column chromatography. Elute polar lipids (containing phospholipids) with methanol.
- Subject to mild alkaline methanolysis to release fatty acid methyl esters (FAMEs) from phospholipids.
B. GC-MS/IRMS Analysis
- Analyze ¹³C-FAMEs via Gas Chromatography-Isotope Ratio Mass Spectrometry (GC-IRMS) or GC-MS.
- Identify PLFAs by retention time and mass spectra. Quantify ¹³C-atom% enrichment for each diagnostic PLFA (e.g., 16:0, 18:1ω7c).
Visualizations
Title: Complementary Multi-Omic SIP Workflow
Title: SIP Technique Temporal Resolution
The Scientist's Toolkit
Table 2: Essential Research Reagent Solutions for SIP Experiments
| Item | Function in SIP | Example/Note |
|---|---|---|
| ¹³C-Labeled Substrate | Provides the isotopic tracer for active assimilating microorganisms. | 99 atom% ¹³C-Methane, ¹³C-Glucose, ¹³C-Phenol. Purity is critical. |
| CsCl (Ultra Pure) | Forms the density gradient for separation of ¹³C-DNA from ¹²C-DNA. | Molecular biology grade, prepared in appropriate buffer (e.g., TE, Gradient Buffer). |
| Gradient Buffer (TE, pH 8.0) | Maintains DNA stability and consistent pH during ultracentrifugation. | 10 mM Tris-HCl, 1 mM EDTA. Filter sterilized. |
| PEG 6000/Glycogen Mix | Co-precipitates DNA from high-salt CsCl gradient fractions. | Improves recovery of low-concentration DNA. |
| Protein Lysis Buffer (SDS-based) | Effectively disrupts cells and solubilizes proteins for Protein-SIP. | Contains protease inhibitors to prevent degradation. |
| Trypsin (Sequencing Grade) | Digests proteins into peptides for LC-MS/MS analysis in Protein-SIP. | Ensures specific cleavage, reducing missed cleavages. |
| Bligh & Dyer Extraction Solvents | Chloroform:MeOH:Buffer mixture for total lipid extraction in PLFA-SIP. | Single-phase extraction maximizes PLFA recovery. |
| FAME Standards | For identification and quantification of PLFAs via GC retention time. | Bacterial Acid Methyl Ester (BAME) Mix, MIDI standards. |
| GC-IRMS Reference Gas | High-purity CO₂ of known isotopic composition for calibrating IRMS. | Essential for accurate δ¹³C measurement of individual PLFAs. |
Within the broader thesis on optimizing DNA-SIP protocols with ¹³C-labeled substrates, it is critical to contextualize SIP's capabilities and limitations against other advanced functional microbiome tools. While DNA-SIP identifies metabolically active taxa by tracking ¹³C into genomic DNA, it does not directly capture dynamic gene expression or provide phylogenetic resolution at the single-cell level. This application note compares DNA-SIP to two powerful alternatives: metatranscriptomics, which profiles community-wide gene expression, and single-cell Stable Isotope Probing (sc-SIP), which links isotopic incorporation to individual cells. Understanding their complementary roles is essential for designing robust experiments in microbial ecology and drug discovery.
Table 1: Comparative Overview of Functional Microbiome Methods
| Feature | DNA-SIP | Metatranscriptomics | Single-Cell SIP (sc-SIP) |
|---|---|---|---|
| Core Measurement | ¹³C incorporation into DNA | Total RNA expression (mostly mRNA) | ¹³C incorporation into single cells |
| Taxonomic Resolution | Population-level (clustered in gradient fractions) | Population-level (from assembled transcripts) | Single-cell level |
| Functional Insight | Potential activity via DNA from active utilizers | Real-time gene expression | Metabolic activity per cell |
| Throughput | Medium | High | Low to Medium |
| Key Challenge | Cross-feeding, gradient resolution | RNA stability, host/rRNA depletion | Requires cell sorting, specialized MS |
| Primary Output | Heavy DNA fractions for sequencing | Gene/transcript abundance profiles | Raman spectra or FISH-SIMS data per cell |
| Cost | $$ | $$$ | $$$$ |
Table 2: Representative Quantitative Data from Recent Studies (2022-2024)
| Method | Study Focus | Key Metric | Result | Reference Insight |
|---|---|---|---|---|
| DNA-SIP | Phenol degradation in aquifer | % ¹³C-DNA in heavy fraction | 15-35% of total sequenced DNA | Identified Burkholderiales as key degraders. |
| Metatranscriptomics | Gut microbiome response to drug | Differentially Expressed Genes (DEGs) | 1,245 up-regulated DEGs | Revealed induction of antibiotic resistance genes within 4 hours. |
| sc-SIP (Raman) | Soil benzene degrader activity | Raman shift (cm⁻¹) for ¹³C | Shift from 2930 to 2080 cm⁻¹ | 12% of total Rhodococcus cells showed ¹³C incorporation. |
Detailed Experimental Protocols
Protocol A: Metatranscriptomics for Functional Profiling
This protocol complements DNA-SIP by showing expressed pathways in a community.
1. Sample Preservation & RNA Extraction:
- Immediately stabilize samples in RNAlater or flash-freeze in liquid N₂.
- Extract total RNA using a kit with bead-beating (e.g., RNeasy PowerMicrobiome). Include a DNase I treatment step.
- Quantify RNA using Qubit RNA HS Assay. Assess integrity via Bioanalyzer (RIN >7 desired).
2. rRNA Depletion & Library Prep:
- Deplete ribosomal RNA using a probe-based kit (e.g., Illumina Ribo-Zero Plus for bacteria/archaea).
- Use 10-100 ng of enriched mRNA for stranded cDNA library preparation (e.g., NEBNext Ultra II RNA Library Prep Kit).
- Perform size selection (e.g., 200-500 bp inserts) and amplify with 10-12 PCR cycles.
3. Sequencing & Analysis:
- Sequence on Illumina NovaSeq (2x150 bp), targeting 20-50 million read pairs per sample.
- Bioinformatics Pipeline: Trim reads (Trimmomatic) → Remove host reads (Bowtie2) → De novo assemble transcripts (MetaSPAdes in
-rnamode) → Map reads to assembly (Bowtie2) → Quantify expression (Salmon) → Annotate (eggNOG-mapper, KEGG).
Protocol B: Single-Cell SIP via Raman Microspectroscopy
This protocol links isotopic assimilation to individual cells, providing higher resolution than bulk DNA-SIP.
1. Sample Preparation & Isotope Incubation:
- Prepare environmental suspension (e.g., soil slurry, wastewater) in minimal medium with ¹³C-substrate (e.g., 99 atom% ¹³C-glucose). Incubate under in situ-like conditions.
- Include a ¹²C-control.
- After incubation (hours-days), fix cells with 2% formaldehyde (15 min, RT). Wash 3x in PBS.
2. Raman Spectral Acquisition:
- Spot 10 µL of cell suspension onto an aluminum-coated slide. Air dry.
- Acquire Raman spectra using a confocal Raman microscope (e.g., 532 nm laser, 600 gr/mm grating).
- Settings: 1-10 sec integration, 1-5 accumulations per spectrum. Focus on single cells under phase contrast.
3. Data Analysis for ¹³C Detection:
- Pre-process spectra: Subtract baseline, normalize to phenylalanine peak (~1003 cm⁻¹).
- Key Indicator: The "Raman shift" of the C-H stretching band (~2930 cm⁻¹ in ¹²C-cells) decreases to ~2080 cm⁻¹ in ¹³C-cells.
- Use multivariate analysis (PCA) to cluster ¹³C-positive vs. ¹³C-negative cells. Can be coupled with FISH for phylogenetic identification.
Visualized Workflows and Pathways
Title: Functional Method Selection Workflow
Title: Non-SIP Method Technical Pathways
The Scientist's Toolkit: Key Research Reagent Solutions
Table 3: Essential Materials for Featured Experiments
| Item | Function | Example Product/Catalog |
|---|---|---|
| RNAlater Stabilization Solution | Preserves RNA integrity in field/bench samples immediately upon collection. | Thermo Fisher Scientific, AM7020 |
| Ribo-Zero Plus rRNA Depletion Kit | Removes bacterial/archaeal rRNA to enrich mRNA for metatranscriptomics. | Illumina, 20037135 |
| NEBNext Ultra II Directional RNA Library Prep Kit | High-efficiency library construction from low-input mRNA. | New England Biolabs, E7760S |
| 99 atom% ¹³C-Labeled Substrates | Essential for both DNA-SIP and sc-SIP tracer experiments. | Cambridge Isotope Laboratories, CLM-1396 (Glucose) |
| Aluminum-Coated Slides (Raman) | Low fluorescence background for sensitive single-cell Raman detection. | Ted Pella, 26018 |
| Formaldehyde (16%), Methanol-free | For cell fixation prior to sc-SIP/FISH, preserves cell morphology. | Thermo Fisher, 28906 |
| DAPI (4',6-diamidino-2-phenylindole) | Counterstain for total cell visualization in microscopy-based methods. | Sigma-Aldrich, D9542 |
| Hybridization Buffers for FISH | Enables phylogenetic identification of single cells in sc-SIP workflows. | Biolegio, various buffers |
Within the broader thesis on refining and standardizing DNA-based Stable Isotope Probing (DNA-SIP) with ¹³C-labeled substrates, a critical chapter must address the inherent limitations of the technique. While SIP is a powerful tool for linking microbial identity to function in complex communities, the data it generates are not absolute and are subject to specific methodological and interpretational constraints. This document provides application notes and protocols to rigorously assess these limitations, ensuring robust and defensible conclusions in ¹³C-SIP research for drug development (e.g., identifying microbes that metabolize pharmaceutical compounds or precursors) and environmental science.
Key Limitations & Quantitative Assessment
The primary constraints of DNA-SIP can be categorized into technical, biological, and interpretational limitations. Quantitative data from recent studies (2020-2023) are summarized below.
Table 1: Quantitative Summary of Key DNA-SIP Limitations
| Limitation Category | Specific Constraint | Typical Range/Impact | Notes & Mitigation Strategies |
|---|---|---|---|
| Technical Resolution | Buoyant Density Shift (ΔBD) | 0.005–0.038 g mL⁻¹ per ¹³C atom | Depends on G+C content, labeling level. Requires ultracentrifugation optimization. |
| Required ¹³C Incorporation | ~20-30% of biomass carbon | Lower labeling may not separate from ¹²C-DNA; use sensitive detection (qSIP). | |
| Cross-Feeding Time Window | 24-72 hours (highly variable) | Short incubations risk missing slow growers; long incubations increase secondary label transfer. | |
| Biological Bias | Extraction Efficiency Bias | Varies by cell wall type (e.g., Gram+ vs. Gram-) | Can underrepresent certain taxa. Combine multiple lysis methods for community DNA. |
| rRNA Gene Copy Number Bias | 1-15 copies per genome | Overrepresents high-copy number organisms in amplicon-based SIP. Normalize with qSIP or genome-informed analysis. | |
| Non-Growth Metabolic Activity | Can lead to false positives | Use controls (killed cells, ¹²C controls) and track replication rates (e.g., via rrn copy number). | |
| Data Interpretation | Detection Threshold | ~0.1-1% relative abundance in community | Rare but active populations may be missed. Increase sequencing depth or use targeted assays. |
| Apparent vs. True Utilizers | Secondary feeders (cross-feeders) can be labeled | Time-series experiments and network analysis are required to infer primary utilizers. |
Detailed Experimental Protocols for Limitation Assessment
Protocol 3.1: Determining Minimum ¹³C Incorporation for Detection (qSIP Calibration)
Objective: To establish the lower limit of ¹³C-labeling detectable in DNA, moving beyond binary "heavy"/"light" separation. Materials: See "Scientist's Toolkit" (Table 3). Method:
- Create a ¹³C-Labeled Standard: Grow a model organism (e.g., E. coli) with a known mixture of ¹²C and ¹³C glucose (e.g., 0%, 25%, 50%, 75%, 100% ¹³C). Harvest biomass during exponential phase.
- DNA Extraction & Purification: Extract DNA using a kit optimized for purity (critical for density). Quantify precisely via fluorometry.
- Isopycnic Centrifugation:
- Prepare a CsCl gradient solution with a target average density of 1.725 g mL⁻¹ using gradient buffer.
- Load 1-5 µg of DNA per replicate tube. Centrifuge in an ultracentrifuge (e.g., Beckman Coulter Optima XE) with a vertical rotor (e.g., VTi 65.2) at 177,000 x g, 20°C, for 36-44 hours.
- Fractionation & Analysis:
- Fractionate the gradient into 12-20 equal fractions (~150 µL each) using a fractionation system.
- Measure the buoyant density of every third fraction via refractometry.
- Quantify DNA amount in each fraction using a high-sensitivity fluorescence assay (e.g., Quant-iT PicoGreen). For microbial community DNA, quantify target genes via qPCR.
- Data Calculation: Use the qSIP framework to calculate the atom percent (at%) ¹³C excess in each treatment based on the density shift of the DNA peak relative to the 0% ¹³C control. This establishes a calibration curve between observed ΔBD and actual ¹³C incorporation.
Protocol 3.2: Time-Series Experiment to Constrain Cross-Feeding
Objective: To differentiate primary substrate utilizers from secondary feeders (cross-feeders). Method:
- Microcosm Setup: Establish triplicate microcosms (e.g., soil, sediment, sludge) amended with the target ¹³C-substrate (e.g., ¹³C-drug intermediate). Include ¹²C-control and killed (autoclaved) controls.
- Destructive Sampling: Sacrifice replicate microcosms at multiple time points (e.g., T=6h, 12h, 24h, 48h, 96h, 1 week).
- DNA-SIP & Sequencing: Perform full DNA-SIP (as per Protocol 3.1, steps 3-4) on each time point. Pool "heavy" (labeled) fractions from each gradient. Amplify and sequence the 16S rRNA gene (or perform metagenomics) on both heavy and light fractions.
- Bioinformatic Analysis: Calculate the relative abundance of taxa in heavy vs. light fractions over time. Primary utilizers will appear in the heavy fraction at early time points. Taxa that appear labeled only at later time points are potential cross-feeders. Statistical analysis (e.g., using
SIPSimorhtsipin R) can confirm significant labeling.
Visualization of Concepts and Workflows
Diagram 1: DNA-SIP Workflow with Key Limitation Checkpoints
Diagram 2: Pathways of ¹³C-Label Transfer & Interpretation
The Scientist's Toolkit
Table 2: Essential Research Reagent Solutions for DNA-SIP Limitation Assessment
| Item | Function & Rationale |
|---|---|
| ¹³C-Labeled Substrate (>99 at% ¹³C) | The core tracer. High purity is essential to maximize label input and calculate at% ¹³C excess. |
| CsCl (Molecular Biology Grade) | Forms the density gradient during ultracentrifugation. Purity is critical for consistent buoyant density. |
| Gradient Buffer (e.g., Tris-EDTA, pH 8.0) | Maintains DNA stability and provides a uniform chemical background for centrifugation. |
| Density Refractometer | Precisely measures the buoyant density (g mL⁻¹) of gradient fractions. Essential for qSIP calculations. |
| Ultra-Sensitive DNA Stain (e.g., PicoGreen) | Quantifies tiny amounts of DNA in gradient fractions for generating precise density distribution profiles. |
| Phusion or Q5 High-Fidelity DNA Polymerase | For pre-fractionation PCR amplification with minimal bias, crucial for subsequent sequencing. |
| Mock Community DNA Standard | A defined mix of genomic DNA from known organisms. Used to test for technical bias in the entire SIP workflow. |
| Internal Density Standard (e.g., ¹⁵N-DNA) | DNA with a known, different density shift. Can be co-centrifuged to calibrate gradients across runs. |
Conclusion
The DNA-SIP protocol with 13C is a powerful, cultivation-independent tool that directly links microbial phylogenetic identity to specific metabolic functions within complex communities. Mastering its execution—from robust experimental design and meticulous gradient fractionation to rigorous validation—empowers researchers to uncover novel microbial actors in critical processes, from xenobiotic degradation to syntrophic interactions in disease states. As protocols become more sensitive with qSIP and are integrated with multi-omics approaches, DNA-SIP is poised to play an increasingly pivotal role in drug discovery, personalized medicine, and rational microbiome manipulation. Future directions point toward high-throughput miniaturization, coupling with cutting-edge sequencing, and application to clinical samples, ultimately translating ecological insights into targeted biomedical interventions.