3D Biofilm Imaging: Mastering FISH-Confocal Microscopy for Advanced Microbial Analysis
This comprehensive guide details the integrated methodology of Fluorescence In Situ Hybridization (FISH) and confocal laser scanning microscopy (CLSM) for the high-resolution, three-dimensional visualization and analysis of complex biofilms.
3D Biofilm Imaging: Mastering FISH-Confocal Microscopy for Advanced Microbial Analysis
Abstract
This comprehensive guide details the integrated methodology of Fluorescence In Situ Hybridization (FISH) and confocal laser scanning microscopy (CLSM) for the high-resolution, three-dimensional visualization and analysis of complex biofilms. Tailored for researchers, scientists, and drug development professionals, it covers foundational principles, step-by-step protocols, optimization strategies, and comparative validation against other imaging modalities. The article addresses key intents from understanding biofilm architecture and microbial community composition (Exploratory), to practical application and troubleshooting (Methodological), through to ensuring data robustness and selecting the right tool for specific research questions (Validation). This synthesis provides a critical resource for advancing studies in antimicrobial resistance, microbiome research, and therapeutic development.
Understanding Biofilm Complexity: Why 3D FISH-Confocal is a Game-Changer
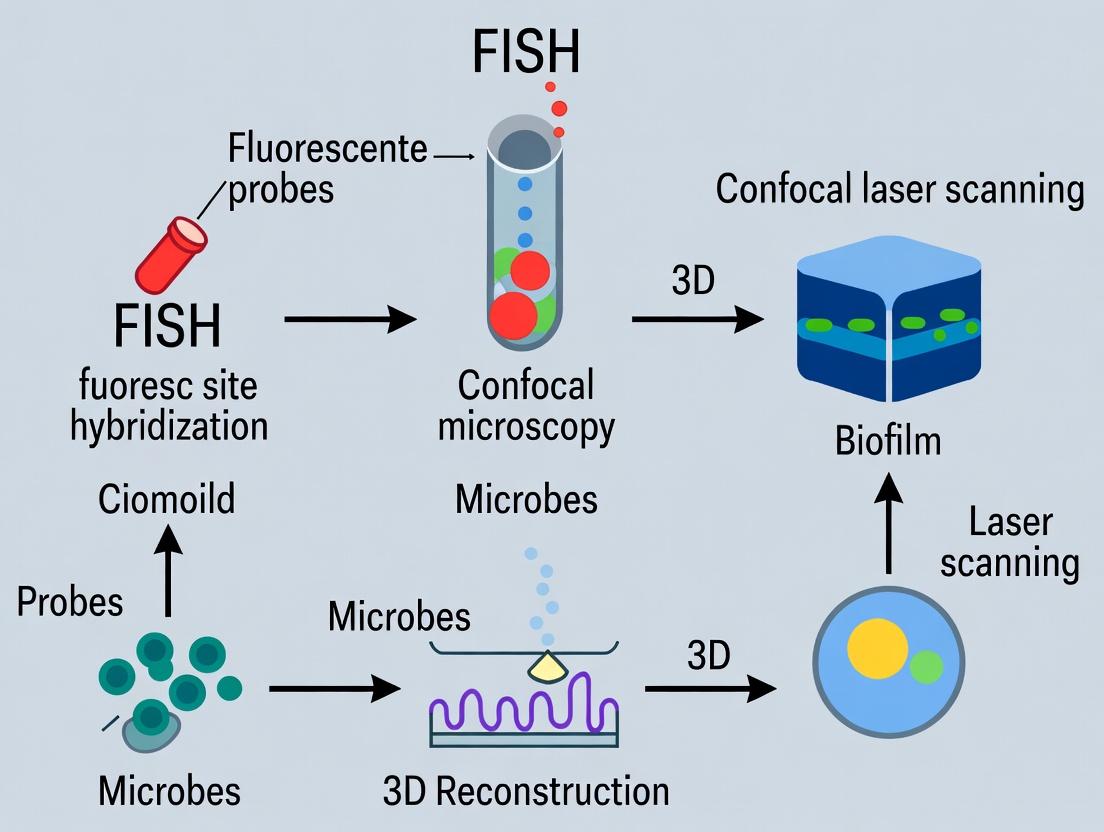
The analysis of biofilms represents a significant challenge in microbial ecology, medicine, and industrial bioprocessing. Their inherent three-dimensional structure, composed of a heterogeneous matrix of extracellular polymeric substances (EPS) and taxonomically diverse microbial consortia, necessitates advanced imaging and analytical techniques. Confocal Laser Scanning Microscopy (CLSM) combined with Fluorescence In Situ Hybridization (FISH) has emerged as the gold standard for resolving this complexity in situ, allowing for the correlation of spatial organization with phylogenetic identity in 3D. This Application Note details protocols and considerations for robust 3D biofilm imaging using FISH-CLSM, framed within a research thesis focused on quantifying architectural parameters and microbial interactions.
Research Reagent Solutions Toolkit
| Item | Function & Rationale |
|---|---|
| Cyanine (Cy3, Cy5) or Fluorescein-labeled oligonucleotide probes | Target-specific rRNA sequences for phylogenetic identification. High photostability and brightness are crucial for CLSM. |
| Paraformaldehyde (4% in PBS) | Fixative for preserving biofilm architecture and cellular integrity while maintaining probe accessibility to rRNA. |
| Ethanol (50%, 80%, 96%) | Used for dehydration post-fixation to enhance probe penetration into the dense EPS matrix. |
| Hybridization Buffer (0.9 M NaCl, Formamide, SDS) | Creates stringent conditions for specific probe binding; formamide concentration is probe-specific. |
| Washing Buffer (Based on NaCl concentration) | Removes unbound and non-specifically bound probes post-hybridization to reduce background. |
| Citifluor AF1 or ProLong Antifade Mountant | Antifading reagent to minimize photobleaching during prolonged CLSM scanning. |
| SYTO 9 or DAPI | General nucleic acid counterstain for visualizing total biomass and evaluating biofilm integrity. |
| ConA, Alexa Fluor 488 conjugate | Lectin-based stain for specific EPS components (e.g., α-mannopyranosyl/α-glucopyranosyl residues). |
Detailed Protocol: FISH-CLSM for 3D Biofilm Analysis
Part A: Biofilm Fixation and Pretreatment
- Fixation: Gently wash the biofilm-grown substrate (e.g., coupon, flow cell) with 1X PBS to remove loosely adherent cells. Immerse in fresh 4% paraformaldehyde (PFA) in PBS for 2-4 hours at 4°C.
- Washing: Remove PFA and wash three times with 1X PBS for 5 minutes each.
- Dehydration: Immerse the sample in an ethanol series (50%, 80%, 96%) for 3 minutes each. Air-dry completely.
Part B: Fluorescence In Situ Hybridization
- Probe Design & Selection: Use databases like probeBase to select 16S/23S rRNA-targeted probes. Include a negative control (NON-EUB probe).
- Hybridization Mixture: For each sample, prepare 20-50 µL of hybridization buffer containing 1-5 ng/µL of each fluorescently labeled probe.
- Application & Incubation: Apply mixture to the sample, place in a humidified, dark chamber, and incubate at 46°C for 1.5-3 hours. Formamide concentration dictates hybridization stringency.
- Stringent Wash: Transfer sample to pre-warmed (48°C) washing buffer for 10-20 minutes. Rinse briefly with ice-cold distilled water and air-dry in darkness.
Part C: Confocal Microscopy & 3D Image Acquisition
- Mounting: Mount the sample using an antifading mounting medium. Seal coverslip edges with nail polish.
- Microscope Setup: Use a confocal microscope with lasers matching your fluorophores (e.g., 514 nm for Cy3, 633 nm for Cy5). Select appropriate emission filters.
- Acquisition Parameters:
- Set Z-step size to ≤ 1.0 µm to satisfy the Nyquist criterion for 3D reconstruction.
- Adjust pinhole to 1 Airy Unit for optimal optical sectioning.
- Use sequential scanning mode to eliminate channel crosstalk.
- Set bit depth to 12-bit or higher for quantitative intensity analysis.
- Image Acquisition: Capture a Z-stack spanning the entire biofilm depth. Save images in an uncompressed format (e.g., .tiff, .lsm).
Quantitative Data from FISH-CLSM Analysis
Table 1: Common 3D Architectural Metrics Quantifiable from CLSM Z-Stacks via Image Analysis Software (e.g., COMSTAT, daime, ImageJ)
| Metric | Description | Typical Value Range* | Biological Insight |
|---|---|---|---|
| Biovolume (µm³/µm²) | Total volume of stained biomass per substratum area. | 5 - 50 µm³/µm² | Indicates total biofilm accumulation. |
| Average Thickness (µm) | Mean vertical biofilm thickness. | 20 - 100 µm | Describes overall biofilm size. |
| Maximum Thickness (µm) | Maximum vertical extent of the biofilm. | 50 - 200 µm | Identifies location of towering structures. |
| Substratum Coverage (%) | Percentage of surface area covered by biofilm. | 20% - 95% | Reflects adhesion and lateral growth. |
| Surface Area to Biovolume Ratio (µm²/µm³) | Roughness coefficient; higher values indicate more complex, uneven structure. | 0.5 - 2.5 µm²/µm³ | Quantifies structural complexity and porosity. |
| Spatial Co-localization (Manders' Coefficient) | Fraction of pixels in one channel co-localizing with a second channel. | 0.1 - 0.8 | Measures degree of mixed-species clustering. |
*Values are environment and species-dependent examples.
Workflow and Pathway Diagrams
FISH-CLSM 3D Biofilm Analysis Workflow
FISH Stringency Control via Buffer Conditions
Application Notes Fluorescence In Situ Hybridization (FISH) is the cornerstone for achieving taxonomic specificity in the three-dimensional imaging of complex biofilm consortia. Its fundamental principle is the complementary binding of fluorescently labeled oligonucleotide probes to unique target sequences, typically 16S or 23S rRNA, within intact microbial cells. When integrated with confocal laser scanning microscopy (CLSM), FISH transitions from a diagnostic tool to a powerful research platform, enabling the precise spatial localization and quantification of defined phylogenetic groups within the native biofilm architecture. This synergy is critical for thesis research investigating interspecies interactions, metabolic zonation, and the spatial dynamics of antimicrobial resistance in biofilms.
The specificity of FISH is hierarchical. Probe design targets hypervariable regions of rRNA, allowing differentiation at the domain, genus, and sometimes species level. The stringency of hybridization (controlled by formamide concentration, temperature, and salt) is finely tuned to discriminate between target and non-target sequences with even single-base-pair mismatches. Quantitative data from recent studies underscore this capability (Table 1).
Table 1: Quantitative Metrics of FISH Specificity in Biofilm Imaging
| Metric | Typical Range/Value | Experimental Context |
|---|---|---|
| Probe Length | 15-25 nucleotides | Optimizes between specificity and binding efficiency. |
| % Formamide in Hybridization Buffer | 0-80% (in 5-10% increments) | Standard stringency regulator; concentration is probe-specific. |
| Hybridization Temperature | 46°C ± 5°C | Standardized for most protocols; adjusted for probe Tm. |
| Detection Limit (Cell Abundance) | >0.1% of total community | For reliable CLSM detection in a heterogeneous biofilm. |
| False Positive/Negative Rate | <1-5% (with optimized protocol) | Assessed using pure culture controls and nonsense probes. |
| Spatial Resolution (with CLSM) | ~200 nm lateral, ~500 nm axial | Limits the minimal distance between distinguishable fluorescent signals. |
Experimental Protocols
Protocol 1: Design and In Silico Validation of FISH Probes
- Target Selection: Identify unique 16S/23S rRNA target regions for your taxon of interest using databases (SILVA, RDP, Greengenes).
- Probe Design: Design oligonucleotides (18-22 nt). Check for secondary structure (e.g., using mfold).
- Specificity Check: Perform in silico alignment (using BLAST or ARB probe match tools) against a comprehensive rRNA database to ensure target group coverage and exclude non-target hits.
- Controls: Design a nonsense (NON) probe (random sequence) as a negative control and a universal (EUB) probe mix targeting most Bacteria as a positive control.
Protocol 2: FISH on Biofilm Samples for 3D CLSM Imaging Materials: Biofilm grown on a suitable substrate (e.g., glass coverslip), paraformaldehyde (PFA, 4%), ethanol, hybridization oven, humidified chamber, fluorescently labeled probes (e.g., Cy3, Cy5, FITC). Workflow Diagram:
Title: FISH Protocol Workflow for Biofilm CLSM
- Fixation: Immerse biofilm in 4% PFA (in PBS) for 3h at 4°C. Wash 3x with PBS.
- Dehydration: Sequentially immerse in 50%, 80%, and 98% ethanol (3 min each). Air dry.
- Hybridization: Apply 20-50 µL of hybridization buffer (0.9 M NaCl, 20 mM Tris/HCl, 0.01% SDS, % formamide probe-specific) containing 2-10 ng/µL of each probe. Incubate at 46°C for 2-4 hours in a dark, humidified chamber.
- Washing: Remove coverslip and transfer to pre-warmed wash buffer (20 mM Tris/HCl, 0.01% SDS, 5 mM EDTA, probe-specific NaCl concentration). Incubate at 48°C for 20 minutes in the dark.
- Rinsing & Mounting: Briefly rinse with ice-cold deionized water. Air dry in the dark. Mount with an antifading mounting medium (e.g., Vectashield).
- Imaging: Acquire 3D z-stacks using CLSM with appropriate laser lines and emission filters for each fluorophore.
Protocol 3: Signal Amplification via CARD-FISH (for low-ribosome-content cells) For targets with weak signal, apply Catalyzed Reporter Deposition (CARD)-FISH.
- Perform standard fixation. Subsequently permeabilize with lysozyme (10 mg/mL, 37°C, 1h).
- Quench endogenous peroxidases with 0.15% H₂O₂ in methanol (30 min, RT).
- Hybridize with horseradish peroxidase (HRP)-labeled probes.
- Post-hybridization wash.
- Incubate with fluorescently labeled tyramide (e.g., Cy3-tyramide) + 0.0015% H₂O₂ for 20-30 min at 37°C.
- Wash thoroughly and proceed to CLSM.
The Scientist's Toolkit: Key Research Reagent Solutions
| Item | Function & Rationale |
|---|---|
| HRP-Labeled Oligonucleotide Probes | Enables CARD-FISH for signal amplification, crucial for imaging slow-growing or stressed cells in biofilms. |
| Formamide (Molecular Biology Grade) | Critical for controlling hybridization stringency; purity prevents fluorescent background. |
| Antifading Mounting Medium (e.g., Vectashield, ProLong Gold) | Preserves fluorescence photostability during prolonged CLSM z-stack acquisition. |
| Multiplex FISH Probe Sets (e.g., CLASI-FISH probes) | Allow simultaneous visualization of dozens of taxa via combinatorial labeling, mapping complex community structures. |
| Lysozyme & Proteinase K | Enzymatic permeabilization agents for CARD-FISH or for biofilms with dense extracellular matrices. |
| High-Stringency Wash Buffer (NaCl-based) | Precisely removes imperfectly matched probes post-hybridization, defining final specificity. |
| Fluorophore-Conjugated Tyramide (for CARD-FISH) | Substrate for HRP; deposits numerous fluorophores at the probe site, amplifying signal 10-100x. |
Specificity Control Logic Diagram
Title: FISH Specificity Validation Pathway
Fluorescence in situ hybridization (FISH) targeting specific rRNA sequences is a cornerstone technique for identifying and visualizing microbial community structures within biofilms. However, conventional widefield fluorescence microscopy suffers from out-of-focus blur when imaging thick, structurally complex 3D biofilms, obscuring critical spatial relationships. This limitation directly impacts research in antimicrobial drug development, where understanding the 3D architecture of resistant biofilms is paramount.
Confocal laser scanning microscopy (CLSM) overcomes this by providing optical sectioning, enabling the collection of high-resolution, blur-free images from discrete focal planes within a thick specimen. Sequential optical sections (Z-stacks) can be computationally reconstructed into accurate 3D models, allowing for quantitative analysis of biofilm volume, porosity, and the co-localization of different microbial taxa identified via multi-channel FISH. This synergy between FISH and confocal microscopy is essential for advancing the thesis that 3D spatial organization is a key determinant in biofilm-mediated antimicrobial resistance.
Core Technical Principles: Optical Sectioning and 3D Reconstruction
The fundamental innovation of a point-scanning confocal microscope is the use of two conjugate pinholes: one in front of the light source and one in front of the detector. The illumination pinhole focuses a laser to a diffraction-limited spot within the specimen. The emitted fluorescence from this spot is then focused onto the detection pinhole, which rejects light originating from above or below the focal plane. Only light from the in-focus point passes through to the photomultiplier tube (PMT) detector. This point is scanned across the X-Y plane to build a complete 2D optical section. By incrementally moving the focal plane in the Z-axis, a Z-stack of serial optical sections is acquired.
Key Quantitative Parameters: The thickness of the optical section is defined by the axial resolution, which is influenced by the numerical aperture (NA) of the objective, the excitation wavelength, and the pinhole diameter. A pinhole diameter set to 1 Airy Unit (AU) optimizes the trade-off between signal intensity and Z-resolution.
3D Reconstruction involves deconvolution (to further reduce haze and improve resolution) and volume rendering or iso-surface rendering of the Z-stack to create a manipulable 3D model from which quantitative metrics can be extracted.
Table 1: Quantitative Comparison of Microscopy Modalities for 3D Biofilm Imaging
| Parameter | Widefield Fluorescence | Spinning Disk Confocal | Point-Scanning Laser Confocal (CLSM) | Relevant Impact for FISH in Biofilms |
|---|---|---|---|---|
| Optical Sectioning | No | Yes | Yes | Essential for eliminating out-of-focus FISH signal from dense biofilm layers. |
| Axial (Z) Resolution | ~1.5 - 2 µm | ~0.8 - 1.2 µm | ~0.5 - 0.7 µm | Higher Z-resolution enables finer discrimination of bacterial microcolony layers in 3D. |
| Image Acquisition Speed | Very Fast | Very Fast | Moderate to Slow | Speed critical for live imaging; less critical for fixed FISH biofilms. |
| Photobleaching & Phototoxicity | Moderate | Low | High (with laser power) | Significant for fixed samples; high laser power can bleach FISH fluorophores. |
| Signal-to-Noise Ratio (SNR) | Low (with out-of-focus light) | High | Very High | Superior SNR is crucial for detecting dim FISH signals from slow-growing/less abundant taxa. |
| Multi-Channel Flexibility | High | High | Very High | Excellent for complex multi-taxa FISH (e.g., 5+ labels with sequential scanning). |
Diagram 1: Core Principle of Confocal Optical Sectioning (100 chars)
Detailed Protocols
Protocol 3.1: Combined FISH-CLSM for 3D Biofilm Imaging
Aim: To generate a 3D reconstruction of a multi-species biofilm with phylogenetic identification via FISH.
I. Biofilm Growth and Fixation
- Culture & Surface: Grow biofilm in flow cell or on coverslip in relevant medium for desired time.
- Fixation: Gently immerse biofilm in 4% paraformaldehyde (PFA) in 1X PBS for 2-4 hours at 4°C.
- Rinsing: Wash 3x with 1X PBS for 5 minutes each to remove residual PFA.
- Dehydration: Immerse in 50%, 80%, and 98% ethanol baths (3 minutes each) for permeabilization and storage. Store at -20°C.
II. Fluorescence In Situ Hybridization (FISH)
- Probe Design: Use rRNA-targeted oligonucleotide probes labeled with fluorophores (e.g., Cy3, Cy5, FLUOS). Ensure fluorophores are compatible with your CLSM lasers (see Table 2).
- Hybridization Buffer: Prepare buffer containing appropriate formamide concentration (e.g., 0-60%) to control stringency. Standard buffer: 0.9 M NaCl, 20 mM Tris/HCl (pH 7.2), 0.01% SDS, and formamide.
- Hybridization: Apply 50-100 µL hybridization buffer containing 5 ng/µL probe to sample. Incubate in a dark, humidified chamber at 46°C for 1.5-3 hours.
- Stringency Wash: Transfer sample to pre-warmed wash buffer (varies with formamide concentration) at 48°C for 10-15 minutes.
- Rinse & Counterstain: Rinse briefly with distilled water. Optional: Apply general nucleic acid stain (e.g., DAPI, 1 µg/mL for 5 min) for biomass visualization. Mount in anti-fading mounting medium (e.g., Vectashield).
III. Confocal Imaging (Z-Stack Acquisition)
- System Setup: Turn on CLSM, lasers, and software. Allow lasers to stabilize (15-30 min).
- Objective Selection: Choose a high-NA oil immersion objective (e.g., 63x/1.4 NA Plan-Apochromat).
- Pinhole Alignment & Setting: Align pinholes and set to 1 Airy Unit for optimal resolution.
- Multi-Channel Setup: Configure sequential scanning channels for each FISH fluorophore and counterstain to avoid bleed-through.
- Define Z-Stack: Use software to set top and bottom of the biofilm volume. Set step size (ΔZ) to ≤0.5 x axial resolution (e.g., 0.3 µm).
- Acquisition: Set laser power and PMT gain to avoid saturation. Acquire Z-stack.
IV. 3D Reconstruction & Analysis
- Deconvolution: Apply iterative deconvolution algorithm (e.g., Classic Maximum Likelihood) to Z-stack to improve resolution.
- Rendering: Use 3D module in software (e.g., Imaris, Arivis Vision4D, FIJI/ImageJ) to create volume render or iso-surface models.
- Quantification: Measure parameters such as: Biovolume (µm³), Thickness (µm), Surface Area to Volume Ratio, Porosity, and Co-localization Coefficients between different FISH probes.
Protocol 3.2: Calibration Protocol for Accurate 3D Measurements
Aim: To calibrate the CLSM system for accurate dimensional measurements in XYZ.
- XY Calibration: Image a stage micrometer with a 10 µm grid. Calculate pixel size (µm/pixel).
- Z Calibration: Use a calibration slide with known depth features or sub-resolution fluorescent beads. Acquire a Z-stack and measure the step motor accuracy. Verify ΔZ setting.
- Validation: Image fluorescent microspheres of known diameter (e.g., 1 µm) in 3D. Measure FWHM in X, Y, and Z to determine actual system resolution.
Diagram 2: FISH-Confocal 3D Imaging Workflow (99 chars)
The Scientist's Toolkit: Research Reagent Solutions
Table 2: Essential Materials for FISH-Confocal 3D Biofilm Imaging
| Item / Reagent | Function / Role in Experiment | Key Considerations for Confocal |
|---|---|---|
| High-NA Oil Immersion Objective (e.g., 63x/1.4 NA) | Maximizes light collection and spatial resolution (XY & Z). | Essential for achieving optimal optical sectioning. Must match immersion oil refractive index (n=1.518). |
| FISH-Oligonucleotide Probes (e.g., Cy3, Cy5, Alexa Fluor conjugates) | Target specific 16S/23S rRNA sequences for taxonomic ID. | Fluorophores must match available laser lines (e.g., 561 nm for Cy3, 640 nm for Cy5). Check for cross-excitation. |
| Anti-Fade Mounting Medium (e.g., Vectashield, ProLong Diamond) | Preserves fluorescence signal during imaging. Reduces photobleaching. | Refractive index (~1.4) crucial for spherical aberration correction in deep imaging. |
| Calibration Slides (e.g., stage micrometer, fluorescent beads) | Calibrate pixel size (XY) and step size (Z) for accurate 3D quantification. | Required for turning image pixels into reliable metric measurements. |
| Formamide (in hybridization buffer) | Controls stringency of FISH probe binding; lowers melting temperature. | Concentration (% v/v) is probe-specific. Higher % increases stringency for mismatched targets. |
| Image Analysis Software (e.g., Imaris, Arivis, FIJI) | Deconvolution, 3D volume rendering, and quantitative analysis of Z-stacks. | Must handle large (>4GB) multi-channel Z-stacks efficiently. |
| High-Performance Computing Workstation | Processes large 3D image datasets and runs deconvolution algorithms. | Requires significant RAM (≥32 GB), fast multi-core CPU, and dedicated GPU. |
Application Notes
The integration of Fluorescence In Situ Hybridization (FISH) with Confocal Laser Scanning Microscopy (CLSM) creates a powerful platform for interrogating the spatial ecology of complex microbial consortia, such as biofilms. This combination allows for the precise phylogenetic identification of microorganisms while resolving their three-dimensional spatial organization and microenvironmental context at micron-scale resolution. Within the broader thesis on advanced 3D biofilm imaging, this synergy is indispensable for moving beyond compositional lists to understanding functional architectures, interspecies interactions, and niche partitioning.
Core Advantages & Quantitative Data
The table below summarizes the quantitative enhancements offered by the combined FISH-CLSM approach compared to either technique used in isolation.
Table 1: Quantitative Benefits of Combined FISH-CLSM for 3D Biofilm Imaging
| Parameter | FISH Alone (Epifluorescence) | CLSM Alone (Autofluorescence/Stains) | Combined FISH-CLSM | Implication for Spatial Ecology |
|---|---|---|---|---|
| Axial (Z) Resolution | ~500-700 nm | ~500-700 nm | ~500-700 nm | Enables precise 3D localization of target cells within biofilm strata. |
| Lateral (XY) Resolution | ~200-250 nm | ~200-250 nm | ~200-250 nm | Distinguishes individual microbial cells in dense aggregates. |
| Identification Specificity | High (Phylogenetic) | Low (Morphological/General) | Very High | Links identity (who) directly to location and neighbors (where and with whom). |
| Signal-to-Noise Ratio (3D) | Low (out-of-focus blur) | High | Very High | Enables accurate volumetric rendering and quantification of biovolume per taxon. |
| Multiplexing Capacity | Moderate (4-6 colors with careful probe design) | High (broad spectrum dyes) | High (Integrated) | Simultaneously maps multiple taxa alongside structural (EPS, matrix) and chemical (pH, O₂) parameters. |
| Quantifiable Outputs | 2D cell counts | 3D biomass, thickness, texture | 3D spatial statistics: Co-localization coefficients, Nearest-Neighbor Distances, Biovolume per Taxon | Provides robust metrics for testing ecological hypotheses about interaction and organization. |
Key Research Findings
Recent studies leveraging this combination have yielded critical insights. For instance, analysis of oral biofilms has quantified the non-random, stratified organization of Streptococcus and Actinomyces species, with co-localization coefficients exceeding 0.7, indicating tight symbiotic clustering. In wastewater granular sludge, FISH-CLSM revealed methanogenic archaea residing in specific, protected anoxic microniches (<0.1 μM O₂) within the granule interior, explaining functional stability. In a medical context, combined imaging of chronic wound biofilms demonstrated Pseudomonas aeruginosa and Staphylococcus aureus forming interdigitated clusters in 3D, with a median nearest-neighbor distance of only 4.2 ± 1.5 μm, a spatial relationship correlated with increased antibiotic tolerance.
Protocols
Protocol 1: Combined Multiplex FISH and CLSM for 3D Biofilm Architecture
This protocol details the workflow for preparing, hybridizing, and imaging a multiplexed biofilm sample to correlate phylogenetic identity with 3D structure.
Research Reagent Solutions Toolkit
| Item | Function | Example/Notes |
|---|---|---|
| Formalin (4% Paraformaldehyde) | Fixative | Preserves 3D biofilm structure and immobilizes cells. |
| Ethanol Series (50%, 80%, 96%) | Dehydration & Storage | Dehydrates fixed sample for long-term storage at -20°C. |
| Lysozyme or Proteinase K | Permeabilization Enzyme | Digests cell walls to allow FISH probe entry; concentration is organism-dependent. |
| Hybridization Buffer (0.9 M NaCl, Formamide, SDS) | FISH Reaction Medium | Formamide concentration controls stringency and is probe-specific. |
| HRP-labeled oligonucleotide FISH Probes | Phylogenetic Detection | e.g., EUB338 for Bacteria, ARC915 for Archaea, species-specific probes. |
| Tyramide Signal Amplification (TSA) Dyes | Fluorescent Signal Amplification | Cy3, Cy5, FITC-labeled tyramides. Amplifies signal from HRP-labeled probes. |
| SYTO 63 or FilmTracer FM dyes | General Nucleic Acid/Matrix Stain | Counterstain for total cells or EPS matrix visualization. |
| Mounting Medium (e.g., VECTASHIELD) | Anti-fade Mountant | Reduces photobleaching during prolonged CLSM imaging. |
| Matrigel or Low-Melt Agarose | Embedding Medium | For immobilizing delicate biofilm pieces during processing. |
Experimental Procedure:
- Sample Fixation & Embedding: Gently rinse the biofilm (e.g., on a substrate or filter). Immerse in 4% PFA for 4-12 hrs at 4°C. Wash with 1x PBS. For fragile biofilms, embed in 2% low-melt agarose before dehydration. Dehydrate through ethanol series (50%, 80%, 96%, 3 min each) and store in 96% ethanol at -20°C.
- Permeabilization (if needed): Rehydrate sample with PBS. Apply appropriate permeabilization enzyme (e.g., 10 mg/mL lysozyme for Gram-positives, 30 min, 37°C). Wash thoroughly with PBS.
- Multiplexed Hybridization: a. Apply HRP-labeled FISH probes (e.g., 2-5 ng/μL) in appropriate hybridization buffer to the sample. Incubate in a dark, humid chamber at 46°C for 90-120 min. b. Wash in pre-warmed wash buffer (based on hybridization buffer) at 48°C for 15-30 min. c. For signal amplification, incubate sample with the corresponding fluorescently labeled tyramide (1:500 dilution in amplification buffer) for 30-45 min at 46°C in the dark. Wash thoroughly. d. Repeat steps a-c for each subsequent HRP-labeled probe, inactivating the previous HRP with 0.01M HCl treatment between rounds.
- Counterstaining & Mounting: Apply a general stain (e.g., SYTO 63 for 15 min) to label all nucleic acids or a specific EPS stain. Rinse. Mount the sample under a coverslip using an anti-fade mounting medium.
- CLSM Imaging & 3D Reconstruction: Image using a confocal microscope with laser lines matching your fluorophores. Acquire Z-stacks with a step size of 0.5-1.0 μm, ensuring Nyquist sampling. Use sequential scanning mode to minimize spectral bleed-through. Reconstruct and analyze 3D volumes using software like ImageJ/Fiji, Imaris, or Arivis Vision4D.
Protocol 2: Correlative FISH-CLSM and Functional Staining for Microenvironment Mapping
This protocol outlines how to overlay phylogenetic identity with microenvironmental parameters like pH or metabolic activity.
Procedure:
- Functional Staining: Prior to fixation, incubate the live biofilm with a vital fluorescent probe (e.g., pH-sensitive SNARF-1 for pH mapping, or CTC for respiratory activity) following the manufacturer's protocol.
- Rapid Fixation: Immediately fix the stained biofilm with 4% PFA as in Protocol 1. Note: Some functional probes may not survive the full FISH protocol; initial CLSM imaging of the live stain may be necessary.
- FISH Processing: Process the fixed sample for FISH as described in Protocol 1, Steps 2-4.
- Correlative Imaging: Use the CLSM to precisely relocate the previously imaged functional stain fields of view. Acquire the FISH signal channels. Merge the functional and phylogenetic datasets.
- Data Analysis: Calculate correlation metrics between the spatial distribution of a target taxon (from FISH) and the intensity gradient of the functional stain (e.g., pH). Generate 3D overlays showing microenvironments associated with specific populations.
Experimental Workflow & Pathway Diagrams
Diagram Title: Integrated FISH-CLSM 3D Biofilm Analysis Workflow
Diagram Title: Tyramide Signal Amplification (TSA) Principle for FISH
Within the broader thesis on advancing in situ biofilm analysis, this application note details the experimental pipeline that transitions from characterizing microbial community composition to resolving its three-dimensional spatial organization. Integrating Fluorescence In Situ Hybridization (FISH) with confocal laser scanning microscopy (CLSM) is pivotal for addressing fundamental research questions in microbial ecology, antimicrobial resistance, and drug development. This protocol enables the correlation of phylogenetic identity with spatial niche, a critical step for understanding community function and resilience.
Application Notes: Core Research Questions and Quantitative Insights
The integration of FISH-CLSM addresses a sequential set of research questions, the answers to which provide a quantitative understanding of biofilm architecture.
Table 1: Key Research Questions and Quantitative Metrics from FISH-CLSM Analysis
| Research Question Phase | Specific Question | Quantitative Metric / Output | Typical Value/Output from Recent Studies* |
|---|---|---|---|
| Community Composition | What taxonomic groups are present and what are their relative abundances? | Relative biovolume (%) from probe-positive signals. | P. aeruginosa: 60% ± 5%; S. aureus: 25% ± 4%; Unlabeled: 15% ± 3% |
| Spatial Organization | How are different taxa distributed in 3D space? | Radial distribution profiles; Distance to nearest neighbor of another taxon. | Streptococcus spp. form clusters with a mean nearest-neighbor distance of 2.1 ± 0.8 µm. |
| Structural Role | Do specific taxa define the biofilm's physical structure? | Co-localization coefficients (Manders, Pearson); Biovolume in specific structural regions (e.g., base, mushroom cap). | M1 co-localization of EPS matrix (lectin) with dominant taxon: 0.78 ± 0.05. |
| Functional Implications | How does spatial arrangement influence chemical microenvironments or inter-species interactions? | Concentration gradients (pH, O₂) mapped via ratiometric dyes relative to taxon-specific FISH signals. | Anoxic zones (O₂ < 10%) consistently initiate within dense clusters of obligate anaerobes. |
| Dynamic Response | How does spatial organization change upon antimicrobial treatment? | Change in biovolume and cluster compactness (sphericity index) pre- and post-treatment. | Post-antibiotic, resistant sub-populations reorganize into more compact clusters (sphericity index increase from 0.6 to 0.8). |
*Values are synthesized illustrative examples from recent literature.
Experimental Protocols
Protocol 1: Multiplexed FISH for Biofilm Community Composition
Objective: To simultaneously label multiple phylogenetic groups within a fixed biofilm sample. Materials: See "Research Reagent Solutions" below. Procedure:
- Biofilm Fixation: Grow biofilm on suitable substrate (e.g., glass coverslip). Immerse in 4% paraformaldehyde (PFA) for 2-4 hrs at 4°C. Wash 3x in 1x PBS.
- Permeabilization: For Gram-negative rich biofilms, treat with Lysozyme (10 mg/mL) for 10 min at 37°C. For Gram-positive, use 1 mg/mL Lysozyme + 50 U/mL Mutanolysin for 30 min. Wash.
- Hybridization: Prepare hybridization buffer (0.9 M NaCl, 20 mM Tris/HCl pH 7.5, 0.01% SDS, 20-30% formamide concentration probe-dependent). Add HRP-labeled oligonucleotide probes (e.g., EUB338 for Bacteria, PSE for Pseudomonas, STA for Staphylococcus). Apply 100 µL to sample and incubate at 46°C for 90 min in a dark, humid chamber.
- Post-Hybridization Wash: Immerse sample in pre-warmed wash buffer (based on hybridization buffer salt conc.) at 48°C for 15 min.
- Signal Amplification (if using HRP probes): Incubate with Tyramide Signal Amplification (TSA) fluorophore (e.g., Cy3, Cy5, FITC) diluted 1:100 in amplification buffer for 30 min at 46°C in the dark. Wash thoroughly.
- Counterstaining & Mounting: Stain with DAPI (1 µg/mL) for 10 min. Rinse. Mount with antifading mounting medium.
Protocol 2: Confocal Microscopy & 3D Image Acquisition
Objective: To acquire high-resolution, channel-separated 3D image stacks of the multiplexed FISH-labeled biofilm. Procedure:
- Microscope Setup: Use an inverted CLSM equipped with appropriate lasers (e.g., 405 nm for DAPI, 488 nm for FITC, 561 nm for Cy3, 640 nm for Cy5).
- Spectral Calibration: Perform sequential scanning to eliminate cross-talk between fluorophores. Set detection bandwidths using spectral unmixing or standard PMT filters.
- Z-stack Acquisition: Define the top and bottom of the biofilm using the DAPI or autofluorescence signal. Set step size (dz) to ≤ 0.5 µm to satisfy Nyquist sampling for 3D reconstruction.
- Image Parameter Optimization: Adjust pinhole (1 Airy unit), laser power, gain, and scan speed to maximize signal-to-noise ratio while avoiding saturation and photobleaching. Acquire multiple random fields per sample.
Visualization Diagrams
Title: FISH-CLSM 3D Biofilm Analysis Workflow
Title: From Composition to Spatial Organization: Research Questions & Metrics
The Scientist's Toolkit: Research Reagent Solutions
Table 2: Essential Materials for FISH-CLSM Biofilm Imaging
| Item | Function & Rationale |
|---|---|
| Paraformaldehyde (4% PFA) | Cross-linking fixative. Preserves 3D biofilm structure and cellular morphology while retaining nucleic acids for FISH. |
| Lysozyme & Mutanolysin | Enzymatic permeabilization. Breaks down peptidoglycan to allow FISH probe entry into bacterial cells. |
| HRP-labeled FISH Probes | Oligonucleotides targeting 16S rRNA, conjugated to Horseradish Peroxidase. Enables catalytic signal amplification via TSA. |
| Tyramide Signal Amplification (TSA) Kits (Cy3, Cy5, FITC) | Fluorogenic tyramides. HRP catalyzes deposition, amplifying fluorescence signal ~10-20x, crucial for detecting low-abundance taxa. |
| DAPI (4',6-diamidino-2-phenylindole) | DNA counterstain. Labels all microbial and host nuclei, defining total biomass and enabling image registration. |
| Antifade Mounting Medium | Reduces photobleaching during prolonged CLSM imaging. Contains radical scavengers to preserve fluorophore integrity. |
| #1.5 High-Precision Coverslips | Optimal thickness (0.17 mm) for high-NA oil immersion objectives, minimizing spherical aberration in CLSM. |
| Image Analysis Software (e.g., FIJI, Imaris, daime) | For 3D rendering, segmentation, biovolume calculation, and quantitative spatial analysis (distances, co-localization). |
Step-by-Step Protocol: From Probe Design to 3D Visualization
This application note details the critical initial phase for employing Fluorescence In Situ Hybridization (FISH) combined with confocal laser scanning microscopy (CLSM) to visualize and quantify target microorganisms within complex 3D biofilm architectures. The specificity and signal intensity of FISH probes are paramount for generating high-fidelity, three-dimensional reconstructions, which are essential for studying biofilm heterogeneity, microbe-microbe interactions, and the efficacy of antimicrobial agents in drug development.
Probe Design Strategy
Target Selection andIn SilicoDesign
Probes are designed to target the 16S or 23S rRNA of specific bacterial species, genera, or phylogenetic groups. The process leverages public databases.
Key Steps:
- Sequence Retrieval: Obtain target and non-target rRNA sequences from curated databases (e.g., SILVA, RDP, Greengenes).
- Probe Candidate Identification: Use software like ARB, probeBase, or Primer3 to identify ~15-25 nucleotide regions with high target specificity.
- In Silico Specificity Check: Perform BLASTn against a non-redundant rRNA database to ensure minimal off-target binding. A mismatch in the central region is preferred for destabilizing non-specific binding.
Table 1: Quantitative Parameters for In Silico Probe Design
| Parameter | Optimal Range | Rationale |
|---|---|---|
| Length | 15-25 nucleotides | Balances specificity and permeability. |
| GC Content | 45-60% | Ensures appropriate melting temperature (Tm). |
| Melting Temperature (Tm) | 50-65°C | Must be compatible with hybridization conditions. |
| ΔG (Gibbs Free Energy) | > -36 kcal/mol | Prevents stable secondary structure in probe. |
| Target Accessibility | Check via probeCheck or similar | Predicts binding to rRNA secondary structure. |
Probe Labeling and Fluorophore Selection
For CLSM imaging, fluorophores must be matched to the microscope's laser lines and detectors. Multiple probes can be used for multiplex imaging.
Table 2: Common Fluorophores for FISH-CLSM
| Fluorophore | Excitation Max (nm) | Emission Max (nm) | Compatible Laser (nm) | Notes |
|---|---|---|---|---|
| FITC | 490 | 525 | Argon (488) | Bright, but can photobleach. |
| Cy3 | 550 | 570 | HeNe (543/561) | Very bright and photostable. |
| Cy5 | 650 | 670 | HeNe (633) | Good for multiplexing, avoid ambient light. |
| FLUOS | 495 | 520 | Argon (488) | Alternative to FITC. |
| Texas Red | 589 | 615 | HeNe (543/561) | Good for multiplexing with Cy3. |
Experimental Protocols for Probe Validation
Protocol:In VitroSpecificity Testing using Dot Blot Hybridization
This protocol validates probe specificity against pure cultured genomic DNA before use on environmental samples.
Materials:
- Target and non-target genomic DNA.
- Nylon membrane (positively charged).
- DIG-High Prime DNA Labeling and Detection Starter Kit II (Roche).
- Candidate oligonucleotide probes.
- Standard saline citrate (SSC) buffers, SDS.
Methodology:
- DNA Immobilization: Spot 100-200 ng of heat-denatured genomic DNA from target and non-target strains onto a nylon membrane. Air dry and UV-crosslink.
- Pre-hybridization: Pre-wet membrane in 2x SSC. Incubate in pre-hybridization buffer (5x SSC, 0.1% SDS, 0.02% SDS, 1% Blocking Reagent) at the calculated hybridization temperature (Th) for 1 hour. Th = Tm - (10-15°C) for formamide-free buffers.
- Hybridization: Add digoxigenin (DIG)-labeled oligonucleotide probe (final conc. 5-10 ng/µL) to fresh pre-hybridization buffer. Hybridize membrane overnight at Th.
- Stringency Washes: Wash membrane twice in pre-warmed wash buffer (e.g., 5x SSC, 0.1% SDS) at Th for 15 min each.
- Detection: Perform chemiluminescent detection per DIG kit instructions (anti-DIG-AP antibody incubation followed by CSPD substrate exposure to X-ray film).
- Analysis: Signal should be present only for target DNA spots.
Protocol:In SituHybridization and CLSM Validation on Biofilms
This protocol validates probe performance in the context of a biofilm matrix.
Materials:
- Biofilm samples (e.g., grown on coverslips or flow cells).
- Paraformaldehyde (PFA) fixative (4% in PBS).
- Ethanol series (50%, 80%, 96%).
- Hybridization buffer (0.9 M NaCl, 20 mM Tris/HCl pH 7.4, 0.01% SDS, Formamide concentration as required).
- Fluorescently labeled oligonucleotide probe.
- Washing buffer (NaCl concentration matched to formamide %).
- DAPI or other counterstains.
- Antifading mounting medium.
- CLSM with appropriate lasers and filters.
Methodology:
- Fixation: Fix biofilm in 4% PFA for 2-4 hours at 4°C. Wash in PBS.
- Dehydration: Immerse samples in an ethanol series (50%, 80%, 96%) for 3 min each. Air dry.
- Hybridization: Apply hybridization buffer containing 5-10 ng/µL of probe to the sample. Incubate in a dark, humid chamber at 46°C for 1.5-3 hours.
- Stringency Wash: Immerse sample in pre-warmed washing buffer at 48°C for 15-20 minutes.
- Rinse & Counterstain: Briefly rinse with ice-cold dH₂O. Optional: stain with DAPI (1 µg/mL for 5 min) for total cells.
- Mounting: Mount sample in antifading medium.
- CLSM Imaging: Image immediately. Acquire z-stacks with appropriate step-sizes (e.g., 0.5 µm) for 3D reconstruction. Use sequential scanning mode for multiplex FISH to minimize bleed-through.
Table 3: Formamide Concentration and Stringency Control
| Desired Stringency | Formamide % in Hybridization Buffer | Corresponding NaCl in Wash Buffer |
|---|---|---|
| Low | 0% | 900 mM (0.9 M) |
| Medium | 20-35% | 80-225 mM |
| High | 40-50% | 56-80 mM |
Visualization: Workflows and Relationships
Title: Probe Design and Validation Workflow for FISH
The Scientist's Toolkit: Research Reagent Solutions
Table 4: Essential Materials for Probe Validation
| Item | Function & Rationale |
|---|---|
| DIG-High Prime DNA Labeling Kit | For non-radioactive labeling of PCR products or oligonucleotides for dot blot validation. Provides high sensitivity. |
| Nylon Membrane (Positively Charged) | For immobilizing DNA in dot blot assays. The positive charge ensures efficient binding of negatively charged nucleic acids. |
| Formamide (Molecular Biology Grade) | A denaturing agent added to hybridization buffer to lower the effective melting temperature, allowing for precise stringency control. |
| Standard Saline Citrate (SSC) Buffer | Provides ionic strength and pH control during hybridization and washing steps. Concentration is critical for stringency. |
| Paraformaldehyde (PFA), 4% in PBS | A cross-linking fixative that preserves biofilm architecture and cellular morphology while retaining rRNA for FISH. |
| Ethanol (Series: 50%, 80%, 96%) | Dehydrates fixed samples, aiding in cell permeabilization and preservation prior to hybridization. |
| Antifading Mounting Medium (e.g., Vectashield) | Reduces photobleaching of fluorophores during CLSM imaging, crucial for capturing multi-plane z-stacks. |
| DAPI Stain | Counterstain that binds to DNA, allowing visualization of all nucleated cells (total biomass) in the sample. |
| Hybridization Oven/Chamber | Provides precise, consistent temperature control during the overnight hybridization step. |
Application Notes
The transition from Phase 1 (sample collection) to Phase 2 is critical for preserving the native 3D architecture and biochemical composition of biofilms for subsequent FISH and confocal microscopy analysis. This phase focuses on immobilizing the biofilm structure, maintaining nucleic acid integrity for hybridization, and allowing probe penetration, all while minimizing artifacts that distort spatial relationships.
The primary challenge lies in balancing fixation strength with permeabilization efficiency. Over-fixation can create excessive cross-linking that hinders probe penetration, while under-fixation leads to cell loss and structural collapse. Recent studies emphasize that the optimal protocol is highly dependent on the biofilm composition (e.g., polysaccharide matrix density, Gram-status of constituent bacteria).
Table 1: Comparison of Common Fixation Agents for Biofilm FISH
| Fixative | Concentration | Fixation Time (min) | Key Advantage | Key Disadvantage | Best For |
|---|---|---|---|---|---|
| Paraformaldehyde (PFA) | 4% (v/v) | 30 - 120 | Excellent morphological preservation; good for Gram- bacteria | Can reduce FISH signal if over-fixed; poor for thick EPS | General use, low-EPS biofilms |
| Ethanol (EtOH) | 50-96% (v/v) | 10 - 30 | Good permeabilization; preserves nucleic acids well | Can cause shrinkage; may disrupt 3D structure | Biofilms with high Gram+ content |
| Glutaraldehyde (GA) | 0.5-2% (v/v) | 10 - 30 | Superior cross-linking for dense EPS | Strongly inhibits probe penetration; requires optimization | Dense, polysaccharide-rich biofilms |
| PFA-EtOH Mix | 4% PFA + 50% EtOH | 30 (PFA) then 10 (EtOH) | Balanced preservation & permeabilization | Two-step process more complex | Mixed-community biofilms |
Table 2: Permeabilization Methods and Efficacy
| Agent/Enzyme | Concentration | Incubation Time (min) | Temperature (°C) | Target/Function | Signal Increase vs. Control* |
|---|---|---|---|---|---|
| Lysozyme | 10 mg/mL | 30 - 60 | 37 | Peptidoglycan (Gram+ bacteria) | 30-50% |
| Proteinase K | 5-50 µg/mL | 5 - 15 | 37 | General proteins in EPS & membranes | 20-40% |
| Achromopeptidase | 10 U/mL | 30 | 37 | Peptidoglycan (Staphylococci, robust) | 40-60% |
| Triton X-100 | 0.1% (v/v) | 5 | RT | Lipid membranes (mild detergent) | 10-25% |
| HCl | 0.1M | 10 | RT | General permeabilization | 15-30% |
| No treatment control signal set to 0% increase. Data represents typical ranges from recent literature. |
Detailed Experimental Protocols
Protocol 1: Standard Fixation for Multi-Species Biofilms (PFA-Based)
This protocol is designed for general use with environmental or medical biofilms containing mixed bacterial populations.
- Fixation: Carefully aspirate growth medium from the biofilm (grown on a coverslip or flow cell). Immediately overlay the sample with 4% (v/v) phosphate-buffered paraformaldehyde (PFA). Ensure the biofilm is fully immersed.
- Incubation: Fix at room temperature for 1 hour. For more delicate structures, fix at 4°C for 2-3 hours.
- Rinsing: Gently remove fixative and wash the biofilm three times with 1x PBS (pH 7.4). Each wash should last 5 minutes with gentle agitation.
- Dehydration (Optional but Recommended): Immerse the sample in a graded ethanol series (50%, 80%, 96% v/v ethanol in nuclease-free water) for 3 minutes each. This step further permeabilizes cells and helps preserve the sample for long-term storage at -20°C.
- Storage: Store the fixed biofilm sample in 96% ethanol at -20°C until FISH processing.
Protocol 2: Enhanced Permeabilization for Gram-Positive Rich Biofilms
This protocol is essential for biofilms dominated by Gram-positive bacteria (e.g., Staphylococcus, Streptococcus) or those with exceptionally dense extracellular polymeric substance (EPS).
- Primary Fixation: Fix the sample with 4% PFA as described in Protocol 1, Steps 1-3.
- Enzymatic Permeabilization: Prepare a solution of lysozyme (10 mg/mL) in 0.1M Tris-HCl, 0.05M EDTA (pH 8.0). Apply this solution to cover the biofilm.
- Incubation: Incubate at 37°C for 30-60 minutes in a humidified chamber to prevent drying.
- Rinsing and Post-Fixation: Carefully wash the sample twice with nuclease-free water. Apply a second, brief fixation with 4% PFA for 5 minutes at room temperature to re-stabilize any structures loosened by the enzyme.
- Final Rinse: Wash thoroughly with 1x PBS before proceeding to FISH hybridization.
Protocol 3: Critical Point Drying (CPD) for High-Resolution 3D Imaging
CPD is used to prepare samples for high-resolution structural analysis (e.g., SEM, or confocal microscopy where complete dehydration is required) by avoiding the collapse caused by air-drying.
- Primary Fixation & Dehydration: Fix the biofilm with 2.5% glutaraldehyde in PBS for 2 hours at 4°C. Rinse with PBS. Dehydrate the sample through a graded ethanol series (30%, 50%, 70%, 90%, 100%, 100%) for 10 minutes each.
- Transition Fluid: Transfer the sample from 100% ethanol to a transition fluid, typically liquid CO₂, in the CPD apparatus chamber.
- Critical Point Drying: Seal the chamber and slowly raise the temperature above the critical point of CO₂ (31°C, 73.8 bar). The liquid CO₂ becomes a supercritical fluid with no surface tension.
- Ventilation: Slowly release the supercritical CO₂ as a gas. The dried biofilm retains its original 3D architecture.
- Note: CPD samples are extremely delicate and must be handled with care. They are now ready for mounting and imaging.
Visualization
Diagram 1: Phase 2 Workflow for Biofilm FISH
Diagram 2: Fixation & Permeabilization Mechanism
The Scientist's Toolkit
Table 3: Essential Research Reagent Solutions for Biofilm Fixation & Permeabilization
| Item | Function & Rationale |
|---|---|
| Paraformaldehyde (4%, buffered) | The gold-standard fixative. Creates reversible cross-links between proteins, preserving morphology while maintaining some permeability for FISH probes. Must be freshly prepared or aliquoted and stored at -20°C. |
| Glutaraldehyde (2-4% in PBS) | A stronger, irreversible cross-linker. Used for dense biofilms or when ultimate structural preservation for EM is needed. Often requires harsher permeabilization post-fixation for FISH. |
| Ethanol (Molecular Biology Grade, 96%) | Used for dehydration, storage, and as a standalone fixative/permeabilizer. Precipitates cellular components and is particularly effective for permeabilizing Gram-positive cell walls. |
| Lysozyme (from chicken egg white) | Enzyme that hydrolyzes β-1,4-glycosidic bonds in peptidoglycan. Essential for permeabilizing the thick cell walls of Gram-positive bacteria within a biofilm. |
| Proteinase K (Recombinant, PCR Grade) | A broad-spectrum serine protease. Used to digest proteins in the EPS and outer membranes, improving probe access, but requires careful optimization to avoid destroying the sample. |
| Phosphate-Buffered Saline (PBS, 10x) | Isotonic, pH-stabilized washing buffer. Used to rinse away culture media, fixatives, and enzymes without causing osmotic shock to cells within the biofilm matrix. |
| Tris-EDTA (TE) Buffer (pH 8.0) | Common buffer for enzymatic treatments (e.g., lysozyme). The EDTA chelates divalent cations, weakening the cell wall structure and enhancing enzyme activity. |
| Critical Point Dryer (CPD) Apparatus | Instrument that uses supercritical CO₂ to dry samples without surface tension-induced collapse. Critical for preserving the 3D architecture of delicate biofilms for high-resolution imaging. |
Within the broader thesis on utilizing Fluorescence In Situ Hybridization (FISH) combined with confocal laser scanning microscopy (CLSM) for the three-dimensional imaging of complex biofilms, Phase 3 is critical. This phase determines the specificity and signal intensity of the final image. Optimal hybridization ensures efficient probe binding to target rRNA, while stringent post-hybridization washes remove nonspecifically bound probes, reducing background fluorescence. This application note details protocols and optimization strategies for this decisive phase, enabling high-resolution, multi-channel 3D reconstructions of polymicrobial communities for research and antimicrobial drug development.
Key Parameters for Optimization
The balance between hybridization efficiency and specificity is governed by several interdependent factors. The following table summarizes the core quantitative parameters for optimization.
Table 1: Key Optimization Parameters for FISH Hybridization and Washes
| Parameter | Typical Range for Biofilm FISH | Impact on Result | Optimization Goal |
|---|---|---|---|
| Formamide Concentration | 0-50% (v/v) in buffer | Denatures rRNA structure; lowers effective hybridization temperature. Higher % increases stringency. | Titrate to achieve probe-specific dissociation temperature (Td). |
| Hybridization Temperature | 35-50°C | Specificity increases with temperature. | Use formula: Thyb = Tm - (15-23°C). For formamide: Thyb = 46.3 + 0.41(%GC) - (500/L) - 0.61(% formamide). |
| Hybridization Time | 1.5 - 3 hours | Longer times increase signal but risk increased non-specific binding. | 2 hours is often sufficient for biofilm samples. Overnight hybridization can be used for low-abundance targets. |
| NaCl Concentration in Wash Buffer | 56-900 mM | Lower salt increases stringency. | Start with 80 mM NaCl for most probes (EUB338 mix). Adjust based on formamide concentration used. |
| Wash Temperature | 37-50°C | Must be ≤ hybridization temperature. Critical for stringency. | Calculate: Twash = Thyb + 0-5°C for same-stringency wash. For higher stringency: Twash = Thyb + 5-10°C. |
| Wash Duration | 10-30 minutes | Must be sufficient to remove unbound probe. | A minimum of 15 minutes is recommended. |
Detailed Experimental Protocols
Protocol 1: Standard Hybridization for Biofilm FISH
This protocol follows a fixed formamide concentration approach for well-characterized probes.
Materials:
- Hybridization buffer: 0.9 M NaCl, 20 mM Tris/HCl (pH 7.2), 0.01% SDS, variable % formamide (see Table 1).
- Fluorescently labeled oligonucleotide probes (e.g., EUB338, specific taxonomic probes).
- Humidified hybridization chamber (e.g., 50 mL Falcon tube with paper towel soaked in hybridization buffer).
- Hybridization oven or accurate heating block.
Procedure:
- Preparation: For each biofilm sample (on a microscope slide or in a μ-Slide), prepare 30-100 μL of hybridization buffer containing 2-10 ng/μL of each fluorescent probe.
- Application: Carefully apply the hybridization buffer to the sample, ensuring the biofilm is completely covered. Seal with a coverslip to prevent evaporation.
- Incubation: Place the sample in a pre-warmed, humidified chamber. Incubate in the dark at the determined optimal temperature (e.g., 46°C for EUB338 with 35% formamide) for 2 hours.
Protocol 2: Graded Stringency Wash
This wash protocol removes nonspecifically bound probes while retaining specific hybrids.
Materials:
- Pre-warmed Wash buffer: 20 mM Tris/HCl (pH 7.2), X mM NaCl (see Table 1), 0.01% SDS, 5 mM EDTA.
- Water bath or heating block set to wash temperature.
- Coplin jars or staining dishes.
Procedure:
- Coverslip Removal: Gently submerge the slide in a Coplin jar containing ~50 mL of wash buffer at room temperature to float off the coverslip. Do not peel.
- Stringency Wash: Immediately transfer the sample to a second Coplin jar containing pre-warmed wash buffer (e.g., 48°C). Incubate for 15-20 minutes in the dark.
- Rinse: Briefly rinse the sample in a jar with ice-cold, nuclease-free water or a low-salt buffer to stop the wash process and remove residual salts/SDS.
- Drying & Mounting: Gently dry the back and edges of the slide with a lint-free tissue. Apply appropriate antifade mounting medium and a clean coverslip. Proceed to CLSM imaging.
Protocol 3: Empirical Formamide Series for Probe Validation
For new probes or unknown samples, a formamide gradient is essential to determine optimal stringency.
Procedure:
- Prepare identical biofilm samples across multiple slides or chambers.
- Prepare hybridization buffers with formamide concentrations in 5% or 10% increments (e.g., 0%, 10%, 20%, 30%, 40%).
- Hybridize all samples with the same probe concentration and time, but in their respective buffers, at a fixed temperature (e.g., 46°C).
- Perform a standard stringent wash (using a buffer NaCl concentration appropriate for the mid-range formamide) at a consistent temperature for all samples.
- Image all samples under identical CLSM settings. Plot signal-to-noise ratio vs. formamide concentration to identify the optimal "window" for specific binding.
Visualizing the Optimization Workflow
FISH Phase 3 Optimization Decision Pathway
The Scientist's Toolkit: Research Reagent Solutions
Table 2: Essential Materials for Hybridization & Stringency Washes
| Item | Function & Importance in Biofilm FISH | Example/Note |
|---|---|---|
| Formamide (Molecular Biology Grade) | Denaturant that lowers the effective melting temperature (Tm) of DNA-RNA hybrids, allowing for lower, sample-friendly hybridization temperatures while maintaining specificity. | Use high-purity, deionized formamide. Aliquot and store at -20°C. Concentration is the primary stringency lever. |
| Stringent Wash Buffer Components (NaCl, Tris, SDS, EDTA) | Creates the ionic and detergent environment for selective dissociation of mismatched probes. Lower [NaCl] increases stringency. SDS prevents non-specific adsorption. | Always pre-warm to exact temperature. Consistency between batches is key for reproducible results. |
| Fluorophore-Labeled Oligonucleotide Probes | Target-specific rRNA sequences. Multiple fluorophores (e.g., Cy3, Cy5, FLUOS) enable multiplexing. Critical for 3D community structure analysis. | Design using ARB/SILVA databases. Check specificity. Protect from light. Aliquot to avoid freeze-thaw cycles. |
| Humidified Hybridization Chamber | Prevents evaporation of the small hybridization buffer volume over long incubation times, which would alter salt and formamide concentrations. | A 50 mL tube with wet tissue works. Commercial chambers ensure even temperature. |
| Precision Heating Blocks/Ovens | Provides stable, accurate temperature control (±0.5°C) for both hybridization and wash steps. Temperature is a critical variable. | Dry bath heaters with slide attachments or hybridizer instruments are ideal. |
| Antifade Mounting Medium | Preserves fluorescence signal during prolonged CLSM scanning by reducing photobleaching. Essential for 3D z-stack acquisition. | Use medium with DAPI if counterstaining is needed (e.g., VECTASHIELD, ProLong Diamond). |
Within the context of a thesis on fluorescence in situ hybridization (FISH) combined with confocal microscopy for 3D biofilm imaging, precise optical configuration is paramount. This phase details the critical setup parameters for acquiring high-fidelity, multicolor volumetric data, enabling the spatial mapping of microbial community structure and gene expression. Optimal laser and filter selection minimizes cross-talk and maximizes signal-to-noise ratio in complex samples.
Laser Line Selection for Common FISH Fluorophores
The choice of laser excitation lines must align with the absorption maxima of fluorophores conjugated to oligonucleotide probes. Modern confocal systems offer discrete laser lines; selection is based on efficiency and the need to minimize simultaneous excitation of multiple dyes.
Table 1: Common FISH Fluorophores and Recommended Laser Lines
| Fluorophore | Max Absorption (nm) | Recommended Laser Line (nm) | Common Application in Biofilm FISH |
|---|---|---|---|
| DAPI | 358 | 405 | General nucleic acid staining |
| Alexa Fluor 488 | 495 | 488 | 16S rRNA targeting (EUB mix) |
| Cy3 | 554 | 561 | Specific phylogenetic probes |
| Texas Red | 595 | 594 | Specific phylogenetic probes |
| Alexa Fluor 647 | 650 | 640 or 633 | Low-autofluorescence imaging |
| FITC | 495 | 488 | Alternative to Alexa 488 |
Filter Configuration and Spectral Detection
Dichroic mirrors (beamsplitters) and emission filters are selected to direct specific wavelength ranges to designated detectors while blocking laser reflection and autofluorescence. For multicolor FISH, sequential scanning is preferred over simultaneous to eliminate bleed-through.
Protocol 2.1: Setting Up Sequential Acquisition for 3-Color FISH
Objective: To acquire separate channel images for DAPI, Cy3, and Alexa Fluor 647 with zero cross-talk.
- Microscope System: Turn on the confocal system (e.g., Zeiss LSM 880, Leica SP8) and allow lasers to stabilize for 30 minutes.
- Load Sample: Place the hybridized and washed biofilm sample on the stage.
- Define Tracks: In the acquisition software, configure three separate "tracks" for sequential scanning.
- Track 1: Activate the 405 nm laser (1-2% power). Set the main beamsplitter to 405/488/561/640. Assign an emission bandpass filter of 410-480 nm to Detector 1 (e.g., PMT). This captures DAPI.
- Track 2: Activate the 561 nm laser (2-3% power). Use the same main beamsplitter. Assign an emission bandpass filter of 570-620 nm to Detector 2. This captures Cy3.
- Track 3: Activate the 633 nm laser (2-4% power). Use the same main beamsplitter. Assign a long-pass filter (e.g., >650 nm) to Detector 3. This captures Alexa Fluor 647.
- Pinhole Alignment: Set the pinhole diameter to 1 Airy Unit (AU) for the longest wavelength channel (Alexa Fluor 647) to ensure optical section thickness is matched across channels.
- Scan Sequence: Set the order to Track 1 -> Track 2 -> Track 3. Verify that only one laser is active per frame.
Detector Settings and Signal Optimization
Photomultiplier tube (PMT) gain and offset must be adjusted to utilize the full dynamic range of the detector without saturating pixels or introducing noise.
Protocol 3.1: Optimizing PMT Gain and Offset for Hyphal Biofilm Structures
Objective: To obtain clear signal from interior cells while avoiding saturation on dense surface clusters.
- Initial Setup: With your tracks configured, set all PMT gains to 700 and offsets to 0.
- Find Focal Plane: Navigate to a representative, signal-dense region of the biofilm.
- Adjust Gain (High Signal):
- For each channel, slowly increase the gain until the brightest pixels just begin to appear saturated (use the software's "range indicator" or histogram display).
- Note this value (e.g., GAIN_max).
- Adjust Offset (Low Signal):
- Navigate to a dimmer region or an area with expected background.
- Decrease the offset until the background just reaches a value of 0 (or 1-2 on a 0-255 scale). This removes electrical noise.
- Set Final Gain: Reduce the GAIN_max value by 5-10% to provide headroom and prevent saturation during the full Z-stack acquisition.
- Test Acquisition: Perform a quick Z-stack (3-5 slices) through a heterogeneous region to ensure settings are appropriate throughout the sample volume.
Table 2: Typical Detector Settings for Biofilm FISH (Example)
| Parameter | DAPI Channel | Cy3 Channel | Alexa Fluor 647 Channel |
|---|---|---|---|
| Laser Power (%) | 1.5 | 2.5 | 3.0 |
| Digital Gain | 1.0 | 1.0 | 1.0 |
| PMT Gain (Range) | 680-720 | 650-700 | 750-800 |
| PMT Offset | -0.1 to 0 | -0.1 to 0 | -0.1 to 0 |
| Pinhole (AU) | 1.0 (matched) | 1.0 (matched) | 1.0 |
| Scan Speed | 7 (1.0 µs/pixel) | 7 | 7 |
| Averaging | Line 4x | Line 4x | Line 4x |
Logical Workflow for 3D Acquisition Setup
Title: Workflow for Confocal 3D FISH Acquisition Setup
The Scientist's Toolkit: Key Research Reagent Solutions
Table 3: Essential Materials for FISH-Confocal of Biofilms
| Item | Function/Benefit | Example Product/Type |
|---|---|---|
| Formamide (Molecular Grade) | Component of hybridization buffer; lowers melting temperature for stringent probe binding. | ThermoFisher, 100% Deionized |
| Oligonucleotide Probes (with 5' fluorophore) | Target-specific rRNA sequences for phylogenetic identification. | Metabion, Sigma, or IDT |
| Hybridization Buffer (with dextran sulfate) | Creates a viscous environment to enhance probe-target annealing. | Self-prepared per protocol or commercial kits. |
| Mounting Medium (Anti-fade) | Preserves fluorescence and reduces photobleaching during 3D scanning. | Vectashield with DAPI, ProLong Diamond |
| Confocal Dish (Glass Bottom) | Provides optimal optical clarity for high-resolution immersion lens imaging. | MatTek P35G-1.5-14-C |
| Immersion Oil (Type F/FF) | Matches refractive index of lens/glass/sample for minimal spherical aberration in Z-stacks. | Zeiss Immersol 518F, Nikon Type NF |
| Nail Polish (Clear) | Seals coverslips to prevent drying and movement during long acquisitions. | Generic, non-fluorescent |
| Microbial Positive Control Slides | Validates FISH protocol and microscope setup prior to precious samples. | e.g., E. coli and P. aeruginosa mixed smear |
Within the broader thesis investigating the spatial organization and gene expression dynamics of polymicrobial biofilms using Fluorescence In Situ Hybridization (FISH) combined with confocal laser scanning microscopy (CLSM), Phase 5 is critical for generating high-fidelity three-dimensional datasets. Optimal image acquisition parameters directly determine the resolution, signal-to-noise ratio, and validity of subsequent quantitative 3D analysis. This Application Note details protocols for Z-stacking, achieving optimal resolution, and implementing strategies to mitigate photobleaching, a significant challenge in volumetric imaging of delicate FISH-labeled samples.
Core Principles and Quantitative Parameters
Z-Stacking: Sampling for 3D Reconstruction
A Z-stack is a series of 2D optical sections (XY planes) captured at successive focal depths (Z-steps). Proper sampling along the Z-axis is governed by the Nyquist-Shannon theorem to avoid aliasing and loss of information.
Table 1: Key Parameters for Z-Stack Acquisition
| Parameter | Definition & Calculation | Recommended Value for FISH in Biofilms | Rationale |
|---|---|---|---|
| Axial (Z) Resolution | Minimum distance along Z-axis at which two points can be distinguished. ~ (λ * η) / (NA²) + (η * λ) / (M * NA) | ~0.8 - 1.5 µm (with 63x/1.4 NA oil objective) | Defines optical section thickness. |
| Optimal Z-step Size | Distance between successive optical sections. | ≤ ½ of axial resolution (Nyquist). Typically 0.3 - 0.6 µm. | Ensures sufficient sampling to reconstruct 3D structures without information loss. |
| Total Z-Range | Total depth imaged. | Defined by biofilm thickness + margin (e.g., 20-50 µm). | Must encompass entire region of interest. |
| Pinhole Diameter | Controls optical section thickness and detected light. | Set to 1 Airy Unit (AU) for optimal XY/Z resolution balance. | Increasing pinhole >1 AU increases signal but degrades Z-resolution. |
Spatial Resolution and Signal-to-Noise Ratio (SNR)
Lateral (XY) resolution is primarily determined by numerical aperture (NA) and excitation wavelength (λ): Resolution_XY ≈ 0.61 * λ / NA. For a 488 nm laser and a 1.4 NA objective, theoretical XY resolution is ~212 nm. Practically, SNR is enhanced by averaging.
Table 2: Image Acquisition Parameters Impacting SNR and Photobleaching
| Parameter | Impact on Signal | Impact on Noise | Impact on Photobleaching | Recommendation for FISH |
|---|---|---|---|---|
| Laser Power (%) | Linear increase. | Minimal direct impact. | Exponential increase. | Use minimum power to achieve sufficient SNR (often 1-10%). |
| Detector Gain | Amplifies both signal and noise. | Increases linearly. | No direct impact. | Set after optimizing laser/pinhole; keep as low as possible. |
| Digital Offset | Adds constant value to all pixels. | Can reveal noise floor. | No impact. | Adjust to just above background. |
| Pixel Dwell Time | Linear increase per pixel. | Reduces temporal noise. | Linear increase. | Balance between speed and signal (1.2-3.2 µs typical). |
| Frame Averaging (n) | Increases by √n. | Reduces by √n. | Increases total dose. | Use (2-4x) to improve SNR if needed. |
| Scan Speed | Faster = less signal per pixel. | Can increase noise. | Reduces exposure. | Use slower speeds for dim FISH signals. |
Photobleaching Kinetics and Mitigation
Photobleaching is the irreversible destruction of fluorophores, compromising signal integrity, especially in Z-stacks where interior sections receive cumulative dose. The fluorescence decay often follows a double-exponential model: I(t) = I₀ * (A₁ * exp(-t/τ₁) + A₂ * exp(-t/τ₂)).
Table 3: Photobleaching Mitigation Strategies and Efficacy
| Strategy | Mechanism | Typical Efficacy (Signal Preservation) | Practical Implementation |
|---|---|---|---|
| Antifade Mounting Media | Scavenge free radicals/oxygen (e.g., Vectashield, ProLong). | High (2-10x lifespan). | Essential for FISH. Use post-hybridization. |
| Reduced Laser Power | Lower excitation photon flux. | Very High (Non-linear benefit). | Prioritize over gain increase. |
| Optimal Z-step / Pinhole | Minimize number of sections & exposure. | High. | Follow Nyquist; do not oversample. |
| Sequential Line Scanning | Prevent cross-talk/bleed-through. | Medium for multicolor samples. | Acquire channels sequentially, not simultaneously. |
| Use of Resonant Scanner | Extremely high scan speeds. | High (reduced dwell time). | For live or very sensitive imaging. |
Detailed Protocols
Protocol 3.1: Calibrating and Acquiring a Nyquist-Sampled Z-Stack
Objective: To acquire a 3D image stack suitable for quantitative analysis of FISH-labeled biofilm architecture. Materials: CLSM system, FISH-labeled biofilm sample, immersion oil, antifade mounting medium. Procedure:
- System Setup: Turn on laser sources, CLSM, and computer. Allow lasers to stabilize (15 min).
- Sample Placement: Apply immersion oil to the objective (63x/1.4 NA oil). Place sample slide. Locate the biofilm region of interest (ROI) using low-intensity transmitted light or a low laser power epifluorescence preview.
- Define Z-Stack Limits: a. Using the fine focus, move to the top of the biofilm (first visible signal). Click "Set First" in the Z-stack software. b. Move to the bottom of the biofilm (last visible signal). Click "Set Last."
- Calculate Optimal Z-step: a. Use software calculators (e.g., Zeiss ZEN Nyquist, Leica LAS X) or calculate manually: Z-step = (0.5 * λ_em) / (η * (NA²)), where λem is emission wavelength, η is refractive index of immersion medium (1.518 for oil). For Cy3 (λem ~570 nm), Z-step ≈ 0.34 µm. b. Enter calculated Z-step size into the acquisition software.
- Set Acquisition Parameters (Prioritizing Low Photobleaching): a. Set pinhole to 1 AU. b. For the dimmest FISH channel, start with low laser power (2%), medium gain (700-800), and medium scan speed (400 Hz). c. Adjust laser power upward incrementally until a satisfactory SNR is achieved. Avoid increasing gain above 900. d. Apply the same process to brighter channels, using even lower laser power. e. Set sequential channel scanning to minimize cross-talk.
- Acquisition: Start the Z-stack acquisition. Verify during acquisition that signal remains stable at the bottom of the stack.
Protocol 3.2: Photobleaching Quantification and Compensation Protocol
Objective: To measure the photobleaching rate of a specific FISH probe under your acquisition settings and adjust parameters. Materials: Homogeneous control sample (e.g., bacterial smear hybridized with a single FISH probe). Procedure:
- Acquire Time-Series: On the control sample, select a single XY plane. Set up a time-series acquisition with your standard Z-stack parameters (laser power, gain) but without Z-movement. Acquire 50-100 frames at intervals matching your per-slice acquisition time.
- Measure Intensity Decay: Use image analysis software (e.g., ImageJ/Fiji) to measure the mean fluorescence intensity within a constant ROI over all frames.
- Fit Decay Curve: Export data and fit to a single or double exponential decay model using graphing software (e.g., Prism, Excel). Determine the time constant (τ) for fluorescence decay.
- Parameter Adjustment: If the intensity decays by >20% over the time it takes to acquire your typical Z-stack, mitigation is required. Return to Protocol 3.1 and: a. Reduce laser power further, compensating with 2x frame averaging if necessary. b. Ensure antifade mounting medium is fresh. c. Consider using a higher-efficiency probe (e.g., brighter fluorophore like Cy5).
The Scientist's Toolkit: Research Reagent Solutions
Table 4: Essential Materials for 3D FISH Imaging
| Item | Function & Rationale | Example Products/Brands |
|---|---|---|
| Antifade Mounting Medium | Preserves fluorescence by reducing photobleaching during imaging. Critical for long Z-stack acquisition. | ProLong Diamond, Vectashield, SlowFade Gold |
| High-NA Immersion Oil | Matches refractive index of lens and cover glass to maximize resolution and light collection. Must be non-fluorescent. | Zeiss Immersol 518F, Leica Type F, Cargille Type 37 |
| #1.5 High-Precision Cover Slips | Optimal thickness (0.17 mm) for high-NA objectives. Thickness variation degrades resolution. | Marienfeld Superior, Corning Microcover |
| FISH Probes with High-Photostability Fluorophores | Fluorophores with high quantum yield and resistance to bleaching improve SNR and allow lower laser power. | Cy5, Cy3, Alexa Fluor 647, Quasar 670 |
| Hard-Set Sealing Nail Polish | Secures cover slip and prevents oil ingress and sample drying during long imaging sessions. | Revlon ColorStay, Sally Hansen Hard as Nails |
Visualization of Workflows
Diagram 1: Workflow for Optimal Z-Stack Acquisition
Diagram 2: Photobleaching Mechanism & Antifade Action
Application Notes
This phase is critical for extracting robust, quantitative metrics from 3D biofilm datasets acquired via FISH-confocal microscopy. Moving beyond qualitative visualization, it enables hypothesis testing regarding microbial community structure, function, and response to perturbations (e.g., antimicrobial agents). Accurate 3D reconstruction forms the foundation for all subsequent analyses, converting image stacks into spatially accurate models of the biofilm. Key analyses include biovolume (measure of microbial abundance), co-localization (assessment of spatial relationships between different microbial taxa or between cells and matrix components), and distance measurements (e.g., nearest-neighbor analyses, stratification). These metrics are essential for drug development professionals assessing biofilm eradication efficacy, where reductions in biovolume or disruption of co-localized consortia are key indicators of treatment success.
Table 1: Key Quantitative Parameters for 3D Biofilm Analysis
| Parameter | Description | Typical Output | Biological/Drug Development Relevance |
|---|---|---|---|
| Total Biovolume | Volume occupied by a thresholded signal (e.g., specific probe). | µm³ | Biomass quantification; treatment efficacy (reduction). |
| Biovolume Fraction | Volume of component A relative to total biofilm volume. | % | Community composition; matrix vs. cell ratios. |
| Pearson's Correlation Coefficient (PCC) | Intensity-based pixel correlation between two channels in 3D. | -1 to +1 | Degree of molecular or taxonomic mixing/segregation. |
| Mander's Overlap Coefficients (M1 & M2) | Fraction of signal in one channel co-localizing with another. | 0 to 1 | Specific association of target A with target B. |
| Surface Distance | Distance from every pixel in object A to the nearest surface of object B. | µm (distribution) | Spatial stratification, minimum antimicrobial diffusion range. |
| Centroid-to-Centroid Distance | Distance between the geometric centers of objects. | µm | Inter-colony spacing, microcolony distribution. |
| Nearest Neighbor Distance (NND) | Distance from each object (e.g., cell) to its closest neighboring object. | µm (mean, distribution) | Cellular aggregation patterns in response to stress. |
Experimental Protocols
Protocol 1: 3D Reconstruction and Segmentation for Biovolume Analysis
Objective: To generate accurate 3D models from confocal z-stacks and calculate species-specific biovolumes.
Detailed Methodology:
- Data Pre-processing (Deconvolution): Use deconvolution software (e.g., Huygens, DeconvolutionLab2) with a measured point spread function (PSF) to reduce out-of-focus light and improve resolution. Apply consistent settings across all samples.
- Channel Alignment (if required): Correct for chromatic shift using multichannel images of sub-resolution fluorescent beads. Apply calculated correction matrix to all experimental images.
- Thresholding & Segmentation: a. Import deconvolved image stack into analysis software (e.g., Arivis Vision4D, Imaris, FIJI/ImageJ). b. For each channel (FISH probe), apply a 3D band-pass filter to reduce noise. c. Determine optimal global or local threshold (e.g., Otsu, IsoData) using a control sample. Critical: Use the same threshold method and value for all comparative samples. d. Apply the threshold to create a binary mask. Use a 3D morphological "closing" operation (e.g., 1-2 voxel diameter) to fill small gaps. e. (Optional) Separate touching objects using a watershed algorithm based on distance transform.
- Biovolume Calculation: The software calculates the voxel count within the binary mask. Multiply by voxel volume (xy pixel size² * z-step size) to obtain biovolume in µm³.
- Export Data: Export total biovolume per channel and per region of interest (ROI) for statistical analysis.
Protocol 2: 3D Co-localization Analysis
Objective: To quantify the spatial association between two differently labeled targets (e.g., two bacterial species, or bacteria and EPS).
Detailed Methodology:
- Pre-processed Image Preparation: Start with deconvolved, alignment-corrected 32-bit image stacks. Ensure no pixel saturation.
- Region of Interest (ROI) Definition: Define the biofilm volume as the ROI to exclude background. Create a mask from a combined channel or DIC signal.
- Intensity-based Co-localization (Pearson's):
a. Calculate the Pearson's Correlation Coefficient (PCC) for the entire 3D ROI using the formula:
PCC = Σ(Ch1i - Ch1mean)(Ch2i - Ch2mean) / sqrt[Σ(Ch1i - Ch1mean)² Σ(Ch2i - Ch2mean)²], whereiiterates over all voxels. b. A value >0.5 indicates strong positive correlation; ~0 indicates random distribution; <-0.5 indicates segregation. - Object-based Co-localization (Mander's Coefficients):
a. Use the binary masks generated in Protocol 1 for each channel.
b. Calculate Mander's Overlap Coefficient M1:
M1 = Σ(Ch1i_coloc) / Σ(Ch1i), whereCh1i_colocare intensities in Channel 1 where Channel 2 mask >0. c. Similarly, calculate M2. M1 = 0.9 means 90% of Channel 1 signal overlaps with Channel 2 signal. - Visualization: Generate a 3D scatterplot of voxel intensities (Ch1 vs Ch2) and render co-localized voxels in a third color in the 3D model.
Protocol 3: 3D Distance Measurements
Objective: To quantify spatial distributions and proximities within the biofilm architecture.
Detailed Methodology:
- Object Identification: Perform segmentation as in Protocol 1 to define discrete objects (e.g., bacterial microcolonies, single cells).
- Surface Distance Map: a. Using the binary mask of Object Population A, compute the Euclidean distance transform to generate a map where each voxel value is its distance to the nearest surface of A. b. Use this map to interrogate the mask of Object Population B. Extract the distance value for every voxel in B. c. Report the minimum distance from B to A, and the distance distribution.
- Nearest Neighbor Analysis (NNA): a. Calculate the centroid (geometric center) coordinates for each segmented object in a population. b. For each object, compute the 3D Euclidean distance to all other object centroids. Identify the minimum distance as its Nearest Neighbor Distance (NND). c. Calculate the population mean NND and distribution. Compare to a theoretical random distribution (e.g., via Monte Carlo simulation) to assess clustering or dispersion.
- Vertical Stratification Profile: a. Divide the 3D biofilm into horizontal bins (e.g., 1 µm thick slices from substratum to top). b. For each bin, calculate the biovolume fraction or cell count for each channel. c. Plot depth vs. abundance to visualize layering.
Visualizations
Title: 3D Biofilm Analysis Workflow
Title: Co-localization Analysis Pathways
The Scientist's Toolkit
Table 2: Essential Research Reagent Solutions & Materials
| Item | Function/Description | Example Product/Note |
|---|---|---|
| High-Resolution Confocal Microscope | Acquire optical z-sections with minimal out-of-focus light. | Zeiss LSM 980 with Airyscan 2, Nikon A1R HD, or similar. |
| Immersion Oil (Corrected) | Matches microscope objective specifications for optimal resolution and minimal spherical aberration in deep imaging. | Nikon Type NF, Zeiss Immersol 518F. Index must be specified for temperature. |
| FISH Probes (e.g., rRNA-targeted) | Specific labeling of microbial taxa in a complex community. | Custom-designed, Dye-labeled (Cy3, Cy5, FAM) oligonucleotides. |
| Mounting Medium (Anti-fade) | Preserves fluorescence signal during prolonged imaging. | ProLong Diamond, Vectashield. |
| Calibration Beads (Sub-resolution) | Measure the Point Spread Function (PSF) for deconvolution and correct for chromatic aberration. | TetraSpeck beads (0.1 µm), PS-Speck Microscope Point Source Kit. |
| Image Analysis Software | Perform 3D reconstruction, segmentation, and quantitative measurements. | Commercial: Imaris, Arivis Vision4D. Open-source: FIJI/ImageJ (with 3D Suite, BioVoxxel plugins). |
| Deconvolution Software | Computationally remove out-of-focus light from z-stacks. | Huygens Professional, SVI Huygens Core; or open-source (DeconvolutionLab2). |
| Statistical Software | Analyze and compare quantitative metrics (biovolume, distances). | GraphPad Prism, R, Python (SciPy, pandas). |
Solving Common Pitfalls and Enhancing Signal-to-Noise in FISH-Confocal
Within a thesis focused on advancing 3D biofilm imaging via FISH-confocal microscopy, a weak or absent FISH signal presents a major analytical hurdle. Biofilms, with their complex extracellular polymeric substance (EPS) matrix, present unique challenges for probe penetration and hybridization. This application note details the primary causes of signal failure—rooted in permeabilization, probe access, and hybridization efficiency—and provides optimized protocols to overcome them, ensuring reliable quantification of microbial community structure and function in 3D.
Table 1: Primary Causes of Weak/No FISH Signal in Biofilm Imaging
| Cause Category | Specific Factor | Typical Impact on Signal Intensity (Relative) | Common in Biofilms? |
|---|---|---|---|
| Permeabilization | Insufficient EPS removal | 70-90% reduction | High |
| Incomplete cell wall lysis (Gram+) | 80-95% reduction | High | |
| Over-permeabilization & cell loss | 50-100% reduction | Medium | |
| Probe Access | Probe size (>20 nt) | 40-60% reduction | Medium |
| Probe diffusion barrier (EPS) | 60-95% reduction | Very High | |
| Non-specific probe trapping | Variable quenching | High | |
| Hybridization Efficiency | Suboptimal formamide concentration | 50-80% reduction | Low |
| Incorrect hybridization temperature | 70-100% reduction | Low | |
| Low rRNA content (inactive cells) | Up to 100% reduction | High |
Table 2: Optimized Solutions & Their Efficacy
| Solution | Target Issue | Typical Signal Improvement | Key Consideration |
|---|---|---|---|
| Enzymatic EPS digestion (Proteinase K, α-amylase) | Probe Access | 200-400% | Species-specific EPS matrix |
| Combined chemical permeabilizers (Lysozyme + EDTA) | Permeabilization (Gram+) | 300-500% | Requires sequential optimization |
| Use of horseradish peroxidase (CARD-FISH) | Low rRNA / Signal Amplification | 10-20 fold | Increased background risk |
| CLASI-FISH (multiple fluorophores) | Signal-to-Noise Ratio | 5-10 fold | Complex probe design |
| Gradient Hybridization Chamber | Hybridization Efficiency | 50-150% | Precise temperature control |
Detailed Experimental Protocols
Protocol 1: Enhanced Permeabilization for Mixed-Species Biofilms
Objective: To achieve uniform cell wall permeability across Gram-positive and Gram-negative bacteria within an EPS matrix.
- Fixation: Fix biofilm samples (e.g., on coverslip) in 4% paraformaldehyde (PFA) for 2-4 hours at 4°C. Wash 3x in 1x PBS.
- EPS Dissolution: Treat with 10 µg/mL Proteinase K in TE buffer (pH 8.0) for 10 minutes at 37°C. Alternatively, use 0.5% α-amylase for polysaccharide-rich matrices.
- Sequential Permeabilization:
- Gram-negative pathway: Apply 0.5% Triton X-100 for 15 min at RT.
- Gram-positive pathway: Rinse, then apply lysozyme solution (10 mg/mL in 0.05 M EDTA, 0.1 M Tris-HCl; pH 8.0) for 60 min at 37°C.
- Dehydration: Immerse samples sequentially in 50%, 80%, and 96% ethanol (3 min each) and air dry.
Protocol 2: Optimized Hybridization for 3D Biofilm Sections
Objective: To maximize specific probe binding while minimizing non-specific background in thick samples.
- Probe & Hybridization Buffer: Dilute fluorescently-labeled oligonucleotide probe to 5 ng/µL in hybridization buffer: 0.9 M NaCl, 20 mM Tris/HCl (pH 8.0), 0.01% SDS, and variable formamide (determine optimal % via stringency test).
- Hybridization Setup: Apply buffer to sample in a sealed, humidified chamber. Use a programmable thermal cycler with a flat block for precise temperature control.
- Hybridization: Incubate at 46°C for at least 3 hours (overnight for low-abundance targets).
- Stringent Wash: Transfer sample to pre-warmed wash buffer (NaCl concentration dependent on formamide % used) at 48°C for 20-30 minutes.
- Rinse & Mount: Rinse briefly with ice-cold dH₂O, air dry, and mount with antifading agent (e.g., Vectashield with DAPI) for confocal microscopy.
Visualizing the Diagnostic & Optimization Workflow
Diagram Title: FISH Signal Failure Diagnostic & Solution Tree
The Scientist's Toolkit: Key Reagent Solutions
Table 3: Essential Reagents for Robust Biofilm FISH
| Reagent / Material | Function in Protocol | Critical Consideration for Biofilms |
|---|---|---|
| Paraformaldehyde (4%) | Cross-linking fixative preserving cell morphology and rRNA. | Over-fixation (>4h) can reduce probe access. |
| Lysozyme + EDTA Solution | Degrades peptidoglycan cell wall of Gram-positive bacteria. | Concentration and time must be titrated to avoid complete cell lysis. |
| Proteinase K | Protease that digests proteinaceous components of the EPS. | Essential for probe penetration; activity must be quenched post-treatment. |
| Formamide (Molecular Grade) | Denaturant in hybridization buffer controlling stringency. | Optimal % is probe-specific; use a gradient test to determine. |
| HRP-labeled Oligonucleotide Probes & Tyramides | For CARD-FISH signal amplification. | Endogenous peroxidases must be inactivated (H₂O₂ treatment). |
| Antifading Mounting Medium with DAPI | Preserves fluorescence and counterstains total cells. | Use low-fluorescence medium for 3D z-stack acquisition. |
| Humidified Hybridization Chamber | Prevents evaporation of hybridization buffer during incubation. | Critical for consistent results with small buffer volumes on samples. |
In 3D biofilm imaging research utilizing Fluorescence In Situ Hybridization (FISH) combined with confocal laser scanning microscopy (CLSM), high background fluorescence poses a significant challenge. This background, primarily stemming from cellular autofluorescence and non-specific binding (NSB) of probes, obscures specific signals, reduces the signal-to-noise ratio (S/N), and compromises the resolution and quantitative accuracy of 3D reconstructions. This application note details strategies and protocols to mitigate these issues, enabling clearer, more reliable imaging within the context of advanced biofilm studies.
The primary contributors to background in biofilm FISH-CLSM are summarized in the table below.
Table 1: Sources and Characteristics of Background Fluorescence in Biofilm FISH
| Source | Typical Emiss. Wavelength (nm) | Primary Contributors in Biofilms | Impact on FISH |
|---|---|---|---|
| Autofluorescence | 400-600 | Flavins (FAD, FMN), NAD(P)H, EPS glycoproteins, phenazines, carrier proteins (e.g., cytochromes). | Masks weak FISH signals, broad spectral overlap. |
| Non-Specific Binding | Depends on fluorophore | Electrostatic/hydrophobic interactions of probes with EPS, non-target cells, or substratum. | Creates false-positive signals, reduces specificity. |
| Instrument/Background | All | Detector dark noise, ambient light, substrate fluorescence (e.g., glass, plastics). | Adds uniform noise, lowers contrast. |
Quantitative studies indicate that unmitigated autofluorescence can account for 30-50% of the total detected signal in complex environmental biofilms, drastically reducing the effective sensitivity of FISH probes.
Core Mitigation Strategies and Protocols
Reducing Autofluorescence
Autofluorescence arises from endogenous molecules. Chemical reduction is a key pre-treatment.
Protocol 1.1: Chemical Reduction of Autofluorescence with Sodium Borohydride
- Objective: Reduce Schiff bases and other autofluorescent compounds formed during fixation.
- Reagents: Sodium borohydride (NaBH4) solution (1% w/v in PBS, freshly prepared and kept on ice).
- Procedure:
- Fix biofilm samples (e.g., on a coverslip or membrane filter) as per standard FISH protocol (e.g., 4% PFA, 1 hr).
- Wash 3x with 1X PBS.
- Incubate sample in ice-cold 1% NaBH4 solution for 20 minutes in the dark.
- Wash thoroughly with 1X PBS (3 x 5 minutes).
- Proceed to hybridization.
- Note: NaBH4 is unstable in aqueous solution; prepare immediately before use. This treatment can reduce autofluorescence by up to 60-70% for flavin-type fluorescence.
Protocol 1.2: Spectral Unmixing via Linear Spectral Imaging
- Objective: Digitally separate FISH signal from autofluorescence based on spectral signatures.
- Prerequisite: Confocal system equipped with a spectral detector.
- Procedure:
- Acquire a lambda stack (e.g., 5-10 nm steps) from an unstained/unhybridized biofilm region to create an autofluorescence reference spectrum.
- Perform FISH and acquire a lambda stack of the hybridized sample.
- Using software (e.g., ZEN, LAS X, ImageJ), apply linear unmixing algorithms. The software uses the reference spectra (FISH probe fluorophore and autofluorescence) to calculate the contribution of each component at every pixel.
- Generate two unmixed channels: a pure FISH signal channel and a separated autofluorescence channel.
- Outcome: Can improve S/N ratio by >3-fold, allowing for accurate quantification even in highly autofluorescent samples.
Minimizing Non-Specific Binding (NSB)
NSB is addressed by optimizing hybridization stringency and using blocking agents.
Protocol 2.1: Optimized Hybridization and Washing for Biofilm FISH
- Objective: Maximize specific probe binding while minimizing NSB through stringent conditions.
- Modified Hybridization Buffer (for challenging biofilms):
- Formamide (concentration probe-specific, e.g., 35%)
- NaCl (e.g., 0.9 M)
- Tris-HCl (20 mM, pH 7.4)
- Additives: 10% w/v Dextran sulfate (to enhance kinetics), 0.01% w/v Polyadenylic acid (to block NSB to rRNA-rich regions), 0.1% w/v Sodium pyrophosphate, 1% w/v Blocking Reagent (see Toolkit).
- Stringent Wash Buffer:
- NaCl (concentration matched to formamide in hybridization buffer via stringency tables)
- Tris-HCl (5 mM, pH 7.4)
- EDTA (0.5 - 1 mM)
- 0.01% SDS
- Procedure:
- Apply hybridization buffer containing probes to sample. Hybridize at 46°C for 2-3 hours in a dark, humid chamber.
- Critical Step: Transfer sample directly to pre-warmed (48°C) stringent wash buffer. Wash for 20-30 minutes at 48°C.
- Rinse briefly with ice-cold distilled water and air dry in the dark.
- Data: Inclusion of polyA and blocking reagent can reduce NSB by up to 40% compared to standard FISH buffers.
Protocol 2.2: Post-Hybridization Enzymatic Treatment with Lysozyme or Protease
- Objective: Degrade peptidoglycan or proteins that may trap probes non-specifically.
- Reagents: Lysozyme solution (10 mg/mL in 0.1 M Tris-HCl, 0.05 M EDTA, pH 8.0) or Proteinase K (1-5 µg/mL in 20 mM Tris-HCl, pH 7.5).
- Procedure:
- After final FISH wash, equilibrate sample in appropriate enzyme buffer for 2 minutes.
- Apply enzyme solution and incubate at 37°C for 5-15 minutes. Titrate timing for each biofilm type.
- Stop reaction by immersing in ice-cold PBS for 5 minutes.
- Rinse gently with distilled water and mount.
Workflow Diagram: Integrated Background Reduction Strategy
Integrated Background Reduction Workflow
Signaling Pathway Diagram: Quenching of Autofluorescence
Mechanism of Chemical Autofluorescence Quenching
The Scientist's Toolkit: Research Reagent Solutions
Table 2: Essential Reagents for Background Suppression in Biofilm FISH
| Reagent | Function & Rationale | Example/Concentration |
|---|---|---|
| Blocking Reagent | Blocks NSB sites in extracellular polymeric substance (EPS) and on non-target cells. | Roche Blocking Reagent (1-2% in hybridization buffer). |
| Polyadenylic Acid | Competes with NSB of rRNA-targeted probes to non-target rRNA. | 0.01-0.1% w/v in hybridization buffer. |
| Dextran Sulfate | Volume-excluding agent that increases effective probe concentration, improving hybridization kinetics. | 10% w/v in hybridization buffer. |
| Formamide | Denaturant used to control stringency; higher % increases stringency, reducing NSB. | Concentration probe-specific (0-60%). |
| Sodium Borohydride (NaBH4) | Reduces autofluorescence by converting fluorescent Schiff bases to non-fluorescent amines. | 1% w/v in PBS (fresh, ice-cold). |
| Lysozyme | Enzyme that digests peptidoglycan, releasing probes trapped in the cell wall matrix. | 10 mg/mL in Tris-EDTA buffer. |
| SYTOX Green/Blue | Counterstain for non-target cells; choose spectrally distant from FISH fluorophores. | 1-5 µM, applied post-hybridization. |
| Citifluor AF Mountant | Anti-fade mounting medium that reduces photobleaching and may contain background suppressors. | Commercial formulation (e.g., Citifluor AF1). |
Effective management of autofluorescence and NSB is not a single-step fix but an integrated process spanning sample preparation, hybridization chemistry, and image acquisition/analysis. By implementing the chemical reduction and blocking protocols outlined, and leveraging spectral imaging capabilities, researchers can significantly enhance the fidelity of FISH-based 3D biofilm imaging. This enables more accurate spatial localization, quantification, and understanding of microbial community structure and function, directly supporting advanced research in microbial ecology and antimicrobial drug development.
1. Introduction
Within the broader thesis on optimizing Fluorescence In Situ Hybridization (FISH) combined with confocal laser scanning microscopy (CLSM) for the quantitative 3D imaging of polymicrobial biofilms, preserving the native architecture is paramount. Artifacts introduced during sample handling, fixation, and processing distort spatial relationships, compromise cell viability signals, and lead to erroneous quantitative data. This document details critical artifacts and provides standardized protocols to minimize them, ensuring data fidelity for research and antimicrobial drug development.
2. Common Artifacts and Their Impact on 3D Analysis
Improper procedures can lead to structural collapse, cell loss, and non-specific signal, which are particularly detrimental to volumetric measurements and co-localization studies in CLSM.
Table 1: Common Fixation & Handling Artifacts in Biofilm Imaging
| Artifact | Primary Cause | Impact on 3D FISH-CLSM | Quantitative Manifestation |
|---|---|---|---|
| Structural Collapse | Air-drying, dehydrating with high ethanol concentrations, excessive vacuum during filtration. | Loss of extracellular polymeric substance (EPS) matrix, thinning of biofilm, false cell density readings. | Up to 60-70% reduction in measured biofilm height/biovolume. |
| Cell Detachment & Loss | Overly vigorous pipetting, shear stress during washing, abrasive fixation methods (e.g., heat). | Holes in the biofilm structure, skewed species ratios in polymicrobial analysis. | Variable cell count loss (10-50%), dependent on species and EPS strength. |
| Poor Fixation Penetration | Fixative concentration too high, causing surface protein precipitation that blocks diffusion. | Inner biofilm regions remain unfixed, leading to cell lysis and probe penetration artifacts. | Gradient of signal intensity from top to bottom of biofilm. |
| Autofluorescence | Use of aldehydes with old or impure reagents, incorrect pH of fixative, over-fixation. | High background noise, masking specific FISH signals, requiring increased laser power. | Decreased signal-to-noise ratio (SNR), complicating thresholding for segmentation. |
| Morphological Distortion | Hypotonic or hypertonic fixative buffers, rapid osmotic changes. | Swollen or shrunken cells, altered cell-cell distance measurements. | Changes in mean cell area/perimeter measurements versus live state. |
3. Core Protocols for Artifact Mitigation
Protocol 3.1: Gentle Harvesting and Primary Fixation for Architecture Preservation
Objective: To immobilize biofilm constituents while minimizing physical disruption. Materials: See "Research Reagent Solutions" (Table 2). Workflow:
- Gentle Rinsing: Carefully aspirate growth medium. Overlay biofilm with 1X PBS (pre-warmed to growth temperature) without directing stream at biofilm. Gently rock to rinse. Aspirate.
- Primary Fixation (Cross-linking): Overlay biofilm with freshly prepared, filter-sterilized 4% PFA in 1X PBS (pH 7.4). For thick biofilms (>50 µm), a 2-3% PFA solution may improve penetration.
- Incubation: Fix at 4°C for 4-16 hours. Critical: Shorter times (4-8h) often preserve structure better than overnight fixation for many bacterial biofilms.
- Post-Fixation Rinse: Remove PFA and wash 3 x 5 minutes with 1X PBS to remove residual fixative.
Protocol 3.2: Controlled Dehydration for FISH Hybridization
Objective: To prepare biofilm for hybridization while preventing structural collapse. Workflow:
- After Protocol 3.1, perform a graded ethanol series in situ.
- Carefully add 10% ethanol (in nuclease-free water) for 5 minutes.
- Sequentially increase to 30%, 50%, and 80% ethanol, incubating 5 minutes each.
- Storage Point: Biofilms can be stored in 80% ethanol at -20°C for several weeks.
- Pre-Hybridization: Before FISH, complete dehydration with 96% ethanol for 5 minutes, then air-dry briefly (1-2 minutes) in a dust-free environment. Avoid complete desiccation.
4. The Scientist's Toolkit: Research Reagent Solutions
Table 2: Essential Materials for Biofilm Integrity Preservation
| Reagent/Material | Function & Rationale | Key Consideration |
|---|---|---|
| Paraformaldehyde (PFA), 4%, pH 7.4 | Primary cross-linking fixative. Preserves 3D structure and morphology better than glutaraldehyde for FISH. | Always prepare fresh or use aliquots stored at -20°C; avoid freeze-thaw cycles to prevent formic acid formation and autofluorescence. |
| Phosphate-Buffered Saline (PBS), 1X | Isotonic rinsing and dilution buffer. Maintains osmotic balance to prevent cell shrinkage/swelling. | Check pH is 7.4; filter sterilize to avoid particulate contaminants. |
| Ethanol (Molecular Biology Grade) | Dehydrant for storage and FISH procedure. Removes water, aiding probe penetration. | Use a graded series (10%, 30%, 50%, 80%, 96%) to prevent sudden osmotic shock and collapse. |
| Nuclease-Free Water | Preparation of hybridization buffers and rinses. Prevents degradation of FISH probes and target RNA. | Essential for all steps post-fixation to maintain RNA integrity for FISH. |
| Hybridization Buffer (with Formamide) | Creates denaturing conditions for specific probe binding. Formamide concentration is probe-dependent. | Optimize formamide concentration for each probe set to balance specificity and signal strength. |
| #1.5 High-Performance Coverslips | Imaging substrate for high-resolution CLSM. Correct thickness is critical for oil-immersion objectives. | Ensure coverslips are sterile and compatible with mounting media (e.g., VECTASHIELD Antifade). |
| ProLong Glass or Similar Hard-Set Mountant | Mounting medium with high refractive index (RI ~1.52) for 3D CLSM. Minimizes RI mismatch and spherical aberration. | Hard-set mountants prevent biofilm compression under the coverslip. |
5. Visualization of Workflows and Artifact Pathways
Biofilm Fixation Workflow & Artifact Pathway
FISH-CLSM 3D Imaging Protocol Steps & Key Parameters
This application note provides a detailed protocol for optimizing key confocal laser scanning microscope (CLSM) parameters to acquire high-quality three-dimensional data, specifically within the context of fluorescence in situ hybridization (FISH) for 3D biofilm imaging. The broader thesis explores how optimized imaging reveals spatial organization and gene expression in biofilms, critical for understanding antibiotic resistance and guiding novel therapeutic development. Precise parameter control is essential to maximize resolution, signal-to-noise ratio (SNR), and volumetric accuracy while minimizing photobleaching and phototoxicity.
Core Principles of Parameter Optimization
Pinhole Size: Balancing Optical Sectioning and Signal
The pinhole is the defining feature of a confocal microscope. Its diameter, often expressed in Airy Units (AU), controls optical section thickness and out-of-focus light rejection.
- 1 AU: Theoretically ideal for maximum lateral (xy) resolution. However, for 3D imaging of thick, dim samples like FISH-labeled biofilms, it can severely limit detectable signal.
- >1 AU (e.g., 1.2 - 1.5 AU): Recommended starting point for 3D biofilm imaging. It provides a favorable compromise, accepting more signal from the plane of focus with only a modest decrease in axial (z) resolution.
- >>1 AU: Loss of confocality, resulting in degraded z-resolution and increased haze from out-of-focus light.
Table 1: Effect of Pinhole Size on Image Parameters
| Pinhole Size (AU) | Optical Section Thickness | Signal Intensity | Lateral Resolution | Axial Resolution | Recommended Use Case |
|---|---|---|---|---|---|
| 0.8 - 1.0 | Thinnest | Lowest | Best | Best | Very thin, bright samples; super-resolution techniques |
| 1.2 - 1.5 | Moderate | High | Very Good | Good | 3D FISH biofilm imaging (standard) |
| 2.0 - 3.0 | Thick | Highest | Reduced | Significantly Reduced | Very dim samples; initial sample scanning |
Gain (HV/PMT): Amplifying Signal vs. Managing Noise
Gain controls the amplification of the photomultiplier tube (PMT) signal.
- Optimal Setting: Set the gain so that the brightest pixels in your region of interest are just below saturation (e.g., at 90-95% of the detector's dynamic range, often shown as pixel intensity values of ~240-250 on an 8-bit scale of 0-255). This maximizes the use of the available bit depth without clipping signal.
- Noise Consideration: Excessive gain amplifies both signal and background noise. The optimal SNR is typically achieved before maximum gain is applied.
Digital Zoom: True Resolution vs. Empty Magnification
Digital zoom enlargs a region of the optical scan. It does not increase optical resolution but changes the sampling density (pixels per micron).
- Nyquist Sampling Criterion: To accurately represent optical resolution, the pixel size (determined by zoom, field of view, and scan resolution) must be at least 2.3-3 times smaller than the optical resolution. For a typical 63x/1.4 NA oil objective with ~140 nm lateral resolution, the pixel size should be ~60 nm.
- Protocol: Calculate required zoom based on the objective's field of view and desired final image pixel dimensions (e.g., 1024 x 1024) to meet Nyquist sampling. Avoid excessive zoom ("empty magnification") which only enlarges pixels without adding detail and increases scan time and photodamage.
Table 2: Interplay of Key Parameters for 3D FISH Biofilm Imaging
| Parameter | Primary Effect | Interaction with Other Parameters | Optimization Goal for Biofilm FISH |
|---|---|---|---|
| Pinhole (1.2 AU) | Controls optical sectioning & signal collection | Larger pinhole allows lower gain/laser power. | Balance signal yield with acceptable z-resolution. |
| Gain (PMT) | Amplifies detected signal | Increase after maximizing laser power (below sample saturation). | Set to avoid pixel saturation while minimizing noise. |
| Laser Power | Determines fluorescence excitation | Lower power requires higher gain. Higher power causes bleaching. | Start low (<5-10%), increase until signal is sufficient. |
| Digital Zoom | Sets pixel size & field of view | Higher zoom reduces pixel size, requiring more laser power/gain for same pixel intensity. | Set to achieve Nyquist sampling for the objective NA. |
| Scan Speed | Affects image quality & acquisition time | Slower speeds collect more signal per pixel, allowing lower laser/gain. | Use slower speeds for dim FISH signals; faster for overview. |
| Z-step Size | Defines axial sampling interval | Should be ≤ 0.5 x optical section thickness (from pinhole setting). | Typically 0.2 - 0.3 µm for a 1.2-1.5 AU pinhole with a high-NA objective. |
Detailed Experimental Protocol: Optimized 3D FISH-Confocal for Biofilms
Protocol 1: Systematic Parameter Calibration
Objective: To establish baseline imaging parameters for a specific FISH probe/biofilm sample.
- Sample Preparation: Fix and hybridize biofilm using standard FISH protocols. Mount in an anti-fade medium.
- Microscope Setup: Use a high NA oil-immersion objective (e.g., 63x/1.4 NA or 100x/1.45 NA).
- Initial Settings:
- Pinhole: Set to 1.2 AU.
- Digital Zoom: Calculate for Nyquist sampling (e.g., for 63x/1.4 NA, a zoom of ~1.5-2.0 on many systems yields ~60 nm/pixel).
- Scan Speed: Set to a medium-low setting (e.g., 7).
- Laser Power: Set to the lowest setting (e.g., 0.5%).
- Gain: Set to 50% of maximum.
- Detector Offset/Baseline: Set to 0.
- Laser Power Ramp: Gradually increase laser power in 0.5-1% increments. Acquire a single optical section. Stop when the brightest target signal reaches ~90% saturation (check histogram).
- Gain Adjustment: If the image is dim at maximum safe laser power (judged by lack of immediate bleaching), increase the gain incrementally until the saturation point is reached.
- Pinhole Adjustment: If the signal is still insufficient or SNR is poor, increase the pinhole to 1.4 AU and repeat steps 4-5, starting with a lower laser power. Document the change in optical section thickness.
- Z-stack Acquisition: Set the top and bottom of the biofilm using the fine focus. Set the z-step size to 0.25 µm. Acquire a test stack.
Protocol 2: 3D Image Acquisition for Quantitative Analysis
Objective: To acquire a z-stack suitable for 3D reconstruction and quantitative analysis (e.g., biovolume, spatial distribution).
- Apply Optimized Parameters: Use the calibrated settings from Protocol 1.
- Set Acquisition Mode: Frame averaging (2-4x) or line averaging significantly improves SNR compared to increasing gain/laser power. This is critical for dim FISH signals.
- Define Z-stack Boundaries: Manually set the first focal plane above and the last plane below the biofilm structure. Include a small margin.
- Set Z-step Size: Use the optimized value (e.g., 0.25 µm). The software will calculate the total number of slices.
- Sequential Scanning: If using multiple fluorophores (e.g., FISH probe + background stain), use sequential (multi-track) acquisition to prevent bleed-through.
- Acquire and Save: Save the raw image data in an uncompressed, non-proprietary format (e.g., .tiff, .ome.tiff) alongside all metadata (pinhole size, laser power, gain, zoom, objective, etc.).
Visualization of the Optimization Workflow
Title: Confocal Parameter Optimization Workflow for 3D FISH
The Scientist's Toolkit: Research Reagent & Material Solutions
Table 3: Essential Materials for FISH-Confocal 3D Biofilm Imaging
| Item | Function & Rationale |
|---|---|
| High-NA Oil Immersion Objective (e.g., 63x/1.4 NA Plan-Apochromat) | Maximizes light collection and spatial resolution, essential for resolving fine bacterial structures in 3D. |
| Immersion Oil (Type F/Fluoro) | Matches the objective's designed refractive index. Type F reduces autofluorescence, crucial for dim FISH signals. |
| #1.5 High-Performance Coverslips (170 µm thickness) | Standard thickness for optimal correction by high-NA objectives. Thickness variation degrades image quality. |
| Anti-fade Mounting Medium (e.g., with DABCO, Vectashield, ProLong) | Reduces photobleaching during extended 3D scan acquisition, preserving signal integrity. |
| FISH Probes (Cy3, Cy5, FAM labeled) | Common fluorophores with good photostability and compatibility with standard confocal laser lines and filter sets. |
| Background Stain (e.g., SYTO 9, DAPI) | Provides structural context by labeling all cells or nucleic acids, enabling localization of specific FISH signals. |
| Microscope Stage Incubator (for live imaging) | Maintains temperature, humidity, and CO2 for dynamic biofilm experiments, though FISH is typically fixed. |
| Spectral Unmixing Software/Module | Critical for separating overlapping emission spectra when using multiple fluorophores in dense biofilms. |
This document serves as a detailed application note within the broader thesis framework: "High-Resolution, Three-Dimensional Analysis of Biofilm Architecture and Function using Fluorescence In Situ Hybridization (FISH) Coupled with Confocal Laser Scanning Microscopy (CLSM)." The primary research gap addressed is the need for enhanced sensitivity and specificity in detecting and quantifying diverse, often slow-growing or metabolically inactive, microorganisms within complex 3D biofilm matrices. Standard FISH techniques are frequently limited by low ribosomal RNA content in target cells and autofluorescence from the extracellular polymeric substance (EPS). This note details advanced strategies—CARD-FISH, PNA-FISH, and multiplexing—that are critical for achieving the high-fidelity, multi-parametric data required for robust 3D reconstructions and subsequent analysis in drug development pipelines targeting biofilm-associated infections.
Core Principles & Quantitative Comparison
- CARD-FISH (Catalyzed Reporter Deposition FISH): Utilizes horseradish peroxidase (HRP)-labeled oligonucleotide probes and tyramide signal amplification (TSA) to dramatically increase fluorescence signal per target rRNA molecule, overcoming the low signal-to-noise ratio in biofilms.
- PNA-FISH (Peptide Nucleic Acid FISH): Employs neutrally charged PNA probes, which hybridize more efficiently to rRNA targets due to lack of electrostatic repulsion, leading to faster hybridization and higher specificity under stringent conditions.
- Multiplexing: The simultaneous use of multiple, spectrally distinct probes to label different taxonomic or functional groups within a single sample. This is essential for visualizing microbial community interactions and spatial organization in 3D.
Table 1: Comparative Performance Metrics of Advanced FISH Techniques
| Parameter | Standard DNA-FISH | PNA-FISH | CARD-FISH | Multiplex FISH (≥3 targets) |
|---|---|---|---|---|
| Typical Sensitivity Gain | 1x (Baseline) | 2-5x | 10-50x | N/A (Dependent on core method) |
| Hybridization Time | 2-3 hours | 30-90 minutes | 2-4 hours (post-permeabilization) | As per core method |
| Probe Penetration Depth in EPS | Moderate | High (due to neutral backbone) | Lower (large enzyme complex) | As per core method |
| Best Suited For | High-activity cells | Rapid detection, complex samples (e.g., blood, sputum) | Low-activity cells, environmental samples | Community structure analysis |
| Key Limitation | Low signal in stressed cells | Probe cost, design limitations | Indirect detection, complex protocol | Spectral overlap, channel crosstalk |
| Compatibility with CLSM 3D Imaging | Good | Excellent | Good (may require careful z-stack adjustment for large signals) | Excellent (enables 3D community mapping) |
Table 2: Common Fluorophore Combinations for Multiplex FISH in Biofilm CLSM
| Fluorophore | Excitation Max (nm) | Emission Max (nm) | Common Application | Compatible with CARD-FISH? |
|---|---|---|---|---|
| FITC / Alexa Fluor 488 | 495 | 519 | General probe, often for Bacteria | Yes |
| Cy3 / Texas Red | 554 | 568 | Second target, high brightness | Yes (common for tyramide) |
| Cy5 / Alexa Fluor 647 | 649 | 666 | Third target, low biofilm autofluorescence | Yes |
| DAPI (Counterstain) | 358 | 461 | Total cells / nucleic acids | Yes (post-hybridization) |
Detailed Protocols
Protocol: CARD-FISH for Low-Biomass Biofilm Samples
Objective: To detect and visualize microorganisms with low ribosomal content in a 3D biofilm matrix for CLSM imaging.
Key Reagent Solutions:
- Lysozyme Solution (10 mg/mL): For permeabilizing Gram-positive cells.
- HCl (0.01M): For quenching endogenous peroxidases.
- HRP-labeled Oligonucleotide Probe (50 ng/μL): Sequence-specific probe.
- Amplification Buffer (with H₂O₂): Contains fluorescein- or Cy3-tyramide.
- Blocking Buffer (0.1% Triton X-100, 10% Skim Milk): Reduces non-specific binding.
Methodology:
- Biofilm Fixation & Immobilization: Fix biofilm grown on a microscopy-grade coverslip in 4% paraformaldehyde (PFA) for 2-4 hours at 4°C. Dehydrate in an ethanol series (50%, 80%, 96%; 3 min each) and air dry.
- Embedding & Sectioning (Optional): For thick biofilms (>50 μm), embed in OCT compound and cryosection (10-20 μm thickness).
- Permeabilization: Apply lysozyme solution (for Gram-positives) or achromopeptidase (for Gram-negatives, if needed) for 60 min at 37°C. Rinse thoroughly with sterile PBS and Milli-Q water.
- Endogenous Peroxidase Inactivation: Treat sample with 0.01M HCl for 10 minutes at room temperature. Rinse with PBS.
- Hybridization: Apply 20-50 μL of HRP-probe in hybridization buffer. Incubate in a dark, humid chamber at 46°C for 2-3 hours.
- Post-Hybridization Wash: Immerse slide in pre-warmed washing buffer at 48°C for 25 minutes to remove unbound probe.
- Signal Amplification: Apply Amplification Buffer containing the fluorescently labeled tyramide substrate. Incubate in a dark, humid chamber for 30-45 minutes at 46°C. Critical: Optimize tyramide concentration and time to prevent over-amplification and distorted cell morphology.
- Counterstaining & Mounting: Rinse thoroughly. Counterstain with DAPI (1 μg/mL for 5 min) for total cell visualization. Mount in anti-fading mounting medium (e.g., Vectashield).
- CLSM Imaging: Acquire z-stacks with appropriate step size (e.g., 0.5 μm) using sequential scanning mode to minimize channel crosstalk.
Protocol: Multiplex PNA-FISH for Polymicrobial Biofilms
Objective: To simultaneously visualize three different microbial taxa within a polymicrobial biofilm.
Key Reagent Solutions:
- PNA Probe Mix: Three spectrally distinct PNA probes (e.g., FITC-labeled for Staphylococcus, Cy3-labeled for Pseudomonas, Cy5-labeled for Candida).
- PNA-FISH Hybridization Buffer: Commercial or lab-made, optimized for PNA chemistry.
- Stringent Wash Buffer: Pre-warmed to hybridization temperature.
Methodology:
- Fixation & Dehydration: Fix biofilm as in 3.1. Dehydrate in ethanol series and air dry.
- Hybridization: Prepare a master mix containing all three PNA probes in PNA hybridization buffer. Apply to sample. Incubate in a dark, humid chamber at 55°C for 90 minutes. Note: PNA hybridization temperature is typically higher than for DNA probes.
- Washing: Perform a stringent wash by immersing the slide in pre-warmed wash buffer at 58°C for 30 minutes.
- Rinsing & Mounting: Rinse briefly in cold PBS. Air dry in the dark. Mount with DAPI-containing anti-fade mounting medium.
- CLSM Imaging & Unmixing: Acquire z-stacks. Use spectral unmixing or linear unmixing software functions to separate signals from fluorophores with overlapping emission spectra, ensuring accurate 3D color representation.
Visualizations
CARD-FISH Workflow for Biofilms
CARD-FISH Protocol Steps
Multiplex FISH Experimental Design Logic
Multiplex FISH Design Pathway
The Scientist's Toolkit: Research Reagent Solutions
Table 3: Essential Reagents for Advanced FISH in Biofilm Research
| Item | Function in Protocol | Key Consideration for 3D Imaging |
|---|---|---|
| Paraformaldehyde (4% PFA) | Cross-linking fixative preserving morphology and nucleic acids. | Use fresh; over-fixation can reduce probe accessibility in deeper biofilm layers. |
| Lysozyme / Achromopeptidase | Enzymatic cell wall permeabilization for probe entry. | Concentration and time must be optimized per biofilm composition to avoid cell loss. |
| HRP-labeled DNA Probes | Target-specific oligonucleotide conjugated to horseradish peroxidase for CARD-FISH. | Must be HPLC-purified. Specificity must be validated in silico and empirically. |
| Fluorescently-labeled Tyramide | Enzyme substrate that precipitates locally upon HRP activation, amplifying signal. | Concentration is critical; too high causes diffuse signal that obscures 3D structure. |
| PNA Probes (FITC, Cy3, Cy5) | Neutral backbone probes for faster, more specific hybridization. | Expensive but highly effective for complex samples. Design requires specialist input. |
| Anti-fade Mounting Medium | Preserves fluorescence during prolonged CLSM scanning. | Must be compatible with oil/water immersion objectives and all fluorophores used. |
| DAPI Stain | Counterstain for total nucleic acids, defines overall biofilm volume. | Use at low concentration to avoid background bleed-through into other channels. |
| Strict Hybridization Buffer | Maintains pH and stringency during probe binding. | Formulation differs for DNA (formamide) vs. PNA probes. Temperature is key. |
Best Practices for Image Storage, Management, and Ethical Data Representation
This document provides application notes and protocols for managing high-content, multi-dimensional imaging data generated from Fluorescence In Situ Hybridization (FISH) combined with confocal microscopy for 3D biofilm research. Effective storage, management, and ethical representation are critical for reproducibility, collaboration, and drug development applications.
Image Storage & Management Protocols
Tiered Storage Architecture
A three-tiered system balances accessibility, cost, and security.
Table 1: Tiered Storage Architecture for 3D Biofilm Image Data
| Tier | Media | Recommended Use | Access Speed | Estimated Cost per TB/Year |
|---|---|---|---|---|
| Tier 1: Hot | High-performance NAS/SSD | Active projects, processing, analysis | <1 ms latency | $300 - $500 |
| Tier 2: Warm | Hard Disk Drive (HDD) Arrays | Completed projects, reference data, sharing | 10-50 ms latency | $80 - $150 |
| Tier 3: Cold | Cloud Object Storage (e.g., AWS Glacier) or LTO Tape | Archival, long-term preservation, compliance | Seconds to Hours (retrieval) | $10 - $40 |
File Organization & Naming Convention (Protocol)
- Directory Structure:
Project_ID/Year_Month/Experiment_ID/Sample_ID/Channel/Example:Biofilm_ABC/2024_10/EXP_024/Strain_X_Treatment_Y/CY3/ - File Naming Protocol:
Use the structured format:
[Project]_[Date]_[Sample]_[Stain]_[Z].tifExample:BiofilmABC_20241024_StrainX_FITC_z015.tif
Metadata Standards
Adopt the OME (Open Microscopy Environment) data model. Embed critical experimental metadata directly into image files (e.g., .ome.tif format).
- Mandatory Fields: Pixel size (XY, Z), channel wavelengths, laser power, detector gain, microscope objective, FISH probe sequences, biofilm growth conditions.
Data Backup Protocol
- Rule: Maintain at least 3 copies of data on 2 different media, with 1 copy offsite.
- Protocol: Nightly incremental backups from Tier 1 to Tier 2. Weekly full backups from Tier 2 to encrypted cloud/tape (Tier 3). Verify backup integrity quarterly.
Quantitative Image Analysis & Data Representation
Key Metrics for 3D FISH-Biofilm Analysis
Table 2: Core Quantitative Metrics from 3D FISH-Confocal Biofilm Images
| Metric Category | Specific Measurement | Tool/Algorithm | Typical Value Range (Example) |
|---|---|---|---|
| Biomass | Total biovolume (µm³) | ImageJ 3D Objects Counter | 10^4 - 10^7 µm³ |
| Architecture | Surface Area to Volume Ratio | ImageJ Surface Area Plugin | 0.5 - 2.0 µm⁻¹ |
| Thickness | Mean/Maximum Thickness (µm) | COMSTAT / ISA-3D | 10 - 200 µm |
| Microbial Composition | % Area or Volume by FISH Probe | Co-localization Analysis (e.g., Icy) | 0-100% |
| Signal Intensity | Mean Fluorescence Intensity per cell | Spot Detection & Measurement (e.g., Imaris) | 100-5000 AU |
Ethical Data Visualization Protocol
- Avoid Misleading Representations:
- Do not manipulate contrast selectively between compared images.
- Do apply identical Look-Up Tables (LUTs) and scale bars to all images in a comparative set.
- Protocol for 3D Renderings: Clearly state rendering thresholds and algorithms (e.g., "Surface rendered at threshold X"). Provide orthogonal slices (XY, XZ, YZ) alongside 3D projections.
- Statistical Transparency:
- Clearly define 'n' (number of independent biological replicates, not fields of view).
- Use appropriate measures of dispersion (e.g., standard deviation for normally distributed data).
Experimental Protocol: FISH-Confocal for 3D Biofilm Imaging
Protocol Title: Combined FISH and Confocal Microscopy for 3D Architectural and Compositional Analysis of Biofilms.
1. Biofilm Growth & Fixation:
- Grow biofilm in flow cell or on coverslip under relevant conditions.
- Fix with 4% paraformaldehyde (PFA) for 2-3 hours at 4°C.
- Wash three times with 1x PBS.
2. FISH Hybridization:
- Apply permeabilization solution (Lysozyme, 10 mg/mL for Gram-positives) for 30 min.
- Dehydrate with 50%, 80%, 96% ethanol washes (3 min each).
- Prepare hybridization buffer (0.9 M NaCl, 20 mM Tris/HCl, 0.01% SDS, Formamide concentration probe-specific).
- Add Cy3- or FITC-labeled oligonucleotide probe (50 ng/µL).
- Hybridize in a dark, humid chamber at 46°C for 90-120 minutes.
3. Washing & Counterstaining:
- Wash in pre-warmed washing buffer (20 mM Tris/HCl, 0.01% SDS, NaCl concentration probe-specific) at 48°C for 15 minutes.
- Rinse with distilled water.
- Optional: Counterstain with DAPI (1 µg/mL) or SYTO dyes for general biomass.
- Mount with anti-fading mounting medium (e.g., ProLong Diamond).
4. Confocal Microscopy Acquisition:
- Use a high-NA oil immersion objective (63x or 100x).
- Set Z-step size to ≤ 0.5 µm to satisfy Nyquist criterion for 3D reconstruction.
- Optimize pinhole to 1 Airy Unit per channel.
- Acquire sequential scanning to prevent channel bleed-through.
- Save raw data as .ome.tif files with all metadata.
Visualizations
Title: Workflow for 3D FISH-Confocal Biofilm Analysis
Title: Key Signaling in Biofilm Formation
The Scientist's Toolkit: Research Reagent Solutions
Table 3: Essential Materials for FISH-Confocal Biofilm Research
| Item | Function | Example Product/Type |
|---|---|---|
| Cy3/FITC-labeled FISH Probes | Targets specific 16S rRNA sequences for microbial identification. | Custom oligonucleotides (e.g., from Biomers). |
| Anti-fade Mounting Medium | Preserves fluorescence signal during microscopy. | ProLong Diamond, VECTASHIELD. |
| High-NA Objective Lens | Maximizes light collection and Z-resolution for 3D imaging. | Plan-Apochromat 63x/1.40 Oil. |
| Confocal Microscope System | Enables optical sectioning for 3D Z-stack acquisition. | Zeiss LSM 980, Nikon A1R. |
| Image Analysis Software | Processes and quantifies 3D image data. | Imaris, Arivis Vision4D, Fiji/ImageJ. |
| Data Management Platform | Stores, organizes, and shares OME-compliant data. | OMERO, custom NAS with database. |
| Formamide (Molecular Grade) | Component of hybridization buffer; stringency control. | Thermo Fisher, Sigma-Aldrich. |
Benchmarking FISH-Confocal: Strengths, Limitations, and Complementary Techniques
This analysis is framed within a broader thesis investigating the integration of Fluorescence In Situ Hybridization (FISH) with confocal laser scanning microscopy (CLSM) for the three-dimensional, taxon-specific imaging of biofilm architecture. A critical question is how this functional, 3D molecular imaging compares to classical electron microscopy techniques—Scanning Electron Microscopy (SEM) and Transmission Electron Microscopy (TEM)—in elucidating microbial ultrastructure. This document provides a comparative application note and detailed protocols for researchers navigating these complementary technologies.
Comparative Analysis: Capabilities and Data
Table 1: Core Technical and Application Comparison
| Parameter | FISH-Confocal Microscopy | Scanning Electron Microscopy (SEM) | Transmission Electron Microscopy (TEM) |
|---|---|---|---|
| Primary Output | 3D fluorescence localization of specific nucleic acid sequences. | 3D-like topographical image of surface morphology. | 2D projection image of internal ultrastructure. |
| Resolution | ~200 nm lateral, ~500 nm axial. | ~1-20 nm (surface topography). | ~0.1-1 nm (internal detail). |
| Sample State | Hydrated, viable (can be live/dead fixed). | Dehydrated, vacuum-compatible (fixed, dried, coated). | Dehydrated, ultrathin section (fixed, resin-embedded). |
| Key Strength | Phylogenetic identification in situ within 3D context; live-cell potential. | Excellent depth of field & surface detail; relatively simple sample prep. | Atomic-level resolution of intracellular components, membranes. |
| Major Limitation | Lower resolution; limited by probe design & penetration. | No inherent molecular specificity; sample drying creates artifacts. | No 3D context without tomography; complex, destructive preparation. |
| Quantitative Data Type | Biovolume, spatial statistics, co-localization coefficients. | Surface area, particle size, morphological measurements. | Membrane thickness, organelle dimensions, particle size. |
Table 2: Quantitative Performance Metrics in Biofilm Imaging
| Metric | FISH-Confocal | SEM | TEM |
|---|---|---|---|
| Typical Max Useful Magnification | 1000x | 100,000x - 500,000x | 500,000x - 1,000,000x+ |
| Penetration Depth in Biofilms | 50 - 100 µm (with clearing) | 1-5 µm (surface only) | < 100 nm (per section) |
| Time to Data (Post-Fixation) | 1-2 days (including hybridization) | 1-2 days | 3-7 days |
| Molecular Specificity | High (sequence-based). | None (elemental analysis via EDX possible). | Low (immunogold labeling possible). |
Detailed Experimental Protocols
Protocol 1: FISH-Confocal for 3D Biofilm Architecture
Objective: To visualize specific microbial taxa within the 3D structure of a hydrated biofilm.
- Fixation & Permeabilization: Fix biofilm (e.g., on a coverslip) in 4% paraformaldehyde (PFA) for 2-4h at 4°C. Wash with 1x PBS. For Gram-positive bacteria, add permeabilization step (e.g., incubation with lysozyme).
- Hybridization: Apply hybridization buffer (0.9 M NaCl, 20 mM Tris/HCl pH 7.5, 0.01% SDS, Formamide concentration probe-specific) containing HRP-labeled oligonucleotide probe (e.g., EUB338 for Bacteria). Incubate at 46°C for 90 min in a humidified chamber.
- Tyramide Signal Amplification (TSA): Wash with wash buffer. Incubate with fluorophore-labeled tyramide (e.g., Alexa Fluor 488-tyramide) in amplification buffer + 0.0015% H₂O₂ for 30 min at 46°C in the dark. This step drastically enhances signal.
- Counterstaining & Mounting: Wash thoroughly. Counterstain with DAPI (nucleic acids) and/or fluorescent lectins (EPS). Mount in an anti-fading mounting medium (e.g., ProLong Glass).
- Confocal Imaging: Acquire z-stacks (step size ~0.5 µm) using appropriate laser lines and sequential scanning to avoid bleed-through. Use 40x-63x oil immersion objectives.
Protocol 2: SEM for Biofilm Surface Ultrastructure
Objective: To visualize the detailed surface topography and morphology of biofilm cells.
- Primary Fixation: Fix biofilm in 2.5% glutaraldehyde + 2% PFA in 0.1 M cacodylate buffer (pH 7.4) for 2h at 4°C.
- Rinsing & Secondary Fixation: Rinse 3x in cacodylate buffer. Post-fix in 1% osmium tetroxide in the same buffer for 1h at 4°C.
- Dehydration: Dehydrate in a graded ethanol series (30%, 50%, 70%, 80%, 90%, 100%, 100%), 10 min per step.
- Critical Point Drying (CPD): Transition solvent to liquid CO₂ and perform CPD to avoid surface tension artifacts.
- Sputter Coating: Mount sample on stub with conductive adhesive. Coat with a 5-10 nm layer of gold/palladium using a sputter coater.
- Imaging: Image using SEM at accelerating voltages of 1-5 kV for optimal surface detail.
Protocol 3: TEM for Intracellular Ultrastructure
Objective: To visualize the internal fine structure of individual biofilm-embedded cells.
- Primary Fixation & Rinsing: As per SEM Protocol steps 1-2.
- Dehydration for Embedding: Dehydrate in a graded acetone series (30% to 100%).
- Infiltration & Embedding: Infiltrate with epoxy resin (e.g., Spurr's or Epon) mixtures of increasing concentration (e.g., 1:3, 1:1, 3:1 resin:acetone) culminating in pure resin. Embed in fresh resin and polymerize at 60°C for 48h.
- Sectioning: Use an ultramicrotome with a diamond knife to cut ultrathin sections (60-90 nm). Collect sections on copper grids.
- Staining: Stain with heavy metals: 2% aqueous uranyl acetate (20 min) followed by Reynold's lead citrate (5-10 min) to enhance contrast.
- Imaging: Image using TEM at 80-120 kV.
Visualized Workflows and Pathways
FISH-Confocal 3D Imaging Workflow
Comparative SEM and TEM Sample Preparation
Thesis Integration of Microscopy Techniques
The Scientist's Toolkit: Key Research Reagent Solutions
Table 3: Essential Materials for Featured Experiments
| Item | Function | Example Product/Note |
|---|---|---|
| HRP-labeled Oligonucleotide Probes | Provides sequence-specific binding for FISH with catalytic signal amplification. | Custom synthesized, e.g., from BioSpring or Metabion. |
| Fluorophore-labeled Tyramide | TSA substrate; HRP catalyzes its deposition, amplifying fluorescence signal 10-100x. | Alexa Fluor Tyramide SuperBoost Kits (Thermo Fisher). |
| Anti-fading Mounting Medium | Preserves fluorescence signal during storage and imaging; provides optimal refractive index. | ProLong Glass (Thermo Fisher) or Vectashield (Vector Labs). |
| Osmium Tetroxide (OsO4) | Secondary fixative for EM; stabilizes lipids and provides electronic contrast. | HIGHLY TOXIC. Use 4% aqueous stocks in sealed ampules. |
| Epoxy Embedding Resin | Infiltrates and supports tissue for ultrathin sectioning for TEM. | Spurr's Low-Viscosity Kit or EMbed 812 (EMS). |
| Uranyl Acetate | Heavy metal stain for TEM; binds to nucleic acids and proteins for contrast. | RADIOACTIVE. Use as 2% solution in water or methanol. |
| Critical Point Dryer | Removes solvent from SEM samples without surface tension-induced collapse. | Essential for accurate biofilm topography (e.g., Leica EM CPD300). |
| Conductive Adhesive Tape/Carbon Paint | Secures SEM sample to stub and prevents charging. | Double-sided carbon tape or colloidal silver paste. |
Within the broader thesis on advancing 3D biofilm imaging, this analysis positions Fluorescence In Situ Hybridization (FISH) combined with confocal laser scanning microscopy (CLSM) against Next-Generation Sequencing (NGS) approaches. The thesis investigates the spatial ecology of polymicrobial biofilms. While FISH-Confocal provides essential in situ spatial and morphological context, NGS offers comprehensive, high-resolution taxonomic and functional profiling. This document provides a comparative application note and detailed protocols for integrating these complementary techniques.
Table 1: Core Technical and Performance Comparison
| Parameter | FISH-Confocal Microscopy | NGS (Metagenomics/Transcriptomics) |
|---|---|---|
| Primary Output | Spatial distribution, 3D morphology, cell counts, spatial relationships. | Gene/transcript sequences, taxonomic abundance, functional potential/activity. |
| Resolution | Spatial: ~200 nm lateral, ~500 nm axial. Taxonomic: Strain/species (probe-dependent). | Taxonomic: Potentially species/strain-level. No inherent spatial information. |
| Throughput | Low to medium (manual field selection). | Very high (millions of sequences per run). |
| Sensitivity | ~10³-10⁴ cells/mL (with catalyzed reporter deposition). | High; can detect rare taxa (<0.1% abundance). |
| Quantification | Semi-quantitative (biovolume, pixel intensity). | Quantitative (relative abundance, transcripts per million). |
| Sample Preservation | Requires intact spatial structure (fixation). | Requires preserved nucleic acids (destructive). |
| Cost per Sample | Moderate (reagents, microscope time). | High (library prep, sequencing). |
| Key Limitation | Limited multiplexing, requires a priori probe design. | Loss of spatial context, potential PCR/analysis biases. |
Table 2: Application-Specific Suitability in Biofilm Research
| Research Question | Recommended Primary Method | Complementary Method | Rationale |
|---|---|---|---|
| Mapping microbial consortia architecture. | FISH-Confocal | Metagenomics | FISH visualizes spatial niches; metagenomics identifies members. |
| Identifying all taxa in a complex community. | Metagenomics | FISH-Confocal | NGS gives census; FISH validates and locates key taxa. |
| Assessing gene expression heterogeneity. | Spatial Transcriptomics | FISH-Confocal | Emerging spatial methods; FISH can confirm localization. |
| Tracking specific pathogen in situ. | FISH-Confocal | Metatranscriptomics | Direct visualization complemented by expression data. |
Detailed Experimental Protocols
Protocol 1: FISH-Confocal for 3D Biofilm Imaging
Adapted from thesis methodology for oral polymicrobial biofilms.
A. Biofilm Fixation and Hybridization
- Fixation: Grow biofilm on a sterile, glass-bottom dish. Gently wash with 1X PBS (pH 7.4). Fix with 4% paraformaldehyde (in PBS) for 2-4 hours at 4°C. Wash thrice with PBS.
- Permeabilization: Treat with lysozyme solution (10 mg/mL in 0.1M Tris-HCl, 0.05M EDTA, pH 8.0) for 30-60 min at 37°C. Rinse with distilled water.
- Hybridization:
- Prepare hybridization buffer: 0.9M NaCl, 20mM Tris/HCl (pH 7.4), 0.01% SDS, 30% formamide (stringency varies per probe).
- Add fluorescently labeled (e.g., Cy3, Cy5, FAM) oligonucleotide probes (50 ng/µL final concentration).
- Apply 100-200 µL to sample, incubate in a dark, humidified chamber at 46°C for 2-3 hours.
- Washing: Remove hybridization buffer and incubate with pre-warmed wash buffer (20mM Tris/HCl, 0.01% SDS, 5mM EDTA, NaCl concentration adjusted per probe stringency) at 48°C for 20 min. Rinse briefly with cold distilled water. Air dry in dark.
B. Confocal Microscopy & 3D Reconstruction
- Mounting: Mount biofilm in anti-fading mounting medium (e.g., Vectashield).
- Image Acquisition: Use a confocal microscope (e.g., Zeiss LSM 980). Set laser lines appropriate for fluorophores. For 3D imaging, set Z-stack parameters (step size: 0.5-1.0 µm) to encompass full biofilm depth.
- Analysis: Use software (e.g., ImageJ/FIJI, IMARIS, or thesis-custom algorithms) for:
- 3D volume rendering.
- Biovolume calculation of probe-positive regions.
- Co-localization analysis (e.g., Mander's coefficients) for microbial interactions.
Protocol 2: Metagenomic/Transcriptomic Sequencing from Biofilms
Complementary protocol for parallel samples in thesis research.
A. Nucleic Acid Extraction
- Homogenization: Mechanically disrupt biofilm matrix using bead-beating (0.1mm glass/zirconia beads) in lysis buffer.
- Co-extraction: Use a validated kit (e.g., ZymoBIOMICS DNA/RNA Miniprep Kit) for concurrent DNA (metagenomics) and RNA (metatranscriptomics) isolation. Treat RNA fraction with DNase I.
- Quality Control: Assess DNA/RNA integrity (Agilent Bioanalyzer/TapeStation) and purity (Nanodrop, 260/280 ratio ~1.8-2.0).
B. Library Preparation & Sequencing
- Metagenomics: Fragment DNA, perform end-repair, adapter ligation, and PCR amplification using a kit (e.g., Illumina DNA Prep). Use index primers for multiplexing.
- Metatranscriptomics: Deplete ribosomal RNA (rRNA) using a kit (e.g., QIASeq FastSelect). Synthesize cDNA and prepare library (e.g., Illumina Stranded Total RNA Prep).
- Sequencing: Pool libraries and sequence on an Illumina NovaSeq or NextSeq platform (2x150 bp paired-end recommended).
C. Bioinformatic Analysis Workflow See the following diagram for the core pipeline.
Title: NGS Bioinformatic Analysis Workflow
The Scientist's Toolkit: Essential Research Reagents & Materials
Table 3: Key Reagent Solutions for Integrated Biofilm Analysis
| Item | Function | Example Product/Catalog Number |
|---|---|---|
| Paraformaldehyde (4%, w/v) | Cross-linking fixative for preserving biofilm structure and nucleic acids in situ for FISH. | Thermo Scientific, 28906 |
| Formamide (deionized) | Component of FISH hybridization buffer; controls stringency and probe specificity. | MilliporeSigma, 47671 |
| Fluorescent Oligonucleotide Probes | Target-specific DNA probes labeled with fluorophores (e.g., Cy3, Cy5) for microbial identification. | Biomers.net, Custom Synthesis |
| Anti-fade Mounting Medium | Preserves fluorescence signal during confocal microscopy imaging. | Vector Laboratories, H-1000 |
| Bead-beating Tubes (0.1mm) | Mechanically disrupts tough biofilm matrices for efficient nucleic acid co-extraction. | OMNI International, 19-628 |
| DNA/RNA Co-extraction Kit | Simultaneously isolates high-quality genomic DNA and total RNA from a single biofilm sample. | Zymo Research, R2100 |
| rRNA Depletion Kit | Removes abundant ribosomal RNA to enrich for mRNA in metatranscriptomic samples. | Qiagen, 334386 |
| Dual-Indexed Adapter Kit | Allows multiplexing of numerous samples for cost-effective NGS library preparation. | Illumina, 20040553 |
Integrated Pathway: From Spatial Hypothesis to Multi-Omic Validation
This diagram illustrates the logical flow from FISH-driven observation to NGS-based hypothesis testing, central to the thesis framework.
Title: Hypothesis-Driven Integration of FISH and NGS
This application note is framed within a doctoral thesis investigating the spatial organization and gene expression dynamics within architecturally complex, three-dimensional biofilms using Fluorescence In Situ Hybridization (FISH). A core methodological challenge is the high-fidelity, volumetric imaging of large (>1 mm³) FISH-labeled samples with minimal photodamage. This document provides a comparative analysis and detailed protocols for two paramount imaging modalities: point-scanning confocal laser scanning microscopy (CLSM) and Light Sheet Fluorescence Microscopy (LSFM). The focus is on their application for large biofilm samples, balancing resolution, speed, and photobleaching.
Table 1: Quantitative Comparison of FISH-Confocal vs. LSFM for Large Biofilm Samples
| Parameter | Confocal Microscopy (e.g., resonant scanner) | Light Sheet Microscopy (diSPIM, lattice light sheet) | Implication for Large-Sample FISH |
|---|---|---|---|
| Illumination Principle | Point illumination & detection via pinhole. | Planar illumination with orthogonal camera detection. | LSFM illuminates only the imaged plane, drastically reducing out-of-focus light exposure. |
| Typical Acquisition Speed (for 1 mm³ volume) | 5-30 minutes (varies with voxel size). | 10-60 seconds. | LSFM enables rapid screening of large areas and dynamic processes post-FISH. |
| Photobleaching & Phototoxicity | High (sample fully illuminated by scanning point). | Very Low (only imaged plane is illuminated). | LSFM preserves fluorescence signal and sample viability, critical for sequential FISH or live-dead assays. |
| Optical Sectioning | Excellent, via physical pinhole. | Excellent, via light sheet geometry and camera-based optical sectioning. | Both provide high-contrast, blur-free sections suitable for 3D reconstruction. |
| Effective Lateral Resolution | High (~240 nm with oil immersion). | Good to High (~300-400 nm with water immersion). | Confocal may resolve finer bacterial cell details; LSFM resolution is often sufficient for colony morphology. |
| Sample Size Compatibility | Limited by working distance (WD) of high-NA objectives (often < 300 µm). | Excellent. Designed for cm-sized samples with long WD objectives. | LSFM is inherently superior for intact, mm-scale biofilm architectures. |
| Multiview Imaging | Complex, requires sample rotation stages. | Native (e.g., diSPIM uses two orthogonal objectives). | LSFM's multiview capability improves resolution isotropy and reduces shadowing in thick samples. |
| Protocol Complexity | Standardized. Mounting in standard dishes/coverslips. | Specialized. Requires sample mounting in agarose or cylinders within immersion medium. | LSFM demands specific sample preparation but is manageable for fixed biofilms. |
Detailed Experimental Protocols
Protocol 1: FISH-Labeling and Clearing of Mature Biofilms for 3D Imaging
This protocol optimizes FISH for deep imaging in large, hydrated samples.
Key Research Reagent Solutions:
- Fixative Solution (4% PFA in PBS): Cross-links and preserves biofilm structure and nucleic acids.
- Permeabilization Buffer (0.1% Triton X-100 in PBS): Facilitates probe entry into bacterial cells.
- Hybridization Buffer (0.9M NaCl, 20mM Tris/HCl, 0.01% SDS, Formamide concentration probe-dependent): Dictates stringency and specificity of probe binding.
- Wash Buffer (NaCl concentration matched to hybridization buffer): Removes unbound and non-specifically bound probes.
- Optical Clearing Reagent (e.g., Ce3D, EasyIndex): Reduces light scattering by matching refractive index throughout the sample, crucial for deep imaging.
Methodology:
- Fixation: Immerse biofilm (grown on a suitable substrate) in 4% PFA for 4-24 hours at 4°C.
- Permeabilization: Rinse with PBS, then treat with 0.1% Triton X-100 for 15-30 minutes.
- FISH Hybridization: Apply fluorescently-labeled oligonucleotide probes (e.g., EUB338 for Bacteria) in hybridization buffer. Incubate at 46°C for 1.5-3 hours in a humidified chamber.
- Stringency Wash: Immerse sample in pre-warmed wash buffer at 48°C for 10-20 minutes.
- Optional Clearing: For very thick biofilms (>100 µm), immerse sample in a refractive index matching solution (e.g., Ce3D) for 24-48 hours to enhance optical clarity.
- Mounting for Imaging: Transfer to imaging chamber.
- For Confocal: Mount under a coverslip with appropriate immersion medium (water, glycerol).
- For LSFM: Embed in 1-2% low-melt agarose within a glass capillary or sample cylinder filled with immersion/clearing medium.
Protocol 2: 3D Imaging with Confocal Microscopy
- Setup: Place mounted sample on stage. Select water-immersion objective with longest usable WD (e.g., 20x/0.8 NA, WD=0.8 mm).
- Parameter Optimization: Set pinhole to 1 Airy Unit. Adjust laser power and detector gain to avoid saturation. Set voxel size (e.g., 0.3 x 0.3 x 0.5 µm) for optimal Nyquist sampling.
- Acquisition: Define Z-stack range covering full sample depth. Use resonant scanning for speed. Acquire channels sequentially to minimize crosstalk.
- Post-processing: Apply deconvolution (e.g., Huygens software) to improve resolution and contrast.
Protocol 3: 3D Imaging with Light Sheet Microscopy
- Setup: Mount sample cylinder in chamber filled with immersion medium (e.g., EasyIndex). Align light sheet to the focal plane of the detection objective.
- Light Sheet Optimization: Adjust sheet width and height to match the region of interest. Use digital scanning (if available) to create a uniform sheet.
- Acquisition: Define Z-stack. For diSPIM, acquire two orthogonal views by swapping illumination/detection paths.
- Post-processing: Fuse multiview datasets (e.g., using Fiji/Blender or commercial software) to create an isotropic, high-quality volume. Deconvolution (e.g., with LLSpy or Lucy-Richardson) can be applied.
Visualized Workflows and Pathways
Title: Workflow for FISH and 3D Imaging of Biofilms
Title: Imaging Principle Impact on Performance Metrics
This application note is situated within a doctoral thesis investigating the architecture and physiology of polymicrobial biofilms using Fluorescence In Situ Hybridization (FISH) combined with confocal laser scanning microscopy (CLSM). While 3D imaging provides unparalleled spatial and taxonomic resolution, validating quantitative metrics (e.g., biovolume, fluorescence intensity) against independent, orthogonal measures of viability and metabolic activity is paramount. This document details protocols and analytical frameworks for correlating CLSM-derived quantitative data with cell counts and metabolic assay readouts, ensuring robustness in downstream analyses for drug discovery and basic research.
Core Validation Workflow & Data Correlation Strategy
The validation pipeline proceeds from 3D image acquisition through segmentation and data extraction, culminating in correlation with destructive endpoint assays performed on the same or identical replicate samples.
Diagram 1: Core validation workflow from imaging to correlation.
Detailed Experimental Protocols
Protocol: Correlative Sample Preparation for FISH-CLSM and Endpoint Assays
Objective: Generate statistically comparable biofilm samples for parallel imaging and biochemical analysis. Materials: 96-well plate with flat, optically clear bottom (for imaging) OR polypropylene coupon carriers; sterile growth medium; inoculated microbial culture.
- Biofilm Cultivation: For a 24-well plate, place one polypropylene coupon (e.g., 1 cm x 1 cm) per well. Add 2 mL of inoculated culture medium per well. Incubate under appropriate conditions (e.g., 37°C, static or with gentle shaking) for desired biofilm formation time (e.g., 48-72h).
- Washing: Gently rinse each coupon twice with 1x PBS (pH 7.4) to remove planktonic cells.
- Sample Allocation: For correlative studies, allocate a minimum of n=6 coupons per experimental condition. Randomly assign:
- n=3 coupons for FISH-CLSM processing (Section 3.2).
- n=3 coupons for Destructive Harvesting and endpoint assays (Sections 3.3 & 3.4).
Protocol: FISH-CLSM Processing, Imaging, and Quantitative Analysis
Objective: Generate 3D image stacks and extract quantitative morphological and fluorescence data. Key Reagents: FISH probes (e.g., EUB338 for Bacteria, specific 16S rRNA probes), formaldehyde (4% for fixation), ethanol series (50%, 80%, 96% for dehydration), hybridization buffer, wash buffer, DAPI (optional counterstain).
- Fixation & Permeabilization: Immerse imaging coupons in 4% paraformaldehyde (PFA) for 2-4h at 4°C. Wash with PBS. Dehydrate in ethanol series (50%, 80%, 96%; 3 min each).
- FISH Hybridization: Apply hybridization buffer containing fluorescently-labeled oligonucleotide probes (e.g., Cy3, Cy5) to the biofilm. Incubate at 46°C for 90 min in a humidified chamber.
- Stringency Wash: Immerse coupon in pre-warmed wash buffer at 48°C for 15 min. Rinse briefly with ice-cold dH₂O and air dry in dark.
- CLSM Imaging: Mount coupon on microscope slide. Image using a 40x or 63x oil-immersion objective. Acquire z-stacks with a step size of 0.5-1.0 µm, ensuring Nyquist sampling. Use identical laser power, gain, and digital offset across all samples.
- Quantitative Data Extraction: Use image analysis software (e.g., ImageJ/FIJI with BiofilmQ or BIOM3D).
- Biovolume: Apply consistent thresholding to probe channel. Calculate total volume of thresholded objects (µm³).
- Fluorescence Intensity: Measure mean or integrated fluorescence density within the segmented biovolume.
- Other Metrics: Surface area, thickness distribution.
Protocol: Destructive Harvesting for Cell Counting (CFU/Total Cells)
Objective: Recover biofilm cells for viable count or total cell enumeration.
- Harvesting: Transfer the assay coupon to a sterile 15mL tube containing 5 mL of PBS. Sonicate in a water bath sonicator (e.g., 42 kHz, 5 min) followed by vigorous vortexing (1 min) to dislodge biofilm.
- Viable Count (CFU): Prepare serial decimal dilutions of the homogenate in PBS. Plate 100 µL aliquots onto appropriate agar media. Incubate and count colony-forming units (CFU). Report as log10(CFU/cm²).
- Total Cell Count: For total cells (live+dead), stain an aliquot of homogenate with SYTO 9 (1 µM, 15 min) and enumerate using a hemocytometer under a fluorescence microscope or an automated cell counter.
Protocol: Metabolic Activity Assay (Resazurin Reduction)
Objective: Quantify the metabolic activity of the harvested biofilm cells. Principle: Resazurin (blue, non-fluorescent) is reduced by metabolically active cells to resorufin (pink, highly fluorescent).
- Sample Prep: Use a portion of the homogenate from 3.3, Step 1. Centrifuge (5000 x g, 5 min) and resuspend cell pellet in fresh, reduced-medium to a standardized volume.
- Assay: In a black 96-well plate, add 180 µL of cell suspension per well. Add 20 µL of filter-sterilized resazurin sodium salt solution (0.15 mg/mL final concentration). Include negative (medium + resazurin, no cells) and positive controls.
- Measurement: Incubate plate at 37°C. Measure fluorescence (Ex/Em: 560/590 nm) every 30 minutes for 2-4 hours using a plate reader.
- Analysis: Subtract the negative control values. Report results as Maximum Rate of Fluorescence Increase (RFU/min) or Total Fluorescence at Endpoint (RFU).
Data Presentation: Correlation Analysis
Quantitative data from imaging and endpoint assays are compiled for correlation analysis using Pearson or Spearman tests. Example dataset:
Table 1: Representative Correlation Data from a P. aeruginosa Biofilm Treated with Antibiotic X
| Sample ID | CLSM Biovolume (µm³ x 10⁶) | Mean FISH Intensity (A.U.) | log10(CFU/cm²) | Metabolic Rate (RFU/min) |
|---|---|---|---|---|
| Control 1 | 12.5 | 12540 | 7.2 | 450 |
| Control 2 | 11.8 | 11850 | 7.1 | 425 |
| Control 3 | 13.1 | 13100 | 7.3 | 470 |
| Antibiotic X 1 | 5.2 | 6200 | 5.8 | 150 |
| Antibiotic X 2 | 4.8 | 5800 | 5.6 | 135 |
| Antibiotic X 3 | 3.9 | 5100 | 5.4 | 120 |
Table 2: Correlation Matrix (Pearson's r) for the Dataset in Table 1
| Parameter | CLSM Biovolume | Mean FISH Intensity | log10(CFU/cm²) |
|---|---|---|---|
| Mean FISH Intensity | 0.98 | - | - |
| log10(CFU/cm²) | 0.96 | 0.95 | - |
| Metabolic Rate | 0.94 | 0.93 | 0.97 |
The Scientist's Toolkit: Key Research Reagent Solutions
| Item/Reagent | Function in Validation Pipeline |
|---|---|
| Formamide (in FISH buffer) | Controls hybridization stringency; crucial for probe specificity to target rRNA. |
| Cy3/Cy5-labeled FISH Probes | Provide taxon-specific fluorescence signal for CLSM imaging and quantification. |
| DAPI or SYTO 9 Stain | General nucleic acid counterstain for assessing total biovolume or cell count. |
| Resazurin Sodium Salt | Redox indicator for measuring metabolic activity of harvested biofilm cells. |
| Image Analysis Software (BiofilmQ/BIOM3D) | Enables 3D segmentation and extraction of quantitative features from CLSM stacks. |
| Polypropylene Coupons | Provide standardized, reproducible surface for biofilm growth in parallel assays. |
| Water Bath Sonicator | Gently and uniformly dislodges biofilm for harvesting without excessive cell lysis. |
Diagram 2: Interpreting correlation strength between data types.
Within the framework of a thesis investigating 3D biofilm architecture using Fluorescence In Situ Hybridization (FISH) combined with confocal laser scanning microscopy (CLSM), selecting the appropriate probe or technique is critical. This work bridges microbial taxonomy, metabolic activity, and physical structure—three pillars of biofilm research. The choice of tool directly impacts the interpretation of spatial relationships, community function, and resilience. This document provides a decision matrix and associated protocols to guide method selection based on specific research objectives.
Decision Matrix for Probe & Technique Selection
Table 1: Tool Selection Matrix for 3D Biofilm Imaging Objectives
| Research Objective | Primary Target | Recommended FISH Probe Type | Key Consideration | Compatible CLSM Analysis |
|---|---|---|---|---|
| Taxonomy/Phylogeny | 16S/23S rRNA | DNA oligonucleotide probe (e.g., EUB338, ARCH915, specific genus probes) | High rRNA copy number in active cells; requires fixation/permeabilization. | 3D volume rendering, co-localization analysis. |
| Metabolic Activity | rRNA, mRNA, or enzymes | rRNA-targeted probe (activity correlate), BONCAT / FISH-NanoSIMS, Click Chemistry-based probes (e.g., BONCAT-FISH) | rRNA content correlates with growth rate; direct protein synthesis detection via BONCAT. | Intensity quantification as proxy for activity, radiometric imaging. |
| Microbial Structure | EPS components, specific cells | Lectins (glycoconjugate binding), EPS-targeting antibodies, General nucleic acid stains (e.g., SYTO dyes) | Often used in conjunction with FISH (FISH-Lectin). Provides context for microbial clusters. | EPS channel imaging, distance mapping, biofilm porosity analysis. |
| High-Resolution Taxonomy | Single nucleotides | Catalyzed Reporter Deposition FISH (CARD-FISH) | Amplifies signal for difficult-to-detect (e.g., low rRNA) or autofluorescent samples. | Super-resolution compatible; enhanced signal-to-noise. |
| Community Function | mRNA of functional genes | Double Labeling Oligonucleotide Probe (DOPE)-FISH, RING-FISH | mRNA is labile; requires rapid fixation and specialized protocols. | Spatial mapping of gene expression within biofilm strata. |
Table 2: Quantitative Performance Comparison of Key Techniques
| Technique | Typical Signal Amplification | Effective Spatial Resolution in CLSM | Time to Result (after sample prep) | Suitability for Viable/Active Cell Detection |
|---|---|---|---|---|
| Standard FISH | 1x (Direct fluor label) | ~250-300 nm (diffraction-limited) | 4-6 hours | Moderate (good for rRNA) |
| CARD-FISH | 10-100x (Enzymatic) | ~250-300 nm (can be combined with SIM) | 8-12 hours | Good, but permeabilization is critical |
| BONCAT-FISH | N/A (Incorporates amino acids) | ~250-300 nm | 24-48 hours (incubation + click chem) | Excellent (direct activity link) |
| FISH-NanoSIMS | N/A (Isotopic detection) | ~100 nm (NanoSIMS) | Days | Excellent (single-cell metabolism) |
| Lectin Staining | 1x (Direct label) | ~250-300 nm | 2-3 hours | No (binds extracellular matrix) |
Experimental Protocols
Protocol 1: Standard FISH for Taxonomic Identification in 3D Biofilms (CLSM Compatible)
Objective: To identify specific phylogenetic groups within a hydrated 3D biofilm matrix.
- Fixation: Immerse biofilm sample in 4% paraformaldehyde (PFA) in PBS (pH 7.4) for 2-4 hours at 4°C. Rinse 3x with PBS.
- Permeabilization (if needed): Treat with Lysozyme (10 mg/mL in 0.1M Tris-HCl, 0.05M EDTA) for 30 min at 37°C for Gram-positives.
- Hybridization: Prepare hybridization buffer (0.9M NaCl, 20mM Tris-HCl pH 7.4, 0.01% SDS, Formamide concentration probe-specific). Add fluorescently-labeled oligonucleotide probe (e.g., Cy3-EUB338, 5 ng/μL). Apply 100 μL to sample, incubate in a dark, humid chamber at 46°C for 2-3 hours.
- Washing: Remove hybridization buffer and incubate in pre-warmed wash buffer (20mM Tris-HCl, 5mM EDTA, 0.01% SDS, NaCl concentration probe-specific) at 48°C for 15-20 minutes.
- Rinsing & Counterstaining: Rinse briefly with ice-cold molecular grade water. Optional: stain with DAPI (1 μg/mL) or SYTOX Green for total cells. Air dry in dark.
- Mounting for CLSM: Mount biofilm in a CLSM-compatible, anti-fading mounting medium (e.g., Vectashield). Seal coverslip.
- Imaging: Acquire z-stacks using a CLSM with appropriate lasers and emission filters. Maintain consistent pinhole, gain, and laser power between samples.
Protocol 2: BONCAT-FISH for Linking Taxonomy and Activity
Objective: To concurrently identify phylogenetic identity and detect de novo protein synthesis in active biofilm cells. Part A: BONCAT (Bioorthogonal Noncanonical Amino Acid Tagging)
- Pulse-Labeling: Incubate live biofilm with L-homopropargylglycine (HPG, 50 μM) in fresh medium for 1-2 doubling times. Include a no-HPG control.
- Fixation: Fix with 4% PFA as in Protocol 1. Part B: Click Chemistry Conjugation
- Click Reaction: Prepare click reaction cocktail: 100 μM fluorescent azide (e.g., Azide-Fluor 488), 1 mM CuSO₄, 100 mM sodium ascorbate in PBS. Incubate sample with cocktail for 1 hour at room temperature, protected from light.
- Rinsing: Wash 3x with PBS to remove residual cocktail. Part C: FISH
- Hybridization: Perform standard FISH (as in Protocol 1, Steps 3-5) using a probe with a distinct fluorophore (e.g., Cy5-labeled specific probe).
- Mounting & Imaging: Mount and image via CLSM as in Protocol 1. HPG signal (activity) and FISH signal (taxonomy) are imaged in separate channels.
Signaling Pathway & Workflow Visualizations
Title: BONCAT-FISH Experimental Workflow
Title: Decision Logic for Biofilm Imaging Tool Selection
The Scientist's Toolkit: Research Reagent Solutions
Table 3: Essential Reagents for FISH-based 3D Biofilm Imaging
| Reagent / Solution | Function / Purpose | Key Consideration for 3D Imaging |
|---|---|---|
| Paraformaldehyde (PFA), 4% in PBS | Cross-linking fixative. Preserves 3D structure and immobilizes nucleic acids. | Must fully penetrate biofilm. Over-fixation can reduce hybridization efficiency. |
| Formamide | Denaturant in hybridization buffer. Controls stringency and probe specificity. | Concentration is probe-specific (% vol/vol). Higher % increases stringency. |
| Fluorescently-Labeled Oligonucleotide Probes (e.g., Cy3, Cy5, FITC) | Binds complementary rRNA sequences for phylogenetic identification. | Photostability is key for z-stack acquisition. Use dark probes for autofluorescent samples. |
| Lysozyme or Proteinase K | Enzymatic permeabilization agents. Allows probe access to rRNA in cell walls. | Optimization required per biofilm; can damage fragile 3D structure if overused. |
| Anti-Fading Mounting Medium (e.g., Vectashield, ProLong Diamond) | Preserves fluorescence during CLSM scanning; reduces photobleaching. | Must be compatible with water-immersion lenses if used for hydrated samples. |
| L-homopropargylglycine (HPG) | Methionine analog incorporated by active cells during protein synthesis. | Requires a "click chemistry" step post-fixation for fluorescence detection. |
| Fluorescent Azide (e.g., Azide-Fluor 488) | Reacts with alkyne group of HPG via CuAAC "click chemistry" to label active cells. | Must be performed after fixation but before FISH hybridization. |
| Lectin Conjugates (e.g., WGA-FITC) | Binds specific polysaccharides (e.g., N-acetylglucosamine) in the EPS matrix. | Used as a counterstain to visualize biofilm architecture surrounding FISH-labeled cells. |
Conclusion
The integration of FISH with confocal microscopy provides an unparalleled, correlative framework that links phylogenetic identity with precise spatial context in 3D biofilm architecture. By mastering the foundational principles, meticulous methodology, and optimization strategies outlined, researchers can generate robust, quantitative data on microbial community structure and interactions. While powerful, FISH-Confocal is most impactful when used as part of a multimodal approach, validated against complementary techniques like sequencing and electron microscopy. Future directions point towards live-cell imaging (FISH-vital), higher-order multiplexing, integration with Raman microscopy for metabolic profiling, and automated AI-driven image analysis. These advancements will further cement FISH-Confocal as an indispensable tool in combating antibiotic-resistant infections, engineering microbiomes, and developing novel anti-biofilm therapies, directly impacting biomedical innovation and clinical translation.