Culturable vs. Non-Culturable Techniques: A 2024 Guide for Microbial Research & Drug Discovery
This article provides a comprehensive comparative analysis of traditional culture-dependent methods and modern culture-independent techniques for microbial analysis.
Culturable vs. Non-Culturable Techniques: A 2024 Guide for Microbial Research & Drug Discovery
Abstract
This article provides a comprehensive comparative analysis of traditional culture-dependent methods and modern culture-independent techniques for microbial analysis. Tailored for researchers, scientists, and drug development professionals, it explores the fundamental principles, methodologies, and applications of both approaches. We detail practical workflows, common troubleshooting scenarios, and optimization strategies. A critical validation and comparative analysis section evaluates the strengths, limitations, and complementarity of these methods in biomedical research, clinical diagnostics, and therapeutic development, offering a roadmap for integrated microbial study design.
The Microbial Frontier: Defining Culturable and Non-Culturable Realms in Modern Science
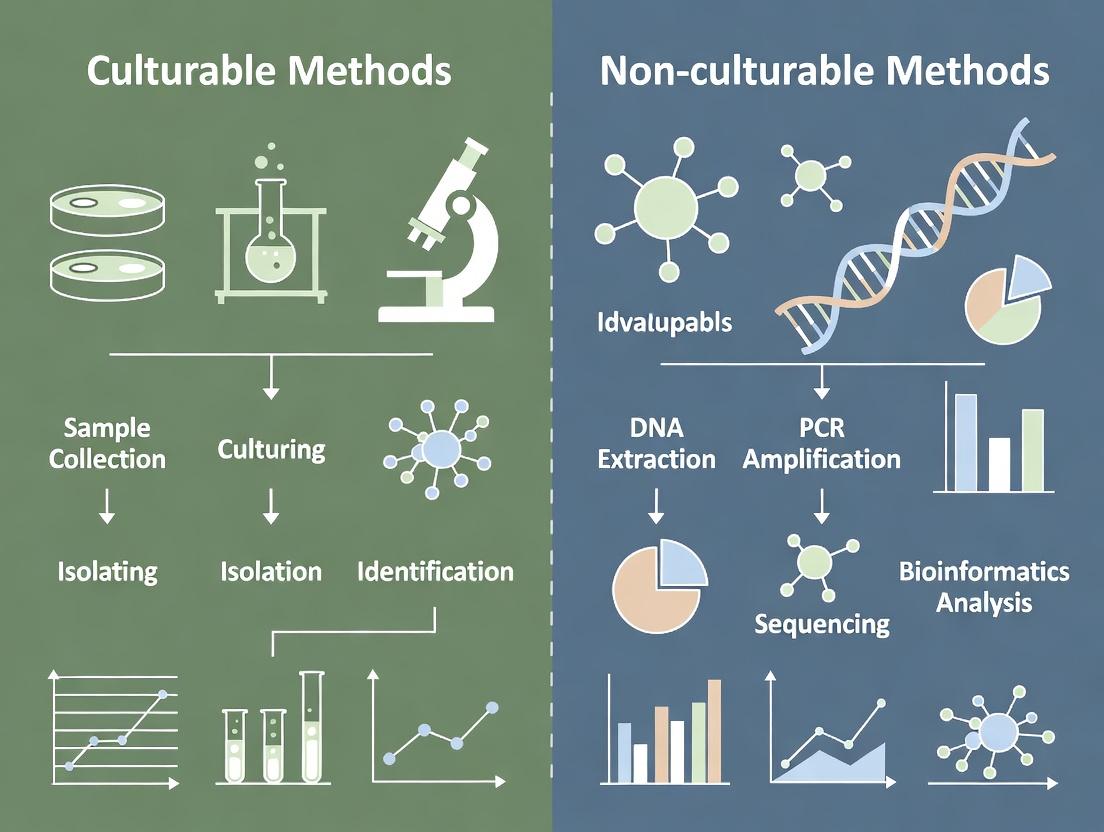
In the comparative analysis of culturable versus non-culturable research methods, traditional culture-based techniques remain a fundamental pillar. This guide objectively compares their performance against modern, non-culturable alternatives, such as metagenomic sequencing and single-cell genomics, supported by recent experimental data.
Principles and Scope
Traditional methods rely on cultivating microorganisms in vitro on specific nutrient media, allowing for the isolation, enumeration, and phenotypic characterization of viable cells. Their scope is defined by the "great plate count anomaly"—the well-documented limitation that only a small fraction (typically 0.1-1%) of environmental microbes can be cultured under standard laboratory conditions. Despite this, they provide a living resource for downstream functional assays, drug screening, and pathogen characterization.
Performance Comparison: Culturable vs. Non-Culturable Methods
The following table synthesizes recent comparative studies, highlighting key performance metrics.
Table 1: Comparative Analysis of Methodologies for Microbial Community Analysis
| Performance Metric | Traditional Culture-Based Methods | Non-Culturable Methods (e.g., Shotgun Metagenomics) | Supporting Experimental Data (Summary) |
|---|---|---|---|
| Taxonomic Coverage | Low (Targets only fast-growing, non-fastidious organisms) | Very High (Captures entire genetic material) | A 2023 soil study cultured 350 distinct colonies vs. 15,000+ species-level OTUs identified via metagenomics. |
| Functional Insight | Provides direct, phenotypic evidence (e.g., metabolism, virulence) | Predicts function from genetic potential; may not reflect active state | A 2024 antibiotic resistance study showed culture confirmed phenotypically resistant E. coli; metagenomics detected AMR genes but not their host's viability. |
| Turnaround Time | Long (Days to weeks for colony formation) | Short to Moderate (Sample prep to bioinformatics in days) | Comparative diagnostic protocol for UTIs: Culture required 48h for ID/AST; direct sequencing provided pathogen ID in 6h but no AST. |
| Cost Per Sample | Low (Routine media and incubators) | High (Sequencing reagents, computational infrastructure) | 2024 cost analysis estimated culture at ~$10/sample vs. ~$200-500 for deep metagenomic sequencing. |
| Viability & Strain Recovery | Definitive. Selects for living, proliferating cells. | Inferential. Viability stains can be used but isolation is indirect. | Research on probiotics required culture to isolate and bank specific active strains for in vivo trials. |
| Quantification Accuracy | High for culturable subset (CFU/mL is a gold standard) | Semi-quantitative (Subject to genome size, GC content, and PCR bias) | Comparison of spiked L. monocytogenes in food: Culture counts correlated linearly with input; metagenomic read counts showed non-linear saturation. |
Detailed Experimental Protocols
Protocol 1: Comparative Microbial Census of a Clinical Sputum Sample
- Objective: To assess pathogen identification concordance between culture and metagenomic sequencing.
- Culture Method: Sample was plated on Blood Agar, Chocolate Agar, and MacConkey Agar. Plates were incubated at 35°C in 5% CO₂ for 48 hours. Morphologically distinct colonies were isolated and identified using MALDI-TOF MS.
- Metagenomic Method: Parallel sample aliquot underwent DNA extraction using a bead-beating kit. Libraries were prepared with a shotgun approach and sequenced on an Illumina NextSeq 2000 platform (2x150 bp). Data was analyzed via a bioinformatics pipeline for taxonomic classification (Kraken2/Bracken).
- Outcome Measure: Primary identification of the causative infectious agent(s).
Protocol 2: Functional Antibiotic Resistance Profiling
- Objective: To compare phenotypic AST with genotypic resistance gene detection.
- Culture-Based AST: Isolated pure colonies were subject to disk diffusion or broth microdilution per CLSI guidelines. Minimum Inhibitory Concentrations (MICs) were recorded.
- Genomic Detection: DNA from the same isolate and from direct sample extraction was sequenced. Raw reads were aligned to known AMR gene databases (e.g., CARD, ResFinder).
- Outcome Measure: Correlation between phenotypic resistance and the presence of corresponding AMR genes.
Visualizations
Diagram 1: Workflow for Comparative Culture vs. Metagenomics Study
Diagram 2: The Great Plate Count Anomaly Concept
The Scientist's Toolkit: Key Research Reagent Solutions
Table 2: Essential Materials for Traditional Culture-Based Research
| Item | Function & Application |
|---|---|
| Selective & Differential Media (e.g., MacConkey, Mannitol Salt Agar) | Contains indicators and inhibitors to isolate specific microbial groups based on biochemical properties. |
| Enrichment Broths (e.g., Selenite F, Tetrathionate) | Selectively promotes the growth of target pathogens from samples with high background flora. |
| Anaerobic Culture Systems (Jars, Chambers, Gas Packs) | Creates an oxygen-free environment essential for cultivating obligate anaerobic bacteria. |
| MALDI-TOF Mass Spectrometer | Enables rapid, accurate identification of cultured isolates by analyzing protein fingerprints. |
| Automated Blood Culture Systems (e.g., BACTEC, BacT/ALERT) | Continuously monitors clinical specimens for microbial growth, signaling positivity. |
| Microtiter Plates for Broth Microdilution | Standardized 96-well plates for high-throughput determination of Minimum Inhibitory Concentrations (MICs). |
| Cell Culture Lines (e.g., HEp-2, Vero) | Essential for the culture and study of obligate intracellular pathogens (e.g., viruses, Chlamydia). |
Within the thesis of comparative analysis of culturable versus non-culturable methods, culture-independent analysis has fundamentally shifted microbiological research and diagnostics. This guide compares the core technologies driving this revolution.
Performance Comparison: 16S rRNA Gene Sequencing vs. Shotgun Metagenomics
The choice between targeted 16S sequencing and whole-genome shotgun metagenomics is pivotal. The table below summarizes key performance metrics based on recent benchmarking studies.
Table 1: Comparative Performance of Primary Culture-Independent Sequencing Methods
| Feature | 16S rRNA Gene Amplicon Sequencing | Shotgun Metagenomics |
|---|---|---|
| Target Region | Hypervariable regions of 16S rRNA gene | All genomic DNA in sample |
| Taxonomic Resolution | Genus to species level; limited strain differentiation | Species to strain level; can identify novel species |
| Functional Insight | Indirect, via inference from taxonomy | Direct, via identification of functional genes & pathways |
| Host DNA Contamination Sensitivity | Low (specific prokaryotic target) | High (sequences all DNA) |
| Relative Cost per Sample | Low | High (3-5x higher than 16S) |
| Data Analysis Complexity | Moderate (curated databases like SILVA, Greengenes) | High (requires extensive computational resources) |
| Typical Sequencing Depth | 10,000 - 50,000 reads/sample | 10 - 50 million reads/sample |
Experimental Protocol: Standard Workflow for Shotgun Metagenomic Analysis
Protocol Title: Comprehensive Fecal Metagenome Analysis for Taxonomic and Functional Profiling.
- Sample Lysis & DNA Extraction: Use a bead-beating mechanical lysis protocol (e.g., with a commercial kit like the QIAamp PowerFecal Pro DNA Kit) to ensure disruption of tough Gram-positive bacterial cell walls. Include negative extraction controls.
- DNA Quality Assessment: Quantify DNA using a fluorometric method (e.g., Qubit). Assess fragment size distribution via agarose gel electrophoresis or Bioanalyzer. Minimum requirement: >1 ng/µL, fragment size >500 bp.
- Library Preparation: Utilize a tagmentation-based library prep kit (e.g., Illumina DNA Prep) for fragmentation and adapter ligation. Use dual-index barcodes for multiplexing.
- Sequencing: Perform sequencing on an Illumina NovaSeq 6000 platform using a 2x150 bp paired-end configuration to achieve a minimum of 20 million read pairs per sample.
- Bioinformatics Analysis:
- Quality Control & Trimming: Use FastQC for quality assessment and Trimmomatic to remove adapters and low-quality bases.
- Host DNA Depletion: Align reads to the human reference genome (hg38) using Bowtie2 and remove matching reads.
- Taxonomic Profiling: Analyze non-host reads using Kraken2 with the Standard PlusPF database for ultrafast classification.
- Functional Profiling: Perform assembly of quality-filtered reads using MEGAHIT. Identify open reading frames (ORFs) with Prodigal and annotate against databases like eggNOG or KEGG using DIAMOND.
Visualization: Culture-Independent Analysis Workflow
Title: Workflow for Culture-Independent Microbial Community Analysis
The Scientist's Toolkit: Key Reagent Solutions for Metagenomics
Table 2: Essential Research Reagents for Metagenomic Sequencing
| Item | Function & Rationale |
|---|---|
| Bead-beating Tubes (e.g., Lysing Matrix E) | Contains a mixture of ceramic/silica beads for mechanical disruption of diverse, tough microbial cell walls in heterogeneous samples. |
| InhibitEX or similar resins | Binds and removes PCR inhibitors (e.g., humic acids, bile salts) common in stool and soil samples, preventing downstream assay failure. |
| Broad-Range DNA Extraction Kit (e.g., DNeasy PowerSoil Pro) | Optimized for maximal yield and purity from low-biomass or inhibitor-rich samples, ensuring representative community analysis. |
| Fragmentase or Tagmentation Enzyme Mix | Enzymatically fragments genomic DNA for shotgun library prep, creating uniformly sized inserts for efficient sequencing. |
| Dual-Index Barcode Adapters (e.g., Nextera XT) | Unique molecular identifiers for each sample, enabling high-level multiplexing and pooling for cost-effective sequencing runs. |
| Size Selection Beads (SPRI) | Magnetic beads for clean-up and precise selection of DNA fragment sizes, critical for optimizing library insert size and sequencing quality. |
| Mock Microbial Community DNA (e.g., ZymoBIOMICS) | Defined control standard containing known abundances of bacterial/fungal genomes, used to validate entire workflow accuracy and identify bias. |
Comparative Analysis: Culturable vs. Non-Culturable Microbial Assessment Methods
A critical challenge in microbiology is the significant disparity between the number of microbial cells observed under a microscope and those that can be grown in the laboratory—a phenomenon known as the Great Plate Count Anomaly. This guide compares traditional culturable methods with modern non-culturable approaches, framing them within a comparative analysis for drug discovery and environmental research.
Table 1: Method Comparison for Microbial Community Analysis
| Feature / Metric | Traditional Culturable Methods (e.g., Plate Count) | Culture-Independent Molecular Methods (e.g., 16S rRNA Amplicon Sequencing) | Single-Cell Genomics |
|---|---|---|---|
| Estimated % of Community Accessed | <1% (often 0.1-1%) | ~100% (theoretically all DNA is extracted) | Variable, but targets specific "uncultured" phyla |
| Throughput (Samples/Week) | Low (10s-100s) | Very High (1000s) | Medium (10s) |
| Key Output | Live, pure isolates for phenotyping | Taxonomic profile (relative abundance) | Draft genomes from single cells |
| Primary Limitation | Extreme cultivation bias; misses most diversity | Lacks live isolate; functional data inferred | Genome incompleteness; high cost & technical skill |
| Drug Development Utility | Essential for pathogenicity tests, antibiotic assays | Target identification, biomarker discovery, microbiome dysbiosis studies | Novel enzyme & biosynthetic pathway discovery from "dark matter" microbes |
Experimental Protocols
Protocol 1: High-Throughput Culturing Using Diffusion Chambers
- Objective: To cultivate previously "unculturable" bacteria by simulating natural substrate and diffusion conditions.
- Methodology:
- Sample Inoculation: A diluted environmental sample (e.g., soil suspension) is mixed with low-nutrient, low-agarose (~0.1%) medium.
- Chamber Assembly: The mixture is placed in a sterile diffusion chamber, sealed with membranes of a specific pore size (e.g., 0.03 µm).
- In Situ Incubation: The sealed chamber is placed back into the original environmental sample or a simulated habitat for incubation, allowing chemical exchange.
- Colony Recovery: After 2-8 weeks, the chamber is opened, and formed microcolonies are picked for transfer to conventional plates.
Protocol 2: 16S rRNA Gene Amplicon Sequencing (Meta-taxonomics)
- Objective: To profile total microbial community composition without cultivation bias.
- Methodology:
- Total DNA Extraction: Community DNA is extracted from a sample (soil, gut, water) using bead-beating and commercial kits.
- PCR Amplification: The hypervariable regions (e.g., V4) of the bacterial/archaeal 16S rRNA gene are amplified using universal primers with attached sequencing adapters.
- Library Prep & Sequencing: Amplicons are purified, indexed, pooled, and sequenced on a platform like Illumina MiSeq.
- Bioinformatics: Sequences are processed (quality filtering, clustering into Operational Taxonomic Units - OTUs, or Amplicon Sequence Variants - ASVs) and compared against reference databases (e.g., SILVA, Greengenes) for taxonomic assignment.
Visualizations
Title: The Great Plate Count Anomaly Workflow
Title: Integrated Research Strategy Flow
The Scientist's Toolkit: Key Research Reagent Solutions
| Reagent / Material | Function in Analysis |
|---|---|
| Gelrite (Gellan Gum) | A polysaccharide gelant used as a superior agar substitute for cultivating oligotrophic bacteria, providing clearer plates and different diffusion properties. |
| Humic Acid / Sodium Pyruvate | Common supplements added to culture media to quench reactive oxygen species, mitigating oxidative stress—a major factor in culturability. |
| Nuclepore Polycarbonate Membranes (0.03µm) | Critical for constructing diffusion chambers; allows passage of nutrients and signaling molecules while containing bacterial cells. |
| MagneSil KF Beads (Zirconia/Silica) | Used in mechanical lysis during DNA extraction from tough environmental samples (e.g., soil, feces) for maximal cell disruption. |
| Universal 16S rRNA Primers (e.g., 515F/806R) | Degenerate primer pairs targeting conserved regions to amplify variable regions from a broad range of bacteria/archaea for sequencing. |
| PCR Inhibitor Removal Reagents (e.g., PVPP, BSA) | Essential for removing humic acids, polyphenols, and other PCR inhibitors co-extracted with DNA from complex samples. |
| Flow Cytometry Cell Sorters | Enables high-throughput physical separation and sorting of single microbial cells from a community for downstream single-cell genomics. |
| Multiple Displacement Amplification (MDA) Kits | Used for whole-genome amplification of the minute DNA from a single sorted cell, generating sufficient material for sequencing. |
This guide compares the performance of culturable (traditional plating, enrichment) and non-culturable (metagenomic sequencing, qPCR, FISH) methods in studying three key microbial niches: environmental (e.g., soil, water), the human microbiome, and pathogenic communities. The analysis is framed within the thesis that non-culturable methods are indispensable for revealing the full diversity and function of microbial communities, which are predominantly unculturable, while culturable methods remain vital for obtaining isolates for experimental validation and functional study.
Performance Comparison Table
| Metric / Niche | Culturable Methods | Non-Culturable Methods | Superior Method |
|---|---|---|---|
| Environmental: Diversity Assessment | Recovers <1% of observable diversity. Culture bias favors fast-growing, copiotrophs. | Reveals near-complete phylogenetic and functional diversity via 16S rRNA gene and shotgun metagenomics. | Non-culturable |
| Environmental: Functional Insight | Provides direct, experimental proof of function from isolated strains. | Predicts metabolic potential and gene expression (metatranscriptomics) in situ. | Complementary |
| Human Microbiome: Taxonomic Profiling Speed & Scale | Low-throughput, slow (days to weeks). Misses anaerobic and host-dependent taxa. | High-throughput, rapid (sample to data in days). Comprehensive community snapshots. | Non-culturable |
| Human Microbiome: Strain-Level Resolution & Causation | Essential for defining individual strains, their genomes, and proving causal roles via Koch's postulates. | Strain-level resolution is challenging; primarily shows correlation, not causation. | Culturable |
| Pathogenic Communities: Detection Sensitivity | Can be low (requires viable, abundant cells). Slow for diagnostics (24-48 hrs minimum). | Extremely high (e.g., qPCR, NGS). Can detect single gene copies and non-viable pathogens. | Non-culturable |
| Pathogenic Communities: Antibiotic Susceptibility Testing (AST) | Gold standard (e.g., broth microdilution). Provides direct phenotypic data. | Genotypic prediction via resistance gene detection only; may not correlate with phenotype. | Culturable |
| Overall Cost & Technical Barrier | Lower per-sample cost. Requires standard microbiology lab. | Higher per-sample cost (sequencing). Requires bioinformatics expertise and infrastructure. | Varies by goal |
Experimental Data & Protocols
Experiment 1: Comparative Diversity Analysis in Soil
- Objective: Quantify the proportion of bacterial diversity captured by culturable methods versus 16S rRNA amplicon sequencing.
- Protocol:
- Sample Collection: Homogenize 10g of grassland soil in 95mL sterile phosphate-buffered saline (PBS).
- Culturable Analysis: Perform serial dilutions. Plate 100µL of 10⁻⁵ to 10⁻⁷ dilutions on R2A agar (for oligotrophs), TSA (for general heterotrophs), and specialized media. Incubate at 25°C for 7 days. Count colony-forming units (CFU/g), pick distinct morphotypes for 16S rRNA gene Sanger sequencing.
- Non-culturable Analysis: Extract total genomic DNA from 0.25g of the same soil using a bead-beating kit (e.g., DNeasy PowerSoil). Amplify the V4 region of the 16S rRNA gene with barcoded primers (515F/806R). Perform Illumina MiSeq sequencing (2x250bp). Process sequences via QIIME2/DADA2 to obtain Amplicon Sequence Variants (ASVs).
- Typical Data: Culturing yields 10⁶-10⁷ CFU/g, with 50-100 unique OTUs from colony sequencing. 16S amplicon sequencing yields 5,000-15,000 unique ASVs per gram of soil.
Experiment 2: Gut Microbiome Stability Assessment Post-Antibiotic
- Objective: Monitor community recovery after broad-spectrum antibiotic treatment.
- Protocol:
- Intervention: Administer a 7-day course of oral amoxicillin-clavulanate to a murine model.
- Sampling: Collect fecal pellets pre-treatment, on day 7, and at days 14, 21, and 28 post-treatment (n=5 mice/group).
- Culturable Analysis: Homogenize feces, plate on Bacteroides Bile Esculin agar, MacConkey agar, MRS agar (for lactobacilli), and blood agar anaerobically. Quantify CFU/g for specific functional groups.
- Non-culturable Analysis: Extract DNA from parallel samples. Perform shotgun metagenomic sequencing (Illumina NovaSeq). Use Kraken2/Bracken for taxonomic profiling and HUMAnN3 for functional pathway analysis.
- Typical Data: Culturing shows a 3-log reduction in total cultivable counts, with specific taxa like Lactobacillus spp. recovering by day 14. Metagenomics reveals a catastrophic loss of diversity (Shannon index drop from 3.5 to 1.2), persistence of antibiotic resistance genes, and a slow, incomplete return to baseline community structure by day 28, dominated by initially rare, resistant taxa.
Experiment 3: Pathogen Detection in Clinical Specimen
- Objective: Compare turnaround time and sensitivity for detecting Clostridioides difficile in diarrheal stool.
- Protocol:
- Sample: Suspected CDI patient stool sample.
- Culturable/Toxin Detection (Reference): Inoculate onto selective C. difficile agar (CDA) and incubate anaerobically at 37°C for 48h. Confirm isolates via colony morphology and MALDI-TOF MS. Perform cell culture cytotoxicity neutralization assay (CCNA) for toxin B detection (gold standard, takes 24-72h).
- Non-culturable Molecular Detection (Test): Extract DNA from stool. Perform real-time PCR (qPCR) targeting the tcdB toxin gene. Use commercial FDA-approved assay (e.g., Xpert C. difficile, Cepheid).
- Typical Data: qPCR provides a result in <1 hour with >95% sensitivity and specificity compared to CCNA. Culture on CDA requires 48h for isolation but is essential for obtaining the strain for ribotyping, antimicrobial susceptibility testing, and epidemiological studies.
Key Signaling Pathway: Host-Microbiome Crosstalk via TLR4
(Title: TLR4 Pathway in Microbial Immune Recognition)
Experimental Workflow: Integrated Culturomics & Metagenomics
(Title: Integrated 'Omics and Culture Workflow)
The Scientist's Toolkit: Research Reagent Solutions
| Reagent / Material | Function in Microbial Niche Research |
|---|---|
| Bead-beating Lysis Kits (e.g., DNeasy PowerSoil, FastDNA Spin Kit) | Mechanically disrupts robust environmental and Gram-positive bacterial cell walls for unbiased DNA extraction from complex samples. |
| Reduced Transport Fluid (RTF) & Anaerobic Chambers | Preserves viability of oxygen-sensitive anaerobes from human microbiome samples during processing for culturing. |
| Selective & Enrichment Media (e.g., CHROMagar, R2A, MacConkey) | Selects for specific microbial groups (pathogens, oligotrophs) from a mixed community, enabling targeted isolation. |
| PCR Inhibitor Removal Columns | Critical for clinical/environmental samples; removes humic acids, bile salts, etc., that inhibit downstream molecular assays. |
| Broad-host-range Phagemid Vectors (e.g., pBBR1 origin) | Allows genetic manipulation (gene knockout, complementation) in a wide array of newly cultured environmental isolates. |
| Stable Isotope Probing (SIP) Substrates (¹³C-glucose, ¹⁵NH₄Cl) | Links microbial identity to metabolic function in situ; active microbes incorporate heavy isotopes into their DNA/RNA. |
| MALDI-TOF MS Reagents & Databases | Enables rapid, low-cost identification of microbial isolates to species level based on protein mass fingerprinting. |
| MetaPolyzyme (Lysozyme, Mutanolysin, Lysostaphin, etc.) | Enzymatic cocktail for gentle but effective lysis of human/animal cells and microbes in host-associated samples for RNA-seq. |
From Petri Dish to PCR: Step-by-Step Workflows and Cutting-Edge Applications
Culturable methods remain a cornerstone of microbiology, enabling the study of live, proliferating cells. This guide compares core components of this workflow against non-culturable alternatives, framed within a thesis on comparative method analysis.
Media Design: Enriched vs. Minimal vs. Non-Culturable Direct Lysis
Media design is the foundational step that dictates which organisms can be studied. The choice directly impacts downstream phenotypic assays.
Table 1: Comparison of Media Types and Their Impact on Recovery
| Media Type / Method | Target Microbiota | Typical Recovery Yield (Bacteria) | Key Advantage | Primary Limitation |
|---|---|---|---|---|
| Enriched Media (e.g., Brain Heart Infusion) | Fast-growing, general heterotrophs | ~15-30% of total community | High biomass yield; supports diverse pathogens | Strong bias against slow-growers and fastidious organisms |
| Minimal/Selective Media (e.g., R2A, CHROMagar) | Specific physiological or taxonomic groups | ~1-10% of total community | Selects for specific traits (antibiotic resistance, metabolism) | Excludes vast majority of community; may stress cells |
| Non-Culturable Direct Lysis (e.g., Metagenomics) | Total community DNA | Theoretical 100% of DNA present | Unbiased genetic inventory; detects uncultured taxa | No live cells for downstream assays; DNA may not indicate viability |
Experimental Protocol: Media Comparison for Soil Microbiome
- Sample Preparation: Homogenize 1g of soil in 10mL phosphate-buffered saline (PBS).
- Serial Dilution: Perform ten-fold serial dilutions (10⁻¹ to 10⁻⁶) in PBS.
- Plating: Spread 100µL of each dilution onto (a) Tryptic Soy Agar (enriched), (b) R2A Agar (minimal), and (c) a specific selective agar (e.g., starch-casein for Actinobacteria).
- Incubation: Incubate plates at 25°C for 7 days (R2A) and 3 days (TSA).
- Analysis: Count colony-forming units (CFU/g). Extract and sequence 16S rRNA gene from pooled colonies from each media type and compare to direct metagenomic 16S sequencing from the same soil DNA extract.
Incubation: Standard vs. Extended vs. In situ vs. Molecular Incubation (PCR)
Incubation conditions are a critical variable in attempting to bridge the "great plate count anomaly."
Table 2: Incubation Strategy Comparison
| Incubation Strategy | Typical Duration | Temp Control | Key Feature | Compared to Direct Molecular |
|---|---|---|---|---|
| Standard Clinical | 24-48 hours | Fixed (e.g., 37°C) | Optimized for known pathogens | Misses >99% of environmental species |
| Extended/Simulated Natural | Weeks to months | Fluctuating, multi-temperature | Mimics native environment; recovers some "microbial dark matter" | Still limited; but yields live isolates for characterization |
| In situ Cultivation (e.g., diffusion chambers) | Weeks | In situ (native) | Nutrients from natural environment; recovers previously uncultured phyla | Closer to molecular diversity but extremely low throughput |
| Non-Culturable "Incubation" (qPCR/RT-PCR) | Hours | Thermal cycling | Quantifies gene copy number or gene expression from extracted nucleic acids | No viable cells produced; infers activity indirectly |
Experimental Protocol: Extended Incubation for Oligotrophs
- Media Preparation: Prepare 1:100 diluted TSA or soil extract agar in Petri dishes.
- Plating: Spread sample (e.g., marine sediment suspension) and allow to absorb.
- Sealing: Parafilm plates to prevent desiccation.
- Incubation: Incubate at 15°C (or relevant ambient temperature) for 12 weeks.
- Monitoring: Count emerging colonies weekly. Isolate colonies that appear after >4 weeks.
- Comparison: Perform 16S qPCR on the original sample and compare total CFU after 12 weeks to the total 16S gene count.
Isolation: Streaking vs. High-Throughput vs. Single-Cell Sorting vs. Genome Binning
The isolation step transitions from a mixed population to a pure strain, a feat non-culturable methods cannot achieve directly.
Table 3: Isolation Technique Comparison
| Isolation Technique | Purity Guarantee | Throughput | Success Rate for Fastidious Cells | Equivalent Non-Culturable "Isolation" |
|---|---|---|---|---|
| Serial Streaking | High (visual confirmation) | Low (manual) | Low; requires division on solid media | Cloning of 16S rRNA genes from a metagenome |
| High-Throughput Microdroplet | Medium (can be co-encapsulated) | Very High (10⁴-10⁶) | Medium; allows for co-culture signals | Microfluidic single-cell genome amplification |
| Flow Cytometry + Cell Sorting | Low-Medium (index sorting) | Medium (10³-10⁴/hour) | Very Low; cells often damaged or non-viable | In silico genome binning from metagenome-assembled genomes (MAGs) |
Experimental Protocol: High-Throughput Microdroplet Isolation
- Cell Suspension: Generate a dilute, single-cell suspension from an environmental sample.
- Droplet Generation: Use a microfluidic device to co-encapsulate single cells with liquid, low-nutrient medium in picoliter droplets.
- Incubation: Incubate the emulsion at room temperature for 2-4 weeks.
- Droplet Sorting: Use a flow cytometer to detect droplets showing increased fluorescence (via a metabolic dye, e.g., resazurin).
- Breaking & Recovery: Break sorted droplets, streak contents onto solid medium for confirmation.
Phenotypic Assays: Growth vs. Functional Profiling vs. Inferred from Genomics
Phenotypic assays on cultured isolates provide direct functional data, which is inferred statistically in non-culturable approaches.
Table 4: Phenotypic Assay Comparison: Direct vs. Inferred
| Assay Type (Culturable) | Measurement | Timeframe | Non-Culturable Predictive Equivalent | Concordance Rate |
|---|---|---|---|---|
| Antibiotic Susceptibility Testing (AST) | Zone of inhibition / MIC | 16-24 hours | Prediction from known resistance gene databases (e.g., CARD) | ~70-90% for known gene-phenotype pairs |
| Substrate Utilization (e.g., BIOLOG) | Colorimetric change | 24-72 hours | Prediction from annotated metabolic pathways in MAG | Variable (50-80%); fails for novel pathways |
| Motility Assay (Soft Agar) | Migration distance | 6-48 hours | Presence/absence of flagellar biosynthesis genes | High (>90%) for presence, poor for quantitative activity |
| Stress Tolerance (e.g., pH, Osmolarity) | Growth yield/rate | 24-72 hours | Inference from transporter and stress response gene content | Often poor (<50%); complex emergent phenotype |
Experimental Protocol: Phenotypic Microarray (BIOLOG) vs. Genomic Prediction
- Cultured Isolate: Grow target bacterial isolate to log phase in low-nutrient broth.
- Phenotypic Array: Inoculate into GEN III BIOLOG plates. Incubate at 28°C for 48-96 hours, measuring tetrazolium dye reduction hourly in a plate reader.
- Genomic Sequencing: Extract and sequence the isolate's genome.
- In silico Prediction: Annotate the genome using RAST or KEGG. Predict carbon source utilization pathways.
- Comparison: Create a binary (positive/negative) table for 50 carbon sources. Calculate the percentage agreement between the phenotypic result and the genomic prediction.
The Scientist's Toolkit: Research Reagent Solutions
| Item | Function in Culturable Workflow | Key Consideration vs. Non-Culturable |
|---|---|---|
| Gelling Agent (Agar/Gelrite) | Provides solid surface for colony isolation. | Not used in molecular methods; replaced by magnetic beads for DNA cleanup. |
| Selective Antimicrobials | Suppresses unwanted background growth for target isolation. | In molecular work, inhibitors (e.g., PMA) distinguish viable from dead cells. |
| Metabolic Dyes (e.g., Resazurin, CTC) | Indicates cellular respiration and viability in colonies or liquid culture. | In molecular assays, viability is inferred via markers like ribosomal RNA integrity. |
| Defibrinated Blood/Serum | Enrichment media component for fastidious pathogens. | In metatranscriptomics, host RNA depletion kits serve an analogous "enrichment" function for microbial reads. |
| Quorum Sensing Molecules (e.g., AHLs) | Added to media to induce growth of communication-dependent bacteria. | Non-culturable metagenomics can detect AHL synthase genes but cannot test their functional requirement. |
| Membrane Filters (0.22µm) | Sterilize heat-sensitive media components. | Used in molecular work for size-fractionation of community members (e.g., viral vs. cellular). |
Workflow and Pathway Diagrams
Title: Comparative Culturable vs Non-Culturable Workflow
Title: Media Design and Method Selection Decision Tree
Within the thesis on Comparative analysis of culturable vs non-culturable methods research, culture-independent molecular techniques are indispensable for revealing the composition, functional potential, and active functions of microbial communities. This guide compares three cornerstone approaches: amplicon sequencing, shotgun metagenomics, and metatranscriptomics.
Comparative Performance and Experimental Data
The following table summarizes the core attributes, performance metrics, and optimal use cases for each method, based on current experimental literature.
Table 1: Comparison of Non-Culturable Molecular Toolkit Methods
| Feature | 16S/18S/ITS Amplicon Sequencing | Shotgun Metagenomics | Metatranscriptomics |
|---|---|---|---|
| Target | Specific hypervariable regions of rRNA genes (16S for bacteria/archaea, 18S/ITS for fungi/eukaryotes) | Total genomic DNA (all organisms) | Total community RNA (primarily mRNA) |
| Primary Output | Taxonomic profile (relative abundance) | Taxonomic profile + functional gene catalog (potential) | Gene expression profile (active functions) |
| Resolution | Genus to species-level (rarely strain-level) | Species to strain-level, can assemble genomes (MAGs) | Activity of detected genes/pathways |
| Quantitative Nature | Semi-quantitative (relative abundance; PCR bias) | Semi-quantitative for taxa; quantitative for gene presence | Quantitative for gene expression (with caveats of RNA stability) |
| Key Metric | Alpha/Beta diversity, taxonomic composition | Functional pathway completeness, ARG abundance, MAG quality | Transcripts Per Million (TPM), differentially expressed genes |
| Typical Sequencing Depth | 50,000 - 100,000 reads/sample (MiSeq) | 20 - 100 million reads/sample (NovaSeq/HiSeq) | 50 - 100 million reads/sample (NovaSeq/HiSeq) |
| Cost per Sample | $50 - $200 | $500 - $2000+ | $700 - $2500+ |
| Major Limitation | Functional inference is indirect and limited; PCR amplification biases | Does not distinguish between expressed and non-expressed genes; host DNA contamination | RNA is labile; difficult to assign activity to specific taxa; high computational demand |
| Best For | Community composition surveys, rapid biodiversity assessment, clinical diagnostics. | Discovering novel genes, metabolic pathway reconstruction, strain tracking, virulence/resistance profiling. | Understanding community response to stimuli, active biogeochemical processes, identifying key expressed pathways. |
Supporting Experimental Data: A 2023 study on inflammatory bowel disease (IBD) gut microbiota (Nature Communications) illustratively applied all three methods. 16S sequencing confirmed dysbiosis (reduced Faecalibacterium diversity). Metagenomics identified an increased abundance of specific sulfite-reducer gene clusters in IBD patients. Metatranscriptomics revealed these pathways were highly transcribed during active disease flares, directly linking a metabolic function to disease activity—a finding impossible with amplicon or metagenomic data alone.
Detailed Experimental Protocols
Protocol 1: 16S rRNA Gene Amplicon Sequencing (Illumina MiSeq)
- DNA Extraction: Use a bead-beating mechanical lysis kit (e.g., DNeasy PowerSoil Pro) for robust cell wall disruption.
- PCR Amplification: Amplify the V3-V4 hypervariable region using primers 341F/806R with overhang adapters. Use a high-fidelity polymerase and minimum PCR cycles (e.g., 25-30).
- Library Preparation: Index via a limited-cycle PCR using Nextera XT indices. Clean up with magnetic beads.
- Sequencing: Pool libraries, quantify, and sequence on a MiSeq system with 2x300 bp v3 chemistry.
- Bioinformatics: Process with QIIME 2 or DADA2 for denoising, chimera removal, and ASV/OTU generation. Assign taxonomy via Silva or Greengenes database.
Protocol 2: Shotgun Metagenomic Sequencing
- High-Input DNA Extraction: Use kits designed for high molecular weight DNA (e.g., MagAttract HMW DNA Kit). Quantify via Qubit and check integrity via gel electrophoresis.
- Library Preparation: Fragment DNA via acoustic shearing (Covaris) to ~550 bp. Perform end-repair, A-tailing, and ligation of Illumina adapters. Include size selection step (SPRIselect beads).
- Sequencing: Pool libraries and sequence on a NovaSeq 6000 system (SP flow cell) for 2x150 bp reads, targeting ≥10 Gb per sample.
- Bioinformatics: Quality trim (Trimmomatic), remove host reads (Bowtie2 against host genome). Perform taxonomic profiling (Kraken2/Bracken) and functional profiling via assembly (MEGAHIT/ metaSPAdes) followed by gene calling (Prodigal) and annotation (eggNOG-mapper, KEGG).
Protocol 3: Metatranscriptomic Sequencing
- RNA Preservation & Extraction: Immediately stabilize samples in RNAlater. Extract total RNA using a kit with rigorous DNase treatment (e.g., RNeasy PowerMicrobiome Kit).
- RNA QC & rRNA Depletion: Assess RNA Integrity Number (RIN >7). Deplete ribosomal RNA using probe-based kits (e.g., Illumina Ribo-Zero Plus).
- Library Preparation: Convert enriched mRNA to cDNA (SMARTer stranded kit), followed by library construction with unique dual indexing.
- Sequencing: Sequence deeply on NovaSeq 6000 (2x150 bp), targeting 50-100 million read pairs per sample.
- Bioinformatics: Trim adapters, remove residual rRNA reads (SortMeRNA). Align to metagenomic assemblies (if available) or directly to reference genomes/databases (Kallisto/Salmon). Calculate TPM values and perform differential expression analysis (DESeq2).
Visualizations
Title: Non-Culturable Method Workflow Comparison
Title: Method Selection Decision Tree
The Scientist's Toolkit: Essential Research Reagent Solutions
Table 2: Key Reagents and Kits for Non-Culturable Studies
| Item | Function | Example Product |
|---|---|---|
| Stabilization Solution | Preserves in situ nucleic acid ratios and prevents degradation during storage/transport. | RNAlater, DNA/RNA Shield |
| Bead-Beating Lysis Kit | Mechanically disrupts diverse cell walls (Gram+, spores, fungi) for unbiased extraction. | DNeasy PowerSoil Pro, MagNA Lyser kits |
| High-Fidelity PCR Polymerase | Reduces amplification errors during library prep and amplicon generation. | Q5 High-Fidelity DNA Polymerase, KAPA HiFi |
| Dual Indexed Adapters | Allows multiplexing of hundreds of samples in a single sequencing run with minimal index hopping. | Illumina Nextera XT, IDT for Illumina UD Indexes |
| Ribosomal RNA Depletion Kit | Selectively removes abundant rRNA from total RNA to enrich for messenger RNA (mRNA). | Illumina Ribo-Zero Plus, QIAseq FastSelect |
| SPRIselect Beads | Performs size selection and cleanup of DNA/cDNA libraries; critical for insert size control. | Beckman Coulter SPRIselect |
| Metagenomic Standard | Provides a known control community to assess extraction bias, sequencing accuracy, and bioinformatic pipeline performance. | ZymoBIOMICS Microbial Community Standard |
Within the paradigm of comparative analysis between culturable and non-culturable diagnostic methods, targeted molecular detection represents a cornerstone of modern microbiological and genetic research. Quantitative PCR (qPCR), digital PCR (dPCR), and Fluorescence In Situ Hybridization (FISH) are pivotal, non-culturable techniques for the specific identification and quantification of pathogens or genetic markers. This guide provides an objective comparison of their performance, supported by experimental data, for researchers and drug development professionals.
Performance Comparison & Experimental Data
The following table summarizes key performance metrics for qPCR, dPCR, and FISH based on recent studies investigating pathogen detection (e.g., Mycobacterium tuberculosis, SARS-CoV-2, or specific antibiotic resistance genes).
Table 1: Comparative Performance of Targeted Detection Methods
| Feature | qPCR (Probe-based) | dPCR (Droplet or Chip-based) | FISH (with CARD or PNA probes) |
|---|---|---|---|
| Primary Function | Quantitative, relative/absolute quantification | Absolute quantification without standard curves | Spatial, visual localization within cells/tissue |
| Sensitivity | High (≥10 copies/µL) | Very High (1-5 copies/µL) | Moderate to High (requires high target abundance) |
| Specificity | High (dual primers + probe) | Very High (endpoint detection, reduces false positives) | High (probe design, use of helpers) |
| Precision & Accuracy | High variability at low target concentrations (<10 copies) | Superior precision at low concentrations; resistant to PCR inhibitors | Qualitative/Semi-quantitative; accuracy depends on sample prep |
| Throughput | High (96-384 well plates) | Moderate (limited partition number) | Low (manual microscopy) to Moderate (automated) |
| Time to Result | ~1.5 - 3 hours | ~3 - 5 hours (includes partitioning + PCR) | ~2 - 8 hours (including hybridization) |
| Quantification Output | Ct value; relative or absolute via standard curve | Absolute copy number/µL | Fluorescence intensity; cell count |
| Key Advantage | Speed, high throughput, established protocols | Absolute quantification, unmatched precision for low-abundance targets | Morphological context, identifies viable/non-culturable cells |
| Key Limitation | Requires standard curve for absolute quantification; inhibitor sensitive | Higher cost per sample, lower throughput | Semi-quantitative, challenging for low-copy RNA targets |
Supporting Data: A 2023 study comparing methods for detecting the mecA gene (MRSA) in spiked serum samples reported:
- qPCR: Limit of Detection (LoD) = 15 copies/µL, CV = 25% at 20 copies/µL.
- dPCR: LoD = 3 copies/µL, CV = 8% at 20 copies/µL.
- FISH: Successfully identified 85% of cells with >5 mecA mRNA transcripts per cell, but failed below this threshold.
Detailed Experimental Protocols
Protocol 1: Probe-based qPCR for Viral Pathogen Detection
- Nucleic Acid Extraction: Use a commercial silica-membrane kit. Elute in 50-100 µL of nuclease-free water.
- Primer/Probe Design: Design primers and a dual-labeled hydrolysis probe (e.g., FAM/BHQ1) targeting a conserved region of the viral genome.
- Reaction Setup: Prepare a 20 µL mix containing 1x master mix, 400 nM each primer, 200 nM probe, and 5 µL of template.
- Thermocycling: Run on a real-time cycler: 95°C for 3 min, followed by 45 cycles of 95°C for 15 sec and 60°C for 1 min (data acquisition).
- Analysis: Generate a standard curve from serially diluted gBlock fragments of known concentration. Determine unknown sample concentration from the Ct value.
Protocol 2: Droplet Digital PCR (ddPCR) for Rare Mutation Detection
- Partitioning: Mix 20 µL of PCR reaction (similar to qPCR mix, but with EvaGreen dye or probe) with 70 µL of droplet generation oil in a droplet generator to create ~20,000 nanoliter-sized droplets.
- PCR Amplification: Transfer droplets to a 96-well plate. Seal and run endpoint PCR: 95°C for 10 min, 40 cycles of 94°C for 30 sec and 60°C for 1 min, then 98°C for 10 min (ramp rate: 2°C/sec).
- Reading: Place plate in a droplet reader. It flows droplets single-file past a fluorescence detector.
- Analysis: Using Poisson statistics, the software counts fluorescence-positive vs. negative droplets to provide an absolute copy number per input volume (copies/µL).
Protocol 3: CARD-FISH for Environmental, Non-culturable Bacteria
- Fixation & Permeabilization: Fix sample (water, biofilm) with formaldehyde (3% final, 1-3h). Filter onto membrane. Dehydrate in ethanol.
- Hybridization: Apply horseradish peroxidase (HRP)-labeled oligonucleotide probe specific to target 16S rRNA. Incubate at 46°C for 2-3 hours in a humid chamber.
- Washing: Wash filter to remove unbound probe in pre-warmed buffer at 48°C for 15-20 min.
- Signal Amplification: Incubate filter with Tyramide conjugated to a fluorophore (e.g., Cy3) and H₂O₂. The HRP catalyzes localized tyramide deposition, amplifying fluorescence.
- Counterstaining & Microscopy: Stain with DAPI. View under epifluorescence microscope. Target cells appear bright with the fluorophore color, all cells are blue from DAPI.
Visualizations
Title: Workflow Comparison of qPCR, dPCR, and FISH Methods
Title: Sensitivity Comparison at Low Target Concentration
The Scientist's Toolkit: Research Reagent Solutions
Table 2: Essential Reagents and Materials for Targeted Detection
| Item | Function | Key Considerations |
|---|---|---|
| High-Fidelity DNA Polymerase | Amplifies target sequence with minimal error rates. Critical for both qPCR and dPCR. | Hot-start variants reduce primer-dimers. Check compatibility with probe chemistry. |
| Dual-Labeled Hydrolysis Probes (TaqMan) | Provides sequence-specific detection in qPCR. Fluorophore (FAM) and quencher (BHQ) are cleaved during amplification, releasing fluorescence. | Design Tm 8-10°C higher than primers. Avoid G at 5' end. |
| EvaGreen Dye | Intercalating dye for dPCR or melt curve analysis. Binds double-stranded DNA, fluorescing. | Can bind non-specific products. Requires careful optimization of primer specificity. |
| Droplet Generation Oil / Chips | Creates stable, monodisperse partitions for dPCR. | Oil must be matched to the surfactant and instrument. Chip quality affects partition uniformity. |
| HRP-Labeled Oligonucleotide Probes | The core of CARD-FISH. The HRP enzyme catalyzes signal amplification upon hybridization. | Probe design is critical for specificity and accessibility to rRNA target sites. |
| Tyramide Signal Amplification (TSA) Reagents | Amplifies FISH signal. Contains tyramide-fluorophore and H₂O₂. HRP produces reactive tyramide radicals that deposit locally. | Concentration and incubation time must be optimized to prevent excessive background. |
| Nuclease-Free Water & Tubes | Prevents degradation of nucleic acids and reagents in sensitive reactions. | Essential for low-copy-number work. Use low-retention tubes for dPCR to minimize sample loss. |
| Positive Control Template (gBlocks, Plasmid) | Contains exact target sequence. Used for standard curves (qPCR), LoD determination, and protocol validation. | Ensure it spans the entire amplicon. Quantify accurately via spectrophotometry. |
Comparative Analysis in Culturable vs. Non-Culturable Methodologies
The persistent challenge in microbial research lies in the fact that an estimated 60-99% of microorganisms resist cultivation under standard laboratory conditions. This divide between culturable and non-culturable methods fundamentally shapes approaches in drug discovery, microbiome therapeutics, and diagnostics. This guide provides a comparative analysis of key technologies and their performance data.
Performance Comparison: 16S rRNA Sequencing vs. Culturomics
The following table summarizes a comparative analysis of two predominant methods for microbial community profiling, highlighting the complementary nature of these approaches.
Table 1: Comparative Performance of Non-Culturable (16S rRNA Seq) vs. High-Throughput Culturing (Culturomics)
| Metric | 16S rRNA Gene Sequencing (Non-Culturable) | High-Throughput Culturomics (Culturable) |
|---|---|---|
| Taxonomic Resolution | Genus to species level (via full-length seq); strain-level limited. | Species to strain level; enables isolate collection. |
| Functional Insight | Inferred from databases; no direct functional data. | Direct experimental access to phenotype, metabolism, and pathogenicity. |
| Bias & Coverage | Primer bias; detects dominant populations; misses rare taxa. | Medium bias; recovers organisms adapted to growth media. |
| Throughput & Speed | High-throughput, results in days. | Lower throughput, requires weeks for growth and identification. |
| Key Output | Community composition and diversity metrics. | Live, genetically manipulable isolates for experimentation. |
| Cost per Sample | ~$50 - $300 | ~$500 - $2000+ (media, automation) |
| Applicability to Drug Discovery | Target identification via correlation; no direct assay. | Direct screening of isolates for antibiotic production or susceptibility. |
Experimental Protocol: Integrated Culturomic & Metagenomic Workflow
This protocol details a method for linking culture-dependent and independent analysis to maximize microbial recovery and functional characterization.
Title: Integrated Culturomic-Metagenomic Pipeline for Strain Isolation and Validation.
Objective: To isolate key bacterial strains from a complex sample (e.g., gut microbiome) and validate their abundance and genetic context within the native community.
Materials:
- Sample: Fecal material, suspended in anaerobic PBS with 20% glycerol.
- Media: A panel of 10-20 rich and selective media, pre-reduced for anaerobes (e.g., GAM, BHI, YCFA).
- Equipment: Anaerobic chamber, automated colony picker (e.g., QPix), MALDI-TOF MS, Next-Gen Sequencer.
- Reagents: DNA extraction kits (for isolates and community), PCR reagents, 16S rRNA primers.
Procedure:
- Sample Processing: Homogenize sample anaerobically. Split into two aliquots.
- Culturomics Arm: a. Perform serial dilutions and spread aliquots on all media types. b. Incubate anaerobically at 37°C for up to 14 days, monitoring daily. c. Pick every morphologically distinct colony. Subculture for purity. d. Identify isolates via MALDI-TOF MS and/or 16S rRNA Sanger sequencing.
- Metagenomic Arm (Non-Culturable): a. Extract total DNA from the second sample aliquot. b. Perform shotgun metagenomic sequencing (Illumina NovaSeq, 2x150bp). c. Assemble reads and bin contigs into Metagenome-Assembled Genomes (MAGs).
- Integration & Validation: a. Compare the 16S sequences of isolates against the metagenomic data. b. Map reads from the community DNA back to the assembled genome of a recovered isolate to estimate its in-situ abundance. c. Identify genetic pathways (e.g., for novel antibiotic synthesis) in the isolate genome and screen for their presence in related MAGs.
Title: Integrated Culturomic-Metagenomic Pipeline
The Scientist's Toolkit: Essential Reagents & Solutions
Table 2: Key Research Reagent Solutions for Microbiome & Drug Discovery
| Item | Function in Research |
|---|---|
| Anaerobe-Specific Growth Media (e.g., YCFA, GAM) | Mimics in-vivo conditions to cultivate fastidious gut microbes by providing precise nutrient and redox profiles. |
| Glycerol Cryopreservation Solution (20-30%) | Maintains long-term viability of isolated strains in biobanks for future phenotypic screening and characterization. |
| Magnetic Bead-Based DNA Extraction Kits | Provides high-yield, inhibitor-free DNA from complex samples (stool, soil) for reliable downstream sequencing. |
| Reduced PBS with DTT & Resazurin | Acts as an anaerobic sample transport and dilution buffer; resazurin indicates oxygen contamination. |
| Broad-Range 16S rRNA PCR Primers (27F/1492R) | Enables amplification and Sanger sequencing of the near-full-length 16S gene for precise isolate identification. |
| Cell Lysis Reagents for Metatranscriptomics (e.g., QIAzol) | Immediately stabilizes RNA, preserving the gene expression profile of the microbiome at the moment of sampling. |
| High-Throughput Screening Assay Kits (e.g., ATP-based viability) | Allows rapid phenotypic screening of compound libraries against live, cultured isolates for antibiotic discovery. |
Signaling Pathway: Microbial Metabolite Modulating Host Drug Response
Microbiome-derived metabolites can directly influence host physiology and drug efficacy, a key consideration in therapeutic development.
Title: Microbiome Metabolite Impact on Host Drug Response
Overcoming Bias and Noise: Optimization Strategies for Robust Microbial Data
This guide provides a comparative analysis of traditional culture-based methods against modern molecular and viability-based techniques for microbial detection. Framed within a thesis on comparative analysis of culturable vs non-culturable methods, it evaluates performance in contexts dominated by fastidious organisms, viable but non-culturable (VBNC) states, and culture media limitations. The data is critical for researchers, scientists, and drug development professionals who must choose appropriate methods for pathogen detection, microbiome studies, and sterility testing.
Performance Comparison: Culture vs. Non-Culture Methods
The following table summarizes experimental data from recent comparative studies evaluating different microbial detection approaches.
| Method | Target Application | Detection Time | Sensitivity (CFU/mL or Equivalent) | Ability to Detect VBNC | Ability to Detect Fastidious Species | Key Limitation |
|---|---|---|---|---|---|---|
| Traditional Culture (TSA/SBA) | Broad-spectrum culturable bacteria | 24-72 hours | 10^1 - 10^2 | No | Poor (requires specific supplements) | Misses >99% of environmental microbes, media bias |
| Enriched Culture (Blood Culture, Chocolate Agar) | Fastidious pathogens (e.g., Haemophilus, Neisseria) | 48 hours - 2 weeks | 10^0 - 10^1 | No | Good for targeted species | Lengthy, still misses VBNC and unculturable |
| qPCR (16S rRNA gene) | Total bacterial load (DNA-based) | 2-4 hours | 10^0 - 10^1 genomic copies | No (detects dead and live) | Excellent | Cannot distinguish viability |
| Viability qPCR (PMA/EMA dye) | Viable bacteria (DNA from intact cells) | 3-5 hours | 10^1 - 10^2 viable cells | Yes (partially) | Excellent | Dye penetration issues can cause false negatives |
| Flow Cytometry with Viability Stains | Single-cell viability counts | 30-60 mins | 10^2 - 10^3 cells/mL | Yes | Excellent (stain-based) | Requires specialized equipment, low sensitivity limit |
| Metagenomic Sequencing (Shotgun) | Comprehensive taxonomic profiling | 1-3 days (post-library prep) | Varies by depth | No (DNA-based) | Excellent | Expensive, complex data analysis, no standard viability |
Detailed Experimental Protocols
Protocol 1: Comparative Recovery of Fastidious Respiratory Pathogens
Aim: To compare the recovery rates of Legionella pneumophila, Bordetella pertussis, and Mycoplasma pneumoniae from spiked simulated respiratory samples. Methods:
- Sample Preparation: Simulate respiratory matrix using synthetic mucus. Spike with known concentrations (10^0 to 10^5 CFU/mL) of each target organism.
- Culture Methods:
- Legionella: Plate on BCYE agar (Buffered Charcoal Yeast Extract). Incubate at 35°C in 2.5% CO2 for up to 7 days.
- Bordetella: Plate on Regan-Lowe charcoal agar. Incubate at 35°C for up to 10 days.
- Mycoplasma: Plate on SP4 agar. Incubate at 37°C in 5% CO2 for up to 21 days.
- Molecular Method: Extract total DNA. Perform species-specific TaqMan qPCR assays targeting mip (Legionella), IS481 (Bordetella), and P1 adhesin (Mycoplasma) genes.
- Viability Staining: Treat aliquots with Propidium Monoazide (PMA) followed by DNA extraction and qPCR (vPCR).
- Data Analysis: Calculate recovery efficiency (%) and limit of detection (LOD) for each method-organism pair.
Protocol 2: Induction and Detection of VBNC State inE. coli
Aim: To induce the VBNC state and compare detection by culture, standard qPCR, and viability qPCR. Methods:
- VBNC Induction: E. coli O157:H7 culture is subjected to low-temperature starvation (4°C in sterile saline) for 8 weeks. Plate counts weekly to confirm loss of culturability.
- Sample Analysis (at T=0 and T=8 weeks):
- Culture: Spread plating on MacConkey agar.
- Total qPCR: DNA extraction followed by qPCR for the stx2 gene.
- Viability qPCR (PMAxx dye): Treat sample with 50 µM PMAxx, incubate in dark for 10 min, expose to blue LED light for 15 min, then extract DNA and perform qPCR.
- Flow Cytometry: Stain with SYBR Green I and Propidium Iodide (PI) to enumerate total (green) and membrane-compromised (red) cells.
- Validation: Use resuscitating agents (e.g., addition of pyruvate) to attempt recovery of VBNC cells.
Visualizing Method Selection and Workflows
Diagram Title: Decision Workflow for Microbial Detection Methods
Diagram Title: VBNC State Induction and Detection Pathways
The Scientist's Toolkit: Research Reagent Solutions
| Reagent/Material | Function in Experimentation | Key Consideration |
|---|---|---|
| Propidium Monoazide (PMA) / EMA | Viability dye; penetrates compromised membranes, crosslinks DNA upon photoactivation to inhibit PCR amplification from dead cells. | EMA can penetrate some live Gram-positive cells; PMAxx is an improved derivative with higher efficiency. |
| BCYE Agar (Buffered Charcoal Yeast Extract) | Enriched, selective medium for isolating Legionella species. Contains L-cysteine and iron. | Essential for fastidious Legionella; standard nutrient agar will not support growth. |
| Regan-Lowe Charcoal Agar | Semi-selective medium for Bordetella pertussis. Contains charcoal to absorb toxins. | Requires cephalexin supplement to inhibit normal flora; slow growth (≥5 days). |
| SP4 Agar & Broth | Highly enriched, serum-containing medium for cultivation of Mycoplasma and Spiroplasma. | Critical for these cell wall-deficient bacteria; incubation times can exceed 30 days. |
| SYBR Green I / Propidium Iodide (PI) | Nucleic acid stains for flow cytometry. SYBR stains all cells, PI stains only membrane-damaged cells. | Allows differentiation of intact (live) vs. compromised (dead) cells in a population. |
| Universal PreAmp Master Mix | Used for whole genome amplification prior to targeted qPCR, increasing sensitivity for low-biomass samples. | Can introduce bias; essential for detecting organisms present below the standard qPCR LOD. |
| Gifu Anaerobic Medium (GAM) Broth | Complex, highly nutrient broth for cultivating anaerobic and microaerophilic fastidious organisms. | Used for gut microbiome culturomics to expand the range of recoverable species. |
Within the broader thesis of comparative analysis of culturable versus non-culturable methods in microbial research, sequencing technologies are pivotal. This guide compares key platforms and their performance in addressing the core challenges inherent to sequencing-based profiling of complex samples, such as those from environmental or human microbiome studies.
Comparative Performance of Sequencing Platforms
Table 1: Platform Comparison for Key Sequencing Challenges
| Challenge / Platform | Illumina MiSeq | Oxford Nanopore MinION | PacBio HiFi |
|---|---|---|---|
| Contamination Risk | Moderate (library prep intensive) | High (flow cell sensitivity) | Low (SMRT cell) |
| PCR Bias | High (PCR-amplified libraries) | Low (PCR-free possible) | Low (circular consensus) |
| Bioinformatics Complexity | Moderate (established pipelines) | High (basecalling, error correction) | Moderate (HiFi-specific tools) |
| Cost per Gb (USD)* | ~$120 | ~$50 | ~$25 |
| Typical Read Length | 2x300 bp | 10-50 kb | 10-25 kb |
| Best Application | High-accuracy amplicon (16S) | Rapid long-read metagenomics | High-fidelity genome assembly |
Note: Approximate list prices as of recent market surveys; actual cost varies by throughput and region.
Experimental Protocols for Comparison
Protocol 1: 16S rRNA Gene Amplicon Sequencing (Illumina)
Objective: To assess bacterial community diversity and composition.
- DNA Extraction: Use a bead-beating kit (e.g., PowerSoil) for mechanical lysis.
- PCR Amplification: Amplify the V3-V4 hypervariable region using barcoded primers (e.g., 341F/805R). Use a proofreading polymerase and limit cycles (≤30).
- Library Prep: Clean amplicons, index with dual indices, and pool equimolarly.
- Sequencing: Load onto MiSeq with v3 chemistry for 2x300 bp paired-end reads.
- Bioinformatics: Process with QIIME 2 or mothur: demultiplex, denoise (DADA2), assign taxonomy (Silva database), and analyze diversity.
Protocol 2: Shotgun Metagenomic Sequencing (PCR-free, Long-Read)
Objective: To obtain strain-level resolution and functional potential with minimal amplification bias.
- High-MW DNA Extraction: Use gentle lysis and column-based purification (e.g., Nanobind CBB Big DNA Kit).
- Library Preparation:
- Nanopore: Use ligation sequencing kit (SQK-LSK114) without PCR step. Load onto a MinION R10.4.1 flow cell.
- PacBio: Prepare SMRTbell library with enzymatic fragmentation for ~15kb insert size. Sequence on Sequel IIe system with HiFi mode.
- Bioinformatics:
- Nanopore: Basecall with Guppy, filter reads, correct errors (Canu), and analyze with MetaFlye or MMseqs2.
- PacBio HiFi: Classify reads directly with tools like sourmash or assemble with metaMDBG.
Visualizations
Title: Sequencing Workflow Divergence from Sample to Data
Title: Core Sequencing Challenges Impacting Characterization
The Scientist's Toolkit: Research Reagent Solutions
Table 2: Essential Materials for Sequencing-Based Microbiome Studies
| Item | Function | Example Product |
|---|---|---|
| Bead-Beating Lysis Kit | Mechanical disruption of tough microbial cell walls for unbiased DNA extraction. | Qiagen PowerSoil Pro Kit |
| Proofreading DNA Polymerase | High-fidelity amplification to reduce errors during PCR-based library prep. | NEB Q5 Hot Start Polymerase |
| PCR Inhibitor Removal Beads | Binds humic acids and other inhibitors common in environmental/clinical samples. | Zymo Research OneStep PCR Inhibitor Removal |
| Magnetic Bead Cleanup | For size selection and purification of DNA fragments during library construction. | SPRIselect Beads (Beckman Coulter) |
| PCR-Free Library Prep Kit | Generates sequencing libraries without amplification, eliminating PCR bias. | Illumina DNA Prep, (M) Tagmentation |
| Mock Community DNA | Defined mix of genomic DNA from known species; essential for benchmarking. | ZymoBIOMICS Microbial Community Standard |
| Negative Control Extraction Kit | Reagents for processing a blank sample to identify reagent/lab contamination. | "Blank" extraction controls included in kits |
Within the broader thesis on Comparative analysis of culturable vs non-culturable methods research, a central challenge is the "great plate count anomaly," where a vast majority of microbial diversity remains uncultured. This guide objectively compares two modern paradigms for overcoming this barrier: High-Throughput Culturomics (automated, multi-condition screening) and Mimicking Natural Environments (in-situ simulators and microfluidics). Their performance is evaluated based on key metrics crucial for drug discovery and microbiological research.
Performance Comparison Table
The following table compares the core performance metrics of the two cultivation optimization approaches.
Table 1: Comparative Performance of Cultivation Optimization Strategies
| Metric | High-Throughput Culturomics | Mimicking Natural Environments |
|---|---|---|
| Primary Goal | Maximize number of distinct isolates from a sample. | Cultivate organisms with strict ecological dependencies. |
| Throughput | Very High (1000s of conditions/plates per run). | Low to Medium (limited by device complexity). |
| Isolate Diversity | Broad, but often biases against fastidious organisms. | Narrower but unique, recovers "unculturable" taxa. |
| Key Technology | Robotic liquid handling, MALDI-TOF MS, Omnilog. | Diffusion chambers (ichip), microfluidic chips, bioreactors. |
| Environmental Fidelity | Low; uses rich, defined media in artificial arrays. | High; incorporates chemical gradients, community signals, and native substrates. |
| Downstream Utility | Excellent for biobanking, phenotypic screening. | Critical for studying microbe-microbe interactions and novel metabolites. |
| Typical Novelty Rate | ~10-25% novel species. | Can exceed 50% novel species or even genera. |
| Scalability & Cost | High initial capital cost, lower per-isolate cost at scale. | Lower throughput, higher per-device effort, challenging to scale. |
Experimental Protocols
Protocol 1: High-Throughput Culturomics for Fecal Microbiota
- Sample Preparation: Homogenize fecal sample in anaerobic PBS. Perform serial dilution.
- Automated Plating: Use a robotic liquid handler to inoculate 100µl of each dilution onto 192 distinct pre-dispensed media formulations in 96-well plates. Media vary in carbon sources, osmolytes, and inhibitors.
- Incubation: Incubate plates anaerobically and aerobically at 37°C for up to 30 days.
- High-Throughput Picking: An automated colony picker selects wells showing growth, transferring cells to fresh medium for purification.
- Rapid Identification: Isolates are identified via high-throughput MALDI-TOF MS profiling against custom databases. Novel isolates are flagged for 16S rRNA gene sequencing.
Protocol 2: In Situ Cultivation using an iChip (Isolation Chip)
- Device Preparation: Assemble the iChip, consisting of hundreds of miniature diffusion chambers.
- Cell Inoculation: Dilute an environmental sample (e.g., soil suspension) to approximately one cell per chamber and inject it into the iChip.
- Sealing & Deployment: Seal the chambers with semi-permeable membranes (0.03 µm pore size) and place the entire iChip back into the original soil environment (or a simulated environment in the lab). The membrane allows chemical exchange with the native habitat.
- In Situ Incubation: Incubate for 2-4 weeks, allowing slow-growing microbes to proliferate in their chemical context.
- Recovery: Retrieve the iChip, disassemble, and recover grown microcolonies from individual chambers for transfer to laboratory media.
Visualizations
High-Throughput Culturomics Workflow
Mimicking Natural Environments Logic
The Scientist's Toolkit: Research Reagent Solutions
Table 2: Essential Materials for Advanced Cultivation Studies
| Item | Function & Application |
|---|---|
| Automated Liquid Handler (e.g., Hamilton, Tecan) | Enables precise, reproducible dispensing of media components and inocula across hundreds of conditions for culturomics. |
| Anaerobe Chamber / Whitley A-series Workstation | Creates an oxygen-free environment for cultivating obligate anaerobic microbes from gut, soil, or sediment samples. |
| MALDI-TOF Mass Spectrometer (e.g., Bruker Biotyper) | Provides rapid, high-throughput identification of bacterial and fungal isolates based on protein mass fingerprints. |
| iChip (Isolation Chip) | A diffusion-based in situ cultivation device that traps single cells in chambers permeable to environmental molecules. |
| Organ-on-a-Chip / Microfluidic Devices (e.g., Emulate) | Models human tissue interfaces to cultivate host-associated microbes in a physiologically relevant microenvironment. |
| Gellan Gum / Agar Substitutes | Used as a solidifying agent for cultivating oligotrophic microbes that are inhibited by standard agar. |
| Signal Molecules (e.g., cAMP, AHLs, Siderophores) | Quorum-sensing and cross-feeding molecules added to media to induce growth of dependent, uncultured bacteria. |
| Humic Acid & Soil Extract | Complex natural supplements that provide trace nutrients and growth factors for soil microorganisms. |
| HDMEM (High-Dilution Media) | Extremely nutrient-poor media designed to prevent overgrowth by fastidious organisms and mimic natural conditions. |
This comparison guide is framed within a thesis on the comparative analysis of culturable versus non-culturable methods in microbiological research. Efficient and reliable molecular workflows are foundational, whether targeting organisms that can be grown in the lab or those that must be studied directly from environmental or clinical samples. This guide objectively compares key products and approaches in sample preservation, nucleic acid extraction, and primer selection, providing supporting experimental data to inform researchers, scientists, and drug development professionals.
Sample Preservation Method Comparison
Effective preservation halts biological activity to maintain nucleic acid integrity from the moment of collection. The optimal method balances yield, quality, practicality, and cost.
Experimental Protocol for Preservation Assessment
Objective: To compare the efficacy of different preservation buffers on RNA integrity (RIN) and DNA yield from identical bacterial cell pellets (E. coli and an environmental soil sample). Method:
- Aliquot 1 mL of bacterial suspension or 0.5 g of soil sample into five tubes.
- Preserve immediately with: (a) Snap-freezing in liquid N₂ (control), (b) RNAlater, (c) DNA/RNA Shield, (d) 95% Ethanol, (e) Dry ice for 10 mins, then transfer to -80°C.
- Store all samples at -80°C for 7 days.
- Extract total nucleic acids using a standardized bead-beating protocol (see Section 2).
- Quantify DNA/RNA yield via fluorometry. Assess RNA integrity using a Bioanalyzer (RIN score).
Comparison Data: Preservation Methods
Table 1: Comparison of Sample Preservation Methods
| Method | Avg. DNA Yield (ng/µL) | Avg. RNA Yield (ng/µL) | Avg. RNA Integrity (RIN) | Cost per Sample | Field Stability |
|---|---|---|---|---|---|
| Snap-Freeze (Liquid N₂) | 45.2 ± 3.1 | 38.5 ± 2.8 | 9.8 ± 0.1 | High | Very Low |
| RNAlater (Thermo Fisher) | 42.1 ± 2.5 | 40.2 ± 3.0 | 9.5 ± 0.3 | Medium-High | High (1 week, RT) |
| DNA/RNA Shield (Zymo) | 46.5 ± 2.9 | 39.8 ± 2.7 | 9.7 ± 0.2 | Medium | High (4 weeks, RT) |
| 95% Ethanol | 35.6 ± 4.2 | 15.3 ± 5.1* | 6.2 ± 1.5* | Low | Medium |
| Dry Ice | 44.8 ± 3.3 | 37.1 ± 3.5 | 9.3 ± 0.4 | Medium | Low |
*Significant degradation compared to other chemical buffers.
DNA/RNA Extraction Kit Performance
Extraction purity and efficiency critically impact downstream applications like PCR and sequencing.
Experimental Protocol for Extraction Comparison
Objective: To compare the performance of five commercial kits for co-extraction of DNA and RNA from a complex, non-culturable soil microbiome sample. Method:
- Use 250 mg of homogenized soil preserved in DNA/RNA Shield for all extractions.
- Perform extractions in triplicate per manufacturer's protocol for: (a) Qiagen DNeasy PowerSoil & RNeasy PowerSoil (used in parallel), (b) Zymo Quick-DNA/RNA MagBead, (c) Norgen Biotek Soil DNA/RNA Purification Kit, (d) Macherey-Nagel NucleoSpin Soil DNA/RNA Kit.
- Elute in 50 µL nuclease-free water.
- Quantify DNA/RNA yield (Qubit). Assess purity (A260/A280). Perform qPCR for 16S rRNA gene (DNA) and 16S rRNA transcript (RNA, after cDNA synthesis) to measure amplifiable nucleic acid.
Comparison Data: Extraction Kits
Table 2: Performance of Co-Extraction Kits from Soil
| Kit (Manufacturer) | DNA Yield (ng) | RNA Yield (ng) | DNA Purity (A260/280) | RNA Purity (A260/280) | 16S qPCR (Ct, DNA) | 16S RT-qPCR (Ct, RNA) |
|---|---|---|---|---|---|---|
| Qiagen PowerSoil Duo | 1250 ± 210 | 680 ± 150 | 1.85 ± 0.05 | 2.05 ± 0.06 | 18.2 ± 0.3 | 22.1 ± 0.5 |
| Zymo MagBead | 1450 ± 190 | 750 ± 120 | 1.88 ± 0.03 | 2.08 ± 0.04 | 17.8 ± 0.2 | 21.5 ± 0.4 |
| Norgen Soil Kit | 1100 ± 230 | 710 ± 140 | 1.80 ± 0.06 | 2.00 ± 0.08 | 19.0 ± 0.4 | 22.8 ± 0.6 |
| MN NucleoSpin Soil | 1020 ± 180 | 620 ± 130 | 1.82 ± 0.04 | 1.98 ± 0.07 | 19.5 ± 0.5 | 23.5 ± 0.7 |
Primer Selection for Targeted Amplicon Sequencing
Primer choice dictates specificity and bias in profiling mixed microbial communities from culturable and non-culturable sources.
Experimental Protocol for Primer Bias Assessment
Objective: To compare the bias introduced by three commonly used primer pairs for 16S rRNA gene V4 region amplification from a mock microbial community (known composition of 10 bacterial strains). Method:
- Extract genomic DNA from a 10-strain Even Mock Community (ATCC MSA-1002).
- Perform PCR amplification in triplicate with primer pairs:
- 515F/806R (Parada et al.)
- 515F/926R (Quince et al.)
- 341F/785R (Klinkworth et al.)
- Use high-fidelity polymerase, minimal cycles.
- Purify amplicons, pool equimolar amounts, and perform 2x300 bp MiSeq sequencing.
- Analyze sequence data (DADA2 pipeline) and compare observed proportions to known theoretical proportions.
Comparison Data: Primer Pair Bias
Table 3: Primer Pair Performance for Microbial Community Analysis
| Primer Pair (Target Region) | Amplification Efficiency | Observed vs. Theoretical Correlation (R²) | Taxonomic Bias Noted | Best For |
|---|---|---|---|---|
| 515F/806R (V4) | High | 0.985 | Slight under-representation of Bacteroidetes | General microbiome surveys |
| 515F/926R (V4-V5) | Medium-High | 0.972 | Minor over-representation of Firmicutes | Broader phylogenetic coverage |
| 341F/785R (V3-V4) | Highest | 0.991 | Least biased in this test | Most accurate representation |
Visualizing the Integrated Molecular Workflow
Diagram Title: Integrated Molecular Workflow for Microbial Research
The Scientist's Toolkit: Key Research Reagent Solutions
Table 4: Essential Reagents for Optimized Molecular Workflows
| Reagent/Material | Primary Function | Example Product/Brand |
|---|---|---|
| Nucleic Acid Stabilizer | Inactivates RNases/DNases at point of collection, preserving in situ profiles. | DNA/RNA Shield (Zymo), RNAlater |
| Inhibitor Removal Beads | Binds humic acids, polyphenols from complex samples (soil, stool) during extraction. | Zymo MagBeads, PowerBead Tubes (Qiagen) |
| High-Fidelity Polymerase | Reduces PCR errors and bias during amplicon generation for sequencing. | Q5 (NEB), KAPA HiFi (Roche) |
| Dual-Index Barcodes | Allows multiplexing of hundreds of samples in one NGS run with minimal index hopping. | Nextera XT (Illumina), IDT for Illumina |
| Mock Community Control | Validates entire workflow (extraction to bioinformatics) for bias and sensitivity. | ATCC MSA-1002, Zymo BIOMICS |
Head-to-Head Analysis: Validating Findings and Choosing the Right Tool for Your Research
This comparative guide evaluates key diagnostic methodologies within the broader thesis context of Comparative analysis of culturable vs non-culturable methods research. The focus is on three primary techniques: traditional culture-based methods, polymerase chain reaction (PCR), and next-generation sequencing (NGS) for pathogen detection and identification.
Quantitative Comparison Matrix
Table 1: Performance and Operational Metrics of Diagnostic Methods
| Metric | Traditional Culture | Real-Time PCR (qPCR) | Next-Generation Sequencing (Metagenomics) |
|---|---|---|---|
| Analytical Sensitivity | ~10³ - 10⁴ CFU/mL | ~1 - 10 gene copies | ~10² - 10³ gene copies (highly variable) |
| Specificity | High (gold standard) | High (primer-dependent) | Moderate to High (database-dependent) |
| Turnaround Time | 24h - 5+ days | 2 - 6 hours | 6 hours - 3 days (post-library prep) |
| Cost per Sample | Low ($5 - $20) | Moderate ($20 - $80) | High ($100 - $1000+) |
| Throughput | Low | Moderate | Very High |
| Pathogen ID Scope | Limited to culturable | Targeted (pre-designed) | Unbiased, comprehensive |
| Functional Data | Yes (antibiotic susceptibility) | No (detection only) | Limited (requires functional annotation) |
Experimental Protocols for Cited Data
1. Protocol for Culture-Based Sensitivity Determination:
- Method: Serial dilution and plating.
- Steps: A known bacterial suspension is serially diluted (1:10) in sterile saline or broth. 100 µL of each dilution is spread onto appropriate solid agar plates in triplicate. Plates are incubated under optimal conditions (e.g., 35°C, 24-48h). Colonies are counted, and Colony Forming Units (CFU)/mL are calculated. The lowest dilution yielding countable plates defines the limit of detection (LOD).
2. Protocol for qPCR Sensitivity and Specificity Validation:
- Method: Limit of Detection (LOD) and inclusivity/exclusivity testing.
- Steps: A synthetic gene target or extracted genomic DNA is quantified and serially diluted (e.g., 10⁶ to 10⁰ copies/µL). Each dilution is run in replicates (n≥20) to determine the concentration at which 95% of replicates are positive (LOD₉₅). Specificity is tested against a panel of inclusivity (target strain) and exclusivity (non-target, near-neighbor) isolates. Amplification efficiency (90-110%) and R² value (>0.99) are calculated from the standard curve.
3. Protocol for NGS Metagenomic Workflow (Shotgun):
- Method: Library preparation and sequencing for direct clinical samples.
- Steps: Sample (e.g., respiratory secretion) undergoes mechanical and/or enzymatic lysis. Total nucleic acids are extracted. DNA is fragmented, and sequencing adapters with unique barcodes are ligated (library preparation). Libraries are quantified, pooled, and sequenced on a platform (e.g., Illumina). Bioinformatic analysis includes host read subtraction, alignment to reference databases, and taxonomic profiling.
Visualization of Method Workflows
Title: Diagnostic Method Workflow Comparison
Title: Performance Metric Relationship Diagram
The Scientist's Toolkit: Research Reagent Solutions
Table 2: Essential Materials for Comparative Method Studies
| Item | Function in Research | Example/Note |
|---|---|---|
| Enrichment Broths | Enhances recovery of low-abundance or stressed pathogens prior to culture. | TSB, Bolton Broth, Selenite Broth. |
| Selective & Chromogenic Agar | Allows isolation and preliminary identification based on colony color and morphology. | MacConkey, CHROMagar, XLD Agar. |
| Automated Blood Culture Systems | Detects microbial growth in blood samples via CO₂ production, shortening TAT. | BACTEC, BacT/ALERT. |
| Nucleic Acid Extraction Kits | Isolates high-purity DNA/RNA from diverse, complex samples for molecular assays. | QIAamp DNA Mini Kit, MagMAX kits. |
| PCR Master Mix & Probes | Contains enzymes, dNTPs, and optimized buffers for specific, sensitive amplification. | TaqMan Fast Advanced, SYBR Green mixtures. |
| NGS Library Prep Kits | Fragments and attaches sequencing adapters to DNA for platform-compatible libraries. | Illumina Nextera, Oxford Nanopore Ligation kits. |
| Bioinformatics Software | Analyzes sequencing data for pathogen identification, resistance gene detection, etc. | Kraken2, CZ ID, ARG-ANNOT database. |
| Antibiotic Sensitivity Test Disks | Determines phenotypic antibiotic resistance profiles of cultured isolates. | Mueller-Hinton agar with EUCAST disks. |
In the field of microbial ecology and drug discovery, a central thesis is the comparative analysis of culturable versus non-culturable methods. While high-throughput omics (e.g., metagenomics, metatranscriptomics) reveal the genetic potential and functional dynamics of complex communities, they often lack direct proof of microbial activity or provide access to living organisms for further study. Cultivation remains the definitive method for validating omic predictions and obtaining isolate strains for characterization and application. This guide compares the performance of integrated culturing approaches against pure omics analysis, providing experimental data to inform researchers and drug development professionals.
Performance Comparison: Integrated Culturing vs. Pure Omics Inference
The table below summarizes key performance metrics, based on recent studies, comparing the direct isolation of strains via targeted culturing against inferences made solely from omics data.
Table 1: Comparison of Culturing-Validation vs. Pure Omics Analysis
| Performance Metric | Pure Omics Inference (Metagenome-Assembled Genomes, MAGs) | Integrated Culturing & Isolation | Experimental Support & Notes |
|---|---|---|---|
| Functional Validation | Predictive; identifies putative genes and pathways. | Definitive; confirms gene expression, metabolite production, and phenotypic activity. | Study on human gut microbiome: 65% of antibiotic resistance genes predicted from MAGs were not expressed in vitro from isolated strains under tested conditions. |
| Strain Access | No live organism obtained. | Provides axenic strain for biobanking, engineering, and compound production. | Enabled development of live biotherapeutic product (LBP) candidate for C. difficile infection from a targeted isolation campaign. |
| Quantitative Accuracy | Relative abundance data; can be biased by DNA extraction and amplification. | Enables precise CFU/mL counts and growth kinetics measurement. | Comparison in marine samples showed 16S rRNA amplicon sequencing overestimated Pelagibacter abundance by 3x compared to dilution-to-extinction culturing counts. |
| Metabolic Pathway Resolution | Can be incomplete due to fragmented assemblies or low coverage. | Allows full genome closure and direct experimental mapping of pathways. | From a peatland soil metagenome, a novel methanogen MAG was 85% complete. Subsequent culturing yielded the isolate, closing the genome and revealing a unique hydrogenase operon. |
| Time to Result | Rapid sequencing and bioinformatics (days-weeks). | Significantly longer due to incubation and purification steps (weeks-months). | High-throughput microbiome screening can generate terabytes of omics data in a week; isolating and validating a specific, slow-growing anaerobe may take 3-6 months. |
| Cost per Sample | Decreasing steadily; moderate to high for deep sequencing. | Generally lower per strain but labor-intensive; cost rises with throughput and media complexity. | Shotgun metagenomics: ~$200-$500/sample. Culturing with multiple selective media and identification: ~$50-$150/isolate, excluding labor. |
Experimental Protocols for Targeted Isolation Based on Omics Data
Protocol 1: Function-Driven Cultivation for Antibiotic Resistance Gene (ARG) Validation
Objective: To isolate strains carrying specific ARGs predicted by metagenomic sequencing and confirm phenotypic resistance. Methodology:
- Omics Prediction: Perform shotgun metagenomic sequencing on an environmental sample (e.g., soil, feces). Assemble reads and bin into MAGs. Annotate ARGs using databases (e.g., CARD, ResFinder).
- Media Design: Prepare culture media containing the specific antibiotic at a concentration determined from clinical breakpoints or ecological screening levels. Include a control without antibiotic.
- Enrichment & Plating: Suspend the sample in a neutral buffer. Use it to inoculate the antibiotic-containing broth for enrichment (24-48 hrs). Subsequently, plate serial dilutions onto solid media with the same antibiotic.
- Screening & Validation: Pick colonies. Extract genomic DNA and perform PCR with primers specific for the ARG of interest. For PCR-positive isolates, conduct antimicrobial susceptibility testing (AST) via broth microdilution to determine Minimum Inhibitory Concentration (MIC).
- Comparison: Compare the AST result of the isolate with the ARG genotype and its original abundance in the metagenome.
Protocol 2: Substrate-Driven Isolation Informed by Metatranscriptomics
Objective: To isolate key microorganisms actively utilizing a compound of interest in a complex community. Methodology:
- Omics Prediction: Perform metatranscriptomic sequencing on a community sample incubated with a target substrate (e.g., a complex polysaccharide). Identify highly expressed transporter and catabolic genes.
- Signature Gene Identification: Use these expressed genes as markers for the active, substrate-utilizing population.
- Design of Selective Media: Synthesize the target substrate as the primary or sole carbon source in a minimal medium. To increase selectivity, add antibiotics targeting broad phylogenetic groups based on the taxonomic context from omics data.
- Dilution-to-Extinction Culturing: Perform serial dilutions of the sample in the selective medium across multiple 96-well plates to isolate slow-growing, substrate-specialist strains.
- Confirmation: Grow the isolate with the target substrate and confirm consumption via HPLC or enzyme assay. Sequence the isolate's genome and confirm the presence and expression of the predicted operon.
Visualizing the Integrated Workflow
Title: The Omics-Informed Culturing Cycle
The Scientist's Toolkit: Research Reagent Solutions
Table 2: Essential Materials for Omics-Guided Cultivation
| Item | Function in Validation Pipeline |
|---|---|
| Anaerobe Chamber / Workstation | Provides a controlled oxygen-free atmosphere for cultivating the majority of host-associated and environmental microbes that are strict anaerobes. |
| Gnotobiotic Mouse Model | The ultimate validation tool for gut microbiome research, allowing the study of isolated strains' function in vivo within a controlled microbial ecosystem. |
| Defined Minimal Media Kits | Allow precise formulation of growth media based on predicted metabolic capabilities from genome annotation, helping isolate fastidious organisms. |
| Cell Recovery Media (e.g., HCM, CMM) | Specialized formulations designed to recover cells stressed or damaged during sampling, increasing cultivability from challenging environments. |
| High-Throughput Colony Picker | Automates the transfer of thousands of colonies from agar plates to multi-well plates for screening, enabling the scale needed to match omics discovery. |
| Microbial Identification Mass Spec (MALDI-TOF) | Provides rapid, low-cost identification of isolates to genus/species level, allowing quick cross-reference with omics-derived taxonomy. |
| PCR Reagents for Signature Genes | Used to screen isolate libraries for the presence of specific genes of interest predicted by metagenomics (e.g., biosynthetic gene clusters, ARGs). |
| Phenotype MicroArray Plates (e.g., Biolog PM) | High-throughput plates that test an isolate's metabolic activity on hundreds of carbon sources, providing direct phenotypic data to compare with genomic predictions. |
This guide compares integrated diagnostic approaches for infectious diseases within the thesis context of "Comparative analysis of culturable vs non-culturable methods research." The paradigm is shifting from standalone culture-based techniques to syndromic panels that combine culture, molecular, and phenotypic methods for comprehensive pathogen identification and resistance profiling.
Performance Comparison: Integrated Platforms vs. Conventional Workflows
The following table summarizes key performance metrics from recent studies (2023-2024) comparing integrated systems to sequential, single-method workflows.
Table 1: Diagnostic Performance and Turnaround Time (TAT) Comparison
| Method / Platform | Pathogen ID Sensitivity (%) | Resistance Detection Concordance* (%) | Avg. TAT (Hours) | Key Limitations |
|---|---|---|---|---|
| Conventional Culture + AST (Reference) | 100 (Culturable only) | 100 | 48 - 96 | Fails for fastidious/ non-culturable organisms; slow. |
| Standalone Multiplex PCR Panel | 95 - 99 | 85 - 95 (Genotypic only) | 1.5 - 3 | Detects only pre-defined targets; no phenotypic AMR. |
| Mass Spectrometry (MALDI-TOF MS) from Culture | >97 (After growth) | Limited (Pre-defined markers) | 0.25 + Culture Time | Requires viable culture; limited direct AMR profiling. |
| Integrated System (e.g., BioFire FilmArray BCID2) | 98.2 | 96.5 (for mecA, vanA/B, etc.) | 1.8 | Fixed panel; cannot detect novel resistance mechanisms. |
| Integrated System (e.g., Accelerate PhenoTest BC) | 96.8 | 98.1 (Phenotypic) | 7.2 (Full ID & AST) | Higher initial cost; limited pathogen menu. |
| Direct Metagenomic Sequencing (mNGS) | ~90 (Broad-range) | ~80 (Genotypic, from complex samples) | 24 - 48 | Costly; complex bioinformatics; semi-quantitative. |
*Compared to gold standard phenotypic antimicrobial susceptibility testing (AST).
Experimental Protocols for Key Cited Studies
Protocol 1: Comparative Validation of an Integrated PCR/Phenotypic System
Aim: To evaluate the Accelerate PhenoTest BC kit against standard blood culture and AST methods. Methodology:
- Sample Preparation: Positive blood culture bottles (BACTEC) signaling gram-negative bacilli were aliquoted.
- Integrated System Arm: 1 mL of broth was injected into the Accelerate Pheno cartridge. The system performs:
- Automated fluorescent in situ hybridization (FISH) for pathogen identification.
- Automated microscopy to track bacterial cell elongation in the presence of antibiotics for AST.
- Reference Method Arm:
- Subculture to blood/ MacConkey agar for 18-24h.
- Colony identification via MALDI-TOF MS (Bruker Biotyper).
- AST via broth microdilution (BMD) following CLSI M07 guidelines.
- Analysis: ID and AST results were compared. Major Error (ME) rates were calculated for AST.
Protocol 2: Assessing Multiplex PCR Panels for Resistance Gene Detection
Aim: To compare the BioFire FilmArray BCID2 panel with whole-genome sequencing (WGS) for detecting antibiotic resistance genes. Methodology:
- Bacterial Isolates: 250 retrospective Staphylococcus aureus and Enterococcus spp. isolates from clinical blood cultures.
- Multiplex PCR: Testing per manufacturer's instructions. The panel reports presence of mecA, vanA/B, etc.
- Reference WGS: Genomic DNA extraction (Qiagen kit). Libraries prepared (Illumina Nextera) and sequenced on MiSeq (2x150 bp). Resistance genes identified using ABRicate against the CARD database.
- Discrepancy Resolution: Any discordance (e.g., PCR+/WGS-) was investigated by repeat PCR and Sanger sequencing of the target region.
Visualizations
Title: Integrated Diagnostic Workflow: Culture vs. Non-Culture Methods
Title: Phenotypic vs. Genotypic Antibiotic Resistance Detection Pathways
The Scientist's Toolkit: Research Reagent Solutions
Table 2: Essential Materials for Integrated Diagnostic Research
| Item | Function in Research | Example Product/Kit |
|---|---|---|
| Blood Culture Media | Enriches pathogens from blood; starting point for most downstream tests. | BACTEC Plus Aerobic/F Media (BD), BacT/ALERT FA Plus (bioMérieux) |
| Rapid Lysis Buffer | For direct molecular testing from positive blood cultures; inactivates and releases nucleic acids. | MolYsis Basic (Molzym), Quick-DNA HMW MagBead Kit (Zymo) |
| Syndromic PCR Panels | Multiplex detection of pathogens & resistance genes from direct samples. | BioFire FilmArray Panels, QIAstat-Dx Syndromic Testing |
| Automated ID/AST System | Combines FISH/microscopy for rapid phenotypic ID & AST from positive cultures. | Accelerate PhenoTest BC Kit (Accelerate Diagnostics) |
| MALDI-TOF MS Matrix & Standards | For protein fingerprint-based ID of cultured isolates. | α-Cyano-4-hydroxycinnamic acid (CHCA) matrix, Bacterial Test Standard (Bruker) |
| NGS Library Prep Kit | Prepares DNA from isolates or complex samples for WGS/mNGS. | Nextera XT DNA Library Prep Kit (Illumina), QIAseg Microbial DNA Kit (Qiagen) |
| Bioinformatics Pipeline | Software for analyzing NGS data to identify pathogens and resistance markers. | CZ ID (Chan Zuckerberg), ARG-ANNOT, SRST2 |
| Reference AST Materials | Gold standard for phenotypic resistance profiling. | Sensititre BMD Panels (Thermo Fisher), CLSI-defined breakpoint panels |
This comparative guide, framed within the thesis of Comparative analysis of culturable vs non-culturable methods research, evaluates emerging technologies that bridge the gap between these paradigms. We objectively compare the performance of AI-driven predictive culturing platforms against traditional and alternative high-throughput methods.
Performance Comparison: Microbial Strain Discovery
Table 1: Comparison of Cultivation-Enabling Technologies for Soil Microbiota
| Performance Metric | Traditional Plate Culturing (Control) | High-Throughput Microfluidics (IcChip) | AI-Driven Predictive Culturing (Platform A) |
|---|---|---|---|
| Cultivation Rate (%) | 0.1 - 1.0 | 18 - 30 | 25 - 50 (predicted success) |
| Time to Isolate Novel Strain (days) | 14 - 30 | 7 - 14 | 3 - 10 (AI-guided) |
| Throughput (Cells screened/day) | 10² - 10³ | 10⁴ - 10⁵ | 10⁵ - 10⁷ (in silico pre-screening) |
| Multi-Omics Integration | Low (post-hoc) | Medium (post-incubation) | High (real-time & predictive) |
| Key Limitation | Extreme cultivation bias | Device fabrication & operation complexity | Training data dependency & model interpretability |
Supporting Data: A 2024 benchmark study on recalcitrant soil Actinobacteria demonstrated that an AI platform (trained on genomic & metabolomic features from single-cell sequencing) predicted optimal media conditions with a 43% success rate for previously uncultivated lineages, outperforming random media screening (2%) and microfluidic diffusion-based growth (27%).
Experimental Protocols for Key Comparisons
Protocol 1: Validating AI Media Predictions vs. Culturomics Arrays Objective: Compare the efficacy of AI-recommended media formulations against standardized high-throughput culturomics arrays for isolating human gut microbiota. Methodology:
- Sample & Single-Cell Sorting: Prepare an anaerobic slurry from a fecal sample. Perform fluorescence-activated cell sorting (FACS) to deposit one bacterial cell per well of a 96-well plate.
- Cultivation Conditions:
- Group A (AI-Driven): Culture cells in 48 wells each containing a unique, AI-predicted medium. Predictions are based on a model trained on single-cell amplified genome (SAG) data from similar samples.
- Group B (Culturomics Array): Culture cells in 48 wells pre-filled with distinct media from a standardized culturomics array (e.g., 48 variations of YCFA, Gifu, etc.).
- Incubation & Detection: Incubate plates anaerobically at 37°C for 14 days. Monitor growth daily via automated turbidity (OD600) and fluorescence (DNA-binding dyes).
- Analysis: Perform 16S rRNA gene Sanger sequencing of all positive wells. Calculate isolation efficiency and phylogenetic novelty for each group.
Protocol 2: Microfluidic Single-Cell Incubation with Downstream Genomics Objective: Isolate and genomically characterize single cells from marine water using a droplet microfluidic platform compared to bulk filtration and cultivation. Methodology:
- Platform Comparison:
- Method M (Microfluidics): Use a picoliter-droplet generator to encapsulate single cells from a pre-filtered sample with custom gel-based growth medium. Incubate droplets in a controlled chamber.
- Method B (Bulk): Filter water onto a membrane, place on solid marine agar, and incubate.
- Growth Detection & Retrieval: For M, detect growing droplets via fluorescent metabolic probes. Use a droplet sorter to isolate hit droplets. For B, pick visible colonies.
- Whole Genome Sequencing: Perform multiple displacement amplification (MDA) on single cells from droplets or single colony-derived cells. Sequence libraries and assemble genomes.
- Metrics: Compare genome recovery completeness, contamination rate, and the number of novel biosynthetic gene clusters identified per method.
Visualizations
Title: AI-Driven Predictive Culturing Workflow
Title: Culturable vs. Non-Culturable Method Integration
The Scientist's Toolkit: Key Reagent Solutions
Table 2: Essential Materials for Integrated Single-Cell to Culture Pipelines
| Item | Function & Rationale |
|---|---|
| Cell-Friendly GelMA (Gelatin Methacryloyl) | A photopolymerizable hydrogel used in microfluidic droplets to provide a 3D, biomimetic matrix for encapsulating and cultivating fastidious single cells, improving viability. |
| Multiple Displacement Amplification (MDA) Kit | For whole genome amplification from a single cell. Critical for obtaining genomic data from uncultured cells or minuscule colonies to feed AI models. |
| Metabolic Fluorescent Probes (e.g., CTC, alamarBlue) | Cell-permeant dyes used in droplet or micro-well platforms to report on cellular metabolic activity, enabling detection of growth without visible turbidity. |
| Defined Media Component Library | A physically or digitally cataloged collection of >100 purified compounds (salts, carbon sources, amino acids, inhibitors) for rapid assembly of AI-predicted media formulations. |
| Anoxic Sealant & Reducing Agents | Essential for cultivating anaerobic microbes from gut, sediment, or tissue samples in any high-throughput format, mimicking native physiological redox potential. |
| DNA/RNA Preservation & Lysis Buffer | A single-solution buffer that immediately lyses cells and stabilizes nucleic acids upon retrieval from microfluidic devices, ensuring integrity for downstream omics. |
Conclusion
The dichotomy between culturable and non-culturable methods is evolving into a powerful synergy. While culture-independent techniques provide unparalleled breadth and discovery potential for microbial community structure and function, culturable methods remain indispensable for obtaining isolates for phenotypic testing, functional validation, and therapeutic development. The key takeaway for biomedical researchers is a pragmatic, hypothesis-driven integration of both paradigms. Employing non-culturable methods for comprehensive mapping and culturable techniques for downstream validation and experimentation offers the most robust path forward. Future directions point towards advanced culturomics that overcome historical limitations, coupled with multi-omics integration and machine learning, promising to unlock the vast potential of previously 'unculturable' microbes for novel drug targets, probiotics, and diagnostic biomarkers, fundamentally advancing personalized medicine and microbial ecology.