Decoding Microbial Sulfur Cycling: A Comparative Analysis of Freshwater vs. Marine Sediment Processes for Biomedical Insights
This article provides a comprehensive comparative analysis of microbial sulfur cycling processes in freshwater and marine sediment environments.
Decoding Microbial Sulfur Cycling: A Comparative Analysis of Freshwater vs. Marine Sediment Processes for Biomedical Insights
Abstract
This article provides a comprehensive comparative analysis of microbial sulfur cycling processes in freshwater and marine sediment environments. Targeting researchers and drug development professionals, we explore the foundational biogeochemical principles, key microbial taxa (e.g., sulfate-reducers, sulfur-oxidizers), and distinct environmental drivers (salinity, sulfate availability, redox gradients) in each system. We detail modern methodological approaches, including metagenomics, stable isotope probing, and electrochemical techniques, for studying these complex communities. The review addresses common experimental challenges and optimization strategies for in situ and lab-based studies. Finally, we validate findings by comparing process rates, community structures, and metabolic pathways across ecosystems, highlighting unique enzymes and metabolites with potential biomedical applications, such as novel antimicrobial compounds, anti-cancer agents, and insights into human microbiome-linked sulfur metabolism.
Core Biogeochemistry and Microbial Players in Sedimentary Sulfur Cycles
This guide compares the performance of Freshwater (FW) versus Marine (MAR) sediment systems in key microbial sulfur cycling processes, framed within a thesis on their distinct biogeochemical dynamics.
Core Reaction Comparisons: Sulfate Reduction vs. Sulfide Oxidation
Table 1: Comparative Rates of Key Sulfur Cycling Processes
| Process & Reaction Formula | Typical Environment | Max Reported Rate (nmol/cm³/day) | Key Controlling Factor | Competitive Inhibition By |
|---|---|---|---|---|
| Sulfate Reduction (SRR):2CH₂O + SO₄²⁻ → H₂S + 2HCO₃⁻ | Marine (MAR) | 1200 | Sulfate Availability (>28 mM), Organic C | Fe(III) reduction, Methanogenesis |
| Sulfate Reduction (SRR):2CH₂O + SO₄²⁻ → H₂S + 2HCO₃⁻ | Freshwater (FW) | 150 | Organic C Quality, Sulfate (<0.5 mM) | Methanogenesis, Fe(III) reduction |
| Sulfide Oxidation (SOX):H₂S + 2O₂ → SO₄²⁻ + 2H⁺ | Marine & FW | Varies | O₂/NO₃⁻ Availability, Light (photic zone) | N/A |
| Disproportionation (SDP):4S⁰ + 4H₂O → 3H₂S + SO₄²⁻ + 2H⁺ | Marine (dominant) | 85 | Intermediate S (S⁰, S₂O₃²⁻) Availability | Outcompeted by SRR at high sulfate |
Key Takeaway: MAR sediments are high-throughput, sulfate-limited systems where SRR dominates carbon mineralization. FW sediments are sulfate-poor, carbon-limited systems where SRR competes poorly with methanogenesis.
Experimental Protocol Comparison: Measuring Process Rates
Protocol 1: Radiotracer (³⁵SO₄²⁻) Sulfate Reduction Rate (SRR) Assay
- Core Sub-sampling: Under N₂ atmosphere, sub-sample sediment cores into 5 mL sterile serum vials.
- Tracer Injection: Inject 100 µL of carrier-free Na₂³⁵SO₄ solution (100 kBq) into each vial, mix.
- Incubation: Incubate in the dark at in situ temperature for 6-12 hours.
- Termination & Fixation: Terminate with 20 mL of 20% zinc acetate.
- Distillation: Acidify with 8 mL 6M HCl, distil liberated H₂³⁵S into fresh zinc acetate traps.
- Scintillation Counting: Quantify radioactivity in both distilled (reduced) and residual (unreduced) fractions by liquid scintillation counting.
Protocol 2: Microsensor Profiling for Sulfide Oxidation
- Sensor Setup: Deploy O₂, H₂S, and pH microsensors (tip diameter ~10 µm) on a motorized micromanipulator.
- Core Stabilization: Use intact, undisturbed sediment core in a temperature-controlled flow-through chamber.
- Profiling: Measure vertical concentration profiles (e.g., 100 µm steps) from water column into sediment.
- Rate Calculation: Apply Fick’s first law of diffusion to the flux across the sediment-water interface. Sulfide oxidation zones are identified by overlapping depletion of O₂ and H₂S.
Comparative Pathways: Freshwater vs. Marine Sulfur Cycling
The Scientist's Toolkit: Key Research Reagent Solutions
Table 2: Essential Reagents for Sedimentary Sulfur Cycle Research
| Reagent / Material | Primary Function | Application Note |
|---|---|---|
| Carrier-free Na₂³⁵SO₄ | Radiotracer for quantifying sulfate reduction rates (SRR). | Critical for sensitivity in low-sulfate freshwater systems. |
| Zinc Acetate (20% w/v) | Fixation agent; traps dissolved H₂S as insoluble ZnS. | Used to terminate incubations and preserve sulfide for analysis. |
| Molybdate (Na₂MoO₄) | Specific inhibitor of sulfate-reducing bacteria (SRB). | Used in control experiments to confirm biological SRR. |
| Perchlorate (NaClO₃/KClO₃) | Specific inhibitor of sulfur-oxidizing bacteria (SOB). | Used to differentiate biological vs. chemical sulfide oxidation. |
| Anoxic, Sulfide-Reduced Basal Medium | Provides consistent background for enrichment cultures. | Essential for cultivating strict anaerobic sulfur-cyclers. |
| Ti(III)-Citrate solution | Chemical reducing agent to achieve and maintain anoxia. | Used in medium preparation to scavenge trace O₂. |
| Microsensors (O₂, H₂S, pH) | High-resolution in situ measurement of chemical gradients. | Key for quantifying fluxes and identifying reaction zones in intact cores. |
Global Significance: A Comparative Perspective
Table 3: Global Biogeochemical Impact
| Parameter | Marine Sediment Contribution | Freshwater Sediment Contribution |
|---|---|---|
| Carbon Mineralization | ~50% of organic C degraded in oceans via SRR. | Minor pathway, dominated by methanogenesis. |
| Greenhouse Gas Link | Suppresses CH₄ via sulfate-methane transition zone. | Major source of atmospheric CH₄ (less S-linked suppression). |
| Paleoproxy Record | Pyrite (FeS₂) sulfur isotopes (δ³⁴S) key for ocean redox history. | Organic sulfur and AVS more relevant; pyrite often limited. |
| Metal Cycling | Major sink for Fe²⁺ as pyrite; source of phosphorous. | Key driver of Fe and Mn redox cycling; H₂S quickly sequestered. |
| Drug Development Link | Source of novel SRB and SOB with unique biochemistries. | Source of extremophiles in low-sulfate, variable O₂ niches. |
Conclusion: The sedimentary sulfur cycle operates on fundamentally different principles in freshwater versus marine systems, governed by sulfate availability. Marine sediments are the planet's primary biological sulfur processing engines with high-capacity, sulfate-driven carbon mineralization and pyrite burial. Freshwater sediments operate as sulfur-limited, competitive arenas where sulfur cycling is transient and tightly coupled to iron and methane dynamics. This comparative understanding is critical for accurate global biogeochemical modeling and for guiding bioprospecting efforts for novel microbial metabolites.
This comparison guide, framed within a thesis on microbial sulfur cycling, objectively contrasts the biogeochemical parameters and experimental outcomes for sulfur cycling in freshwater versus marine sediments. The data and protocols are synthesized from current research to aid researchers and drug development professionals in environmental and bioprospecting studies.
Key Parameter Comparison
Table 1: Core Environmental and Geochemical Parameters
| Parameter | Freshwater Sediment (Typical Range) | Marine Sediment (Typical Range) | Key Implication for S-Cycling |
|---|---|---|---|
| Sulfate Concentration | 10 – 500 µM | 28,000 µM (Full Strength Seawater) | Primary electron acceptor limit in freshwater; non-limiting in marine. |
| Salinity (PSU) | 0 – 0.5 | 30 – 35 | Drives microbial community composition & osmoregulation strategies. |
| Sulfate Reduction Rate (SRR) | 1 – 100 nmol cm⁻³ day⁻¹ | 10 – 1000 nmol cm⁻³ day⁻¹ | Higher potential rates in marine due to sulfate availability. |
| Redox Potential (Eh) at Sulfate-Reduction Zone | -100 to -200 mV | -200 to -300 mV | Generally more reducing in marine systems. |
| Organic Matter Type | Terrestrial, recalcitrant, C/N high | Algal, more labile, C/N lower | Quality affects sulfide production and iron-sulfur mineral formation. |
| Dominant Sulfide Minerals | Acid-volatile (AVS: FeS) | Pyrite (FeS₂) | Marine systems favor more stable pyrite due to higher sulfide. |
| Methane-Sulfate Transition Depth | Often shallow (cm-scale) | Often deep (m-scale) due to high sulfate | Sulfate-Methane Transition Zone (SMTZ) is a key biogeochemical hotspot. |
Table 2: Experimental Data from Incubation Studies (Representative)
| Experiment Outcome | Freshwater Sediment Core | Marine Sediment Core | Analytical Method |
|---|---|---|---|
| Sulfate Depletion Time | 5 – 15 days | > 60 days (often not depleted) | Ion Chromatography (IC) |
| Peak Hydrogen Sulfide (H₂S) Concentration | 0.1 – 1.0 mM | 1.0 – 10.0 mM | Colorimetric (Methylene Blue) |
| δ³⁴S of Produced Sulfide | -15‰ to -35‰ | -20‰ to -50‰ | Isotope Ratio Mass Spectrometry |
| Methanogenesis Inhibition by Sulfate | Complete at [SO₄²⁻] > 200 µM | Persistent in deep layers below SMTZ | ¹⁴C-CH₄ Radiotracer |
Experimental Protocols
Protocol 1: Core Incubation for Sulfate Reduction Rate (SRR)
Objective: Quantify in-situ sulfate reduction via radiotracer. Method:
- Collection: Retrieve intact sediment cores using a piston corer under N₂ atmosphere.
- Injection: Inject carrier-free ³⁵SO₄²⁻ (100 kBq per injection) at 1-cm intervals through sealed ports using a microsyringe.
- Incubation: Incubate cores in-situ or at in-situ temperature in the dark for 6-24 hours.
- Termination & Fixation: Section core. Place each section immediately into 20 mL of 20% (w/v) zinc acetate to trap H₂S.
- Distillation: Perform acid distillation (Chromous Chloride method) to separate ³⁵S-labeled sulfide.
- Quantification: Measure radioactivity of the trapped Ag₂S precipitate by liquid scintillation counting. Calculate SRR.
Protocol 2: Porewater Profiling via Rhizon Sampling
Objective: Obtain high-resolution, non-disruptive porewater for ion and redox analysis. Method:
- Installation: Insert Rhizon CSS samplers (0.15 µm pore size) into pre-drilled holes in a sediment core at desired depth intervals.
- Sampling: Apply a slight vacuum (5-10 kPa) via syringe. Collect porewater (1-5 mL) over several hours.
- Analysis: Immediately analyze an aliquot for pH, Eh (using micro-electrode). Filter (0.2 µm) and preserve for anions (IC: SO₄²⁻, Cl⁻) and cations (ICP-MS: Fe²⁺, Mn²⁺).
Protocol 3: Microbial Community Analysis via 16S rRNA Gene Amplicon Sequencing
Objective: Compare sulfate-reducing prokaryote (SRP) communities. Method:
- DNA Extraction: Use a power soil DNA extraction kit on 0.5 g sediment from specific redox zones.
- PCR Amplification: Amplify the 16S rRNA gene V4 region with barcoded primers (515F/806R) including archaea. For dsrB gene (marker for SRP), use specific primers (e.g., DSRp2060F/DSR4R).
- Sequencing: Perform 2x250 bp paired-end sequencing on an Illumina MiSeq platform.
- Bioinformatics: Process sequences through QIIME2 or mothur. Classify OTUs against SILVA and dsrB databases.
Visualizations
Title: Sulfate Dependent Microbial Carbon & Sulfur Cycling
Title: Comparative Sediment Analysis Workflow
The Scientist's Toolkit
Table 3: Key Research Reagent Solutions & Materials
| Item | Function & Application | Specification/Example |
|---|---|---|
| ³⁵S-Sulfate Radiotracer | Quantifying in-situ sulfate reduction rates (SRR) in incubation experiments. | Carrier-free Na₂³⁵SO₄, specific activity >37 TBq/mmol. |
| Zinc Acetate Solution (20% w/v) | Fixation agent for trapping hydrogen sulfide (H₂S) as insoluble ZnS, halting microbial activity. | Anaerobically prepared, with NaOH to pH ~10. |
| Chromous Chloride (CrCl₂) Solution | Strong reducing agent used in distillation to convert all reduced sulfur species to H₂S. | 1M solution in 0.5N HCl, stored under N₂/Ar. |
| Rhizon CSS Samplers | For minimally invasive, high-resolution porewater extraction from sediments. | Pore size 0.15 µm, 5 cm length. |
| Anoxic Glove Box / Bag | Maintains anoxic conditions during sediment sub-sampling and reagent preparation. | Atmosphere: 95-97% N₂, 3-5% H₂ with palladium catalyst. |
| dsrB-Specific PCR Primers | Targeting dissimilatory sulfite reductase gene for SRP community profiling. | e.g., DSRp2060F (5'-CAACATCGTYCAYACCCAGGG-3'). |
| MICRO-COSM Sensor Array | In-situ measurement of O₂, H₂S, pH, and Eh at millimeter depth resolution. | Unisense microsensors connected to a motorized profiler. |
Within the context of comparative research on freshwater versus marine sediment sulfur cycling, understanding the dominant sulfate-reducing prokaryotes (SRPs) is fundamental. This guide compares the key SRP taxa across these ecosystems, supported by experimental data on their activity and environmental constraints.
Dominant SRP Taxa: Freshwater vs. Marine Sediments
The composition of dominant SRP consortia shifts dramatically along the salinity gradient, driven primarily by differential responses to sulfate concentration and ionic stress.
| Ecosystem | Dominant SRP Genera/Phyla | Key Environmental Driver | Typical Sulfate Concentration (mM) | Optimal Salinity Range | Notable Metabolic Trait |
|---|---|---|---|---|---|
| Freshwater Sediments | Desulfovibrio, Desulfobulbus, Desulfotomaculum (Firmicutes) | Low Sulfate Availability | 0.1 - 1.0 | Fresh to Brackish (0-5 ppt) | Often incomplete oxidizers; versatile electron donors (lactate, ethanol). |
| Marine Sediments | Desulfobacter, Desulfococcus, Desulfosarcina (Deltaproteobacteria), Desulfobacterium | High Sulfate Availability | 20 - 30 | Marine (~35 ppt) | Often complete oxidizers to CO₂; can oxidize acetate and fatty acids. |
| High-Salinity/ Hypersaline | Desulfohalobium, Desulfovermiculus, Desulfonatronovibrio (and Archaea: Archaeoglobus) | Extreme Ionic Stress | Variable (often high) | Hypersaline (>50 ppt) | Specialized osmolyte systems; some are alkaliphilic. |
Experimental Data: Sulfate Reduction Rate (SRR) Comparisons
Sulfate Reduction Rates (SRRs) are a key functional metric. The following table summarizes typical in situ and laboratory incubation data.
| Experiment Type | Freshwater Sediment SRR (nmol SO₄²⁻ cm⁻³ day⁻¹) | Marine Sediment SRR (nmol SO₄²⁻ cm⁻³ day⁻¹) | Citation Source (Example) |
|---|---|---|---|
| In Situ Porewater Radiotracer (³⁵SO₄²⁻) | 10 - 250 | 50 - 1000 | Jørgensen & Kasten, 2006 |
| Slurry Incubation (with molybdate inhibition control) | 5 - 100 | 100 - 5000 | Habicht et al., 2002 |
| Continuous-Flow Bioreactor Simulation | Up to 500 (under sulfate amendment) | Up to 10,000 | Ito et al., 2019 |
Experimental Protocols for Key Cited Studies
1. Protocol: Radiotracer Measurement of In Situ Sulfate Reduction Rates
- Objective: Quantify SRR in intact sediment cores.
- Materials: Core sampler, syringe for injection, ³⁵S-labeled sulfate solution (carrier-free), anaerobic glove bag, zinc acetate traps.
- Method:
- Collect intact sediment cores using a coring device.
- In an anaerobic chamber, inject a known activity of ³⁵SO₄²⁻ solution at multiple depth intervals through ports in the core liner.
- Incubate cores in situ or at in situ temperature for 6-24 hours.
- Terminate reaction by sectioning core into predetermined depths and placing each section into 20% zinc acetate solution.
- Analyze reduced inorganic sulfur species (CRS, including FeS and pyrite) via a single-step chromium distillation, trapping evolved H₂³⁵S in zinc acetate. Quantify radioactivity by liquid scintillation counting.
- Calculate SRR based on incorporated radioactivity, total sulfate, and incubation time.
2. Protocol: Molybdate Inhibition in Slurry Incubations
- Objective: Confirm SRP-mediated activity and quantify contributions.
- Materials: Sediment, anaerobic artificial freshwater/marine medium, sodium molybdate (Na₂MoO₄), sterile serum bottles, butyl rubber stoppers.
- Method:
- Prepare slurries (1:3 sediment:medium ratio) under N₂/CO₂ atmosphere.
- Set up triplicate serum bottles: a) Live control, b) +20mM sodium molybdate (SRP inhibitor), c) Killed control (formalin).
- Pre-incubate with molybdate for 24h to fully inhibit SRPs.
- Amend all bottles with a relevant electron donor (e.g., acetate, lactate) and/or sulfate if limited.
- Monitor sulfate depletion over time via ion chromatography or HPLC, or measure H₂S production colorimetrically (methylene blue method).
- Attribute the difference in sulfate consumption between live and molybdate-treated bottles to SRP activity.
Visualization: Comparative Analysis of SRP Diversity & Activity
Title: Environmental Selection of Dominant SRP Groups
Title: Radiotracer Protocol for Measuring In Situ Sulfate Reduction
The Scientist's Toolkit: Key Research Reagent Solutions
| Reagent / Material | Primary Function in SRP Research |
|---|---|
| Sodium Molybdate (Na₂MoO₄) | Specific inhibitor of sulfate reductase enzyme. Used to confirm SRP-mediated activity in incubations. |
| ³⁵S-labeled Sulfate | Radiotracer for sensitive quantification of in situ sulfate reduction rates (SRR) via distillation. |
| Zinc Acetate Solution (20%) | Traps evolved hydrogen sulfide (H₂S/HS⁻) as solid ZnS, preventing loss during sample processing or distillation. |
| Anaerobic Culture Media (e.g., Postgate's medium) | Defined medium for enrichment and isolation of SRPs, with variable sulfate/salinity to mimic target ecosystems. |
| Chromium(II) Chloride (CrCl₂) in Acid | Reducing agent in the single-step distillation method to convert all reduced inorganic sulfur species to H₂S for capture. |
| Methylene Blue Reagents (N,N-Dimethyl-p-phenylenediamine, FeCl₃) | Forms methylene blue dye with H₂S for colorimetric, low-concentration sulfide quantification in culture experiments. |
| Pyrite (FeS₂) & AVS (Acid Volatile Sulfide) Standards | Calibration standards for chromatographic or distillation-based quantification of sulfur speciation end-products. |
Within the context of research comparing freshwater and marine sediment microbial sulfur cycles, understanding the key microbial players is fundamental. This guide compares the functional niches, metabolic pathways, and performance of dominant sulfur-oxidizing bacteria (SOB) consortia across these environments, supported by experimental data.
Key Sulfur-Oxidizing Bacteria: A Functional Comparison
The table below summarizes the primary SOB, their typical niches, and distinguishing metabolic features based on recent cultivation and metagenomic studies.
Table 1: Comparative Overview of Key SOB Genera in Sedimentary Niches
| Genus/Group | Primary Habitat | Preferred Electron Donor(s) | Electron Acceptor | Key Metabolic Pathway(s) | Notable Traits |
|---|---|---|---|---|---|
| Thiobacillus | Freshwater & Marine (Broad) | S²⁻, S⁰, S₂O₃²⁻ (Thiosulfate) | O₂, NO₃⁻ | Sox, rDSR (Partial), | Highly versatile; often dominant in gradient zones. |
| Beggiatoa | Marine & Freshwater Mats | H₂S, S⁰ | O₂, NO₃⁻ | rDSR, Sulfur Globules | Filamentous, large-celled, motile; forms mats at O₂/H₂S interface. |
| Thioploca | Marine & Freshwater (Upwelling) | H₂S | NO₃⁻ | rDSR | Filamentous, lives in sheaths; transports NO₃⁻ down into sulfidic zones. |
| Sulfurimonas | Marine (Hydrothermal, Sediments) | H₂S, S⁰, S₂O₃²⁻ | O₂, NO₃⁻ | Sox | Denitrifier; common in low-O₂, high-sulfide dynamic systems. |
| Chlorobia (PSB) | Freshwater & Marine (Anoxic) | H₂S, S²⁻ | CO₂ (via Photoautotrophy) | rDSR | Green sulfur bacteria; anoxygenic photosynthesis; requires light. |
Experimental Performance Data: Sulfide Oxidation Rates
Quantifying oxidation kinetics is crucial for modeling biogeochemical cycles. The following data, synthesized from recent microsensor and isotope-tracing experiments, compares the performance of SOB communities under defined conditions.
Table 2: Comparative Sulfide Oxidation Rates in Controlled Incubations
| Study System (Source) | Dominant SOB Type | Experimental Condition | Measured Rate (Mean ± SE) | Method |
|---|---|---|---|---|
| Freshwater Sediment (Eutrophic Lake) | Thiobacillus-like, Beggiatoa | 200 μM H₂S, 100 μM O₂ | 1.8 ± 0.2 μmol H₂S cm⁻³ day⁻¹ | Microsensor O₂/H₂S profiles |
| Marine Sediment (Coastal Bay) | Sulfurimonas, Thiobacillus | 150 μM H₂S, 50 μM O₂ | 2.5 ± 0.3 μmol H₂S cm⁻³ day⁻¹ | Microsensor O₂/H₂S profiles |
| Marine Beggiatoa Mats (Hydrothermal) | Beggiatoa spp. | 5 mM H₂S, 20 μM O₂ | 15.0 ± 2.1 μmol H₂S cm⁻² mat day⁻¹ | ³⁵S-Sulfide radiotracer |
| Freshwater Nitrate-Rich | Thioploca spp. | 300 μM H₂S, 2 mM NO₃⁻ | 5.2 ± 0.7 μmol H₂S cm⁻³ day⁻¹ | ¹⁵N-NO₃⁻ isotope pairing |
Experimental Protocol: Microsensor Profiling forIn SituRate Calculation
A standard method for comparing activity across freshwater and marine sites.
- Core Collection: Intact sediment cores are collected via push coring (freshwater) or multi-coring (marine).
- Acclimation: Cores are maintained in a temperature-controlled lab under in situ O₂ conditions for <24h.
- Microsensor Setup: Unisense or similar Clark-type O₂ and H₂S microsensors (tip diameter 10-50 μm) are calibrated.
- Profiling: A motorized micromanipulator lowers sensors vertically into the core at 50-100 μm steps.
- Data Acquisition: Steady-state concentration profiles for O₂ and H₂S are recorded across the sediment-water interface and into the anoxic zone.
- Rate Calculation: Sulfide oxidation rates are calculated from the divergence between the measured O₂ and H₂S flux (using Fick's first law) and the theoretical coupling stoichiometry.
SOB Metabolic Pathways in Sediment Niches
Title: Key Enzymatic Pathways for Sulfur Oxidation in SOB
Comparative Research Workflow: Freshwater vs. Marine SOB Studies
Title: Workflow for Comparing Freshwater and Marine Sediment SOB
The Scientist's Toolkit: Key Research Reagent Solutions
Table 3: Essential Reagents and Materials for SOB Research
| Item/Reagent | Function in Research | Application Example |
|---|---|---|
| Unisense Microsensors (O₂, H₂S, pH) | In situ measurement of chemical gradients at high spatial resolution (μm-scale). | Determining the oxic-anoxic interface and sulfide flux in sediment cores. |
| Sodium Sulfide (Na₂S·9H₂O) | Prepared anoxic stock solution provides a defined H₂S source for incubation experiments. | Amending sediment slurries or bioreactors to test sulfide oxidation kinetics. |
| ¹⁵N-labeled Nitrate (K¹⁵NO₃) | Stable isotope tracer for studying chemolithoautotrophic denitrification coupled to sulfide oxidation. | Quantifying the role of Thiobacillus or Sulfurimonas in nitrate-dependent S-oxidation. |
| ³⁵S-labeled Sulfide (Na₂³⁵S) | Radioisotope tracer for sensitive quantification of sulfide oxidation and sulfate production rates. | Measuring high-rate sulfide oxidation in Beggiatoa mats or pure cultures. |
| Sodium Molybdate (Na₂MoO₄) | A specific inhibitor of sulfate-reducing bacteria (SRB). Used to isolate S-oxidation processes. | Incubations to prevent H₂S replenishment by SRBs, clarifying net oxidation rates. |
| Formalin (or Glutaraldehyde) | Fixative for preserving microbial community structure for microscopic (FISH) analysis. | Fixing sediment samples to identify and quantify filamentous SOB like Beggiatoa. |
| DNA/RNA Shield or RNAlater | Preservative for nucleic acids, stabilizing community composition and gene expression profiles at time of sampling. | Collecting samples for subsequent metagenomic and metatranscriptomic analysis of SOB consortia. |
| Anoxic Balch Tubes/Culture Media | Pre-reduced, anoxic media for the cultivation and enrichment of anaerobic or microaerophilic SOB. | Enriching sulfur-oxidizing denitrifiers (e.g., Sulfurimonas) from marine sediments. |
The Role of Organic Matter Quality and Quantity in Driving Sulfur Cycling Pathways
Comparative Analysis of Sulfur Cycling Pathways in Freshwater vs. Marine Sediments
The quality (e.g., lability, C:N:S ratio) and quantity of organic matter (OM) are primary determinants of microbial metabolic pathways, fundamentally steering sulfur cycling in aquatic sediments. This guide compares key processes and outcomes between freshwater and marine systems, driven by distinct OM regimes.
Table 1: Impact of Organic Matter Characteristics on Sulfur Cycling Metrics
| Parameter | Typical Marine Sediment (High SO₄²⁻, Variable OM) | Typical Freshwater Sediment (Low SO₄²⁻, Often High OM) | Key Implication |
|---|---|---|---|
| Dominant OM Quality | More recalcitrant, lower C:S ratio | More labile, higher C:S ratio | Marine: Sulfate reduction often C-limited; Freshwater: Sulfate reduction often SO₄²⁻-limited |
| Primary Sulfate Reduction Rate (SRR) | 10-1000 nmol cm⁻³ day⁻¹ | 0.1-100 nmol cm⁻³ day⁻¹ | SRR is typically orders of magnitude higher in marine systems due to abundant sulfate. |
| Fraction of Carbon Mineralized via SRR | Up to 50% or more | Usually <10%, can be higher in high-sulfate freshwaters | Carbon flow through sulfur cycle is quantitatively more critical in marine settings. |
| Key Intermediate Produced | Abundant sulfide (H₂S/HS⁻) | Lesser sulfide, more organic sulfur compounds | Marine: Drives extensive Fe-S precipitation & chemosynthesis; Freshwater: More sulfur incorporation into OM. |
| Dominant Terminal Product | Pyrite (FeS₂) | Acid-volatile sulfur (AVS: FeS, H₂S) or organic S | Marine sediments are the largest long-term sink for sulfur as pyrite. |
| Methane vs. Sulfate Reduction | Sulfate reduction inhibits methanogenesis | Methanogenesis often dominates if sulfate is depleted | OM decomposition pathway bifurcation is sharper in marine systems. |
Table 2: Experimental Data from Comparative Studies
| Study Focus | Marine System Result | Freshwater System Result | Experimental Conditions |
|---|---|---|---|
| OM Quantity Effect (SRR vs. OM) | SRR increased linearly with added labile OM (acetate) until sulfate depletion. | SRR increased then plateaued at low OM additions due to rapid sulfate depletion. | Slurry experiments with ¹⁴C-acetate addition; 10 mM (marine) vs. 0.5 mM (freshwater) initial SO₄²⁻. |
| OM Quality Effect (C:N Ratio) | Low C:N OM (algae) led to higher SRR and complete sulfide re-oxidation. High C:N (cellulose) led to lower SRR but higher S⁰ accumulation. | Low C:N OM stimulated both SRR and methanogenesis. High C:N OM favored methanogenesis exclusively. | Mesocosms amended with different OM types; rates measured via radiotracer (³⁵S-SO₄²⁻) and GC. |
| Sulfide Oxidation Pathways | 70-80% coupled to microbial iron/manganese reduction. | 40-50% coupled to dentrification; higher photochemical oxidation. | Stable isotope probing (¹⁸O-H₂O) in intact sediment cores under dark/light cycles. |
Experimental Protocols for Key Cited Studies
Protocol 1: Measuring Sulfate Reduction Rates (SRR) via Radiotracer
Objective: Quantify in situ rates of microbial sulfate reduction. Method:
- Core Collection & Injection: Collect intact sediment cores using a piston corer. At depth intervals (e.g., every cm), inject a small volume (~2-10 µL) of carrier-free ³⁵S-SO₄²⁻ solution (100 kBq) through pre-drilled ports sealed with butyl rubber stoppers.
- Incubation: Incubate cores in situ or at in situ temperature in the lab for 6-24 hours (time set to limit <20% sulfate turnover).
- Termination & Fixation: Section cores by depth. Transfer each section to a vial containing 20 mL of 20% zinc acetate solution to fix all sulfide as ZnS.
- Distillation: Use a two-step acid distillation (cold & hot) under N₂ flow to liberate total reduced inorganic sulfur (TRIS: including H₂S, FeS, S⁰, FeS₂) as H₂S, which is trapped again in fresh zinc acetate.
- Scintillation Counting: Measure radioactivity in both the sulfate (supernatant after precipitation) and TRIS (precipitate from trap) fractions by liquid scintillation counting.
- Calculation: SRR = (³⁵S in TRIS / Total ³⁵S added) * [SO₄²⁻] * (1 / incubation time) * porosity, reported as nmol SO₄²⁻ reduced cm⁻³ day⁻¹.
Protocol 2: Organic Matter Amendment Mesocosm Experiment
Objective: Determine the effect of OM quality on sulfur pathway partitioning. Method:
- Sediment Preparation: Homogenize fresh sediment from target site under an N₂ atmosphere to preserve redox chemistry.
- Amendment Setup: Distribute sediment into sealed serum bottles. Create treatments amended with: a) Sodium Acetate (labile), b) Ground algal biomass (low C:N), c) Cellulose powder (high C:N), d) Unamended control. Equilibrate with appropriate overlying water (artificial seawater/freshwater).
- Monitoring: Monitor headspace for CH₄ (via GC-FID) and H₂S (via microsensor or colorimetry). Periodically sacrifice replicates for porewater analysis (SO₄²⁻, Fe²⁺, DOC via IC/ICP-MS/TOC analyzer) and solid-phase sulfur speciation (via sequential extraction for AVS, S⁰, CRS).
- Rate Measurements: At peak activity, measure process rates using ¹³C-DIC for mineralisation and ³⁵S-SO₄²⁻ for SRR (see Protocol 1).
- Community Analysis: Extract DNA from sediment for 16S rRNA gene amplicon sequencing (targeting dsrB gene for sulfate-reducers) to link pathway shifts to microbial community structure.
Visualizations
Diagram 1: OM Quality Drives Sulfur Pathway Branching
Diagram 2: Comparative Experimental Workflow for SRR
The Scientist's Toolkit: Key Research Reagent Solutions
| Item | Function in Sulfur Cycling Research |
|---|---|
| ³⁵S-Sulfate Radiotracer | Gold-standard for measuring in situ sulfate reduction rates (SRR) via quantification of reduced ³⁵S products. |
| Carrier-free Na₂³⁵SO₄ | High-specific-activity tracer allows minimal perturbation to ambient sulfate pools during incubation. |
| Zinc Acetate Solution (20% w/v) | Fixative that instantly traps sulfide as insoluble zinc sulfide (ZnS), halting microbial activity and preserving S intermediates. |
| Artificial Porewater/Seawater | Defined medium for mesocosm experiments, allowing precise control of ion concentrations (SO₄²⁻, Fe²⁺, Cl⁻). |
| Sequential Extraction Chemicals | (i) 1M HCl for Acid-Volatile Sulfide (AVS: FeS, H₂S). (ii) Chromium(II) chloride for Chromium-Reducible Sulfur (CRS: S⁰, FeS₂). Enables operational speciation of solid-phase S pools. |
| ¹³C-labeled Organic Substrates | (e.g., ¹³C-acetate, ¹³C-algae). Used in stable isotope probing (SIP) to trace carbon flow from specific OM into SRR-derived DIC and biomass. |
| dsrB/dsrA Gene Primers | PCR primers targeting the dissimilatory sulfite reductase gene, essential for quantifying and sequencing active sulfate-reducing microbial communities. |
| Anoxic Balat or Glove Box | Critical for sample processing and reagent preparation without oxidation of sensitive sulfur species (e.g., sulfide, Fe²⁺). |
A comprehensive understanding of microbial sulfur cycling in sedimentary environments is hampered by the vast majority of microbial life that remains uncultivated. This guide compares foundational knowledge gaps and methodological approaches for studying these "microbial dark matter" populations in freshwater versus marine sediments.
Comparison of Foundational Knowledge Gaps
Table 1: Knowledge Gaps in Freshwater vs. Marine Sediment Sulfur-Cycling Taxa
| Aspect | Freshwater Sediment Lineages | Marine Sediment Lineages |
|---|---|---|
| Dominant Uncultivated Taxa | Sva0485 clade (within Desulfobacterota), Bathyarchaeia subgroups (BA1, BA6). | ANME-1/2/3 (Anaerobic Methanotrophs), HotSeep-1, SEEP-SRB1g, Desulfatiglans-related. |
| Estimated Relative Abundance* | ~15-30% of microbial community (lacustrine). | ~20-40% of microbial community (continental shelf). |
| Key Metabolic Inferences (from genomes) | Sulfate reduction, fermentation, potential for methylotrophy (Bathyarchaeia). | Sulfate reduction coupled to methane oxidation (ANME-SRB consortia), sulfur disproportionation. |
| Primary Cultivation Barrier | Low sulfate concentrations; syntrophic dependencies; slow growth. | High pressure simulation; strict anaerobiosis; solid-phase sulfur species. |
| Metagenomic Assembly Quality (avg. completeness) | Medium-Low (Fragmented due to high diversity). | Medium-High (Better biomass, established protocols). |
| Geo-Environmental Drivers | Sulfate & organic carbon flux; lake trophic status; Fe/Mn oxides. | Sulfate-Methane Transition Zone (SMTZ) depth; sedimentation rate; methane flux. |
*Data from recent metagenomic studies (2023-2024). Estimates represent percentage of 16S rRNA gene reads classified within major uncultivated candidate phyla/classes.
Table 2: Method Comparison for Resolving Uncultivated Lineages
| Method | Principle | Key Performance Metric | Application to Freshwater | Application to Marine |
|---|---|---|---|---|
| Shotgun Metagenomics | Direct sequencing of total DNA. | % of community genomes binned. | High diversity limits bin quality. | Higher biomass yields more complete genomes. |
| Metatranscriptomics | Sequencing of total RNA. | TPM of key sulfur cycle genes (dsrA, aprA, sox). | Captures rapid metabolic shifts. | Links ANME/SRB activity to geochemistry. |
| Single-Cell Genomics | Genome amplification from single cells. | Genome recovery completeness. | Challenging due to cell walls & inhibitors. | Successful for ANME; requires fluorescence labeling. |
| Stable Isotope Probing (SIP) | Tracking heavy isotope (13C, 34S) into biomass. | % of labeled DNA in a taxon. | Effective with 13C-acetate or bicarbonate. | Gold standard for ANME activity with 13C-CH4. |
| Nanoscale SIMS (nanoSIMS) | Isotope imaging at single-cell level. | 34S/32S or 13C/12C enrichment per cell. | Limited by cell density and size. | Powerful for ANME-SRB consortium mapping. |
Experimental Protocols for Key Studies
Protocol 1: High-Pressure Continuous Cultivation of Marine ANME Consortia
- Objective: Maintain and study anaerobic methanotrophic archaea (ANME) and their sulfate-reducing bacterial (SRB) partners under in situ pressure.
- Materials: High-pressure bioreactor system (e.g., stainless steel chemostat), anoxic artificial seawater medium, CH4/CO2 (80/20) gas mix, strict anoxia workstation.
- Procedure:
- Inoculate reactor with marine sediment from a Sulfate-Methane Transition Zone (SMTZ).
- Continuously feed anoxic, sulfate-rich medium at a slow dilution rate (0.01-0.05 day⁻¹).
- Pressurize the system to 10 MPa using the CH4/CO2 mix as both substrate and pressure source.
- Monitor sulfide production, methane consumption, and sulfate depletion.
- Periodically sample biomass for omics analyses via a high-pressure sampling port without decompression.
Protocol 2: Stable Isotope Probing (SIP) for Freshwater Sediment Sulfate Reducers
- Objective: Identify active, uncultivated sulfate-reducing bacteria in low-sulfate environments.
- Materials: Freshwater sediment cores, anoxic mineral salts medium, Na₂³⁴SO₄ (95 atom%), cesium trifluoroacetate (CsTFA) density gradient solution, ultracentrifuge.
- Procedure:
- Incubate sediment slurries with 1 mM Na₂³⁴SO₄ under N₂/CO₂ atmosphere.
- Harvest biomass after 4-8 weeks. Extract total genomic DNA.
- Mix DNA with CsTFA solution to a final density of 1.72 g/mL.
- Perform ultracentrifugation at 177,000 x g for 48 hours at 20°C.
- Fractionate the gradient, determine buoyant density of each fraction.
- Amplify and sequence 16S rRNA genes from "heavy" (³⁴S-labeled) DNA fractions to identify active taxa.
Diagram: Integrated Multi-Omics Workflow for Uncultivated Taxa
(Title: Multi-omics workflow for studying uncultivated lineages)
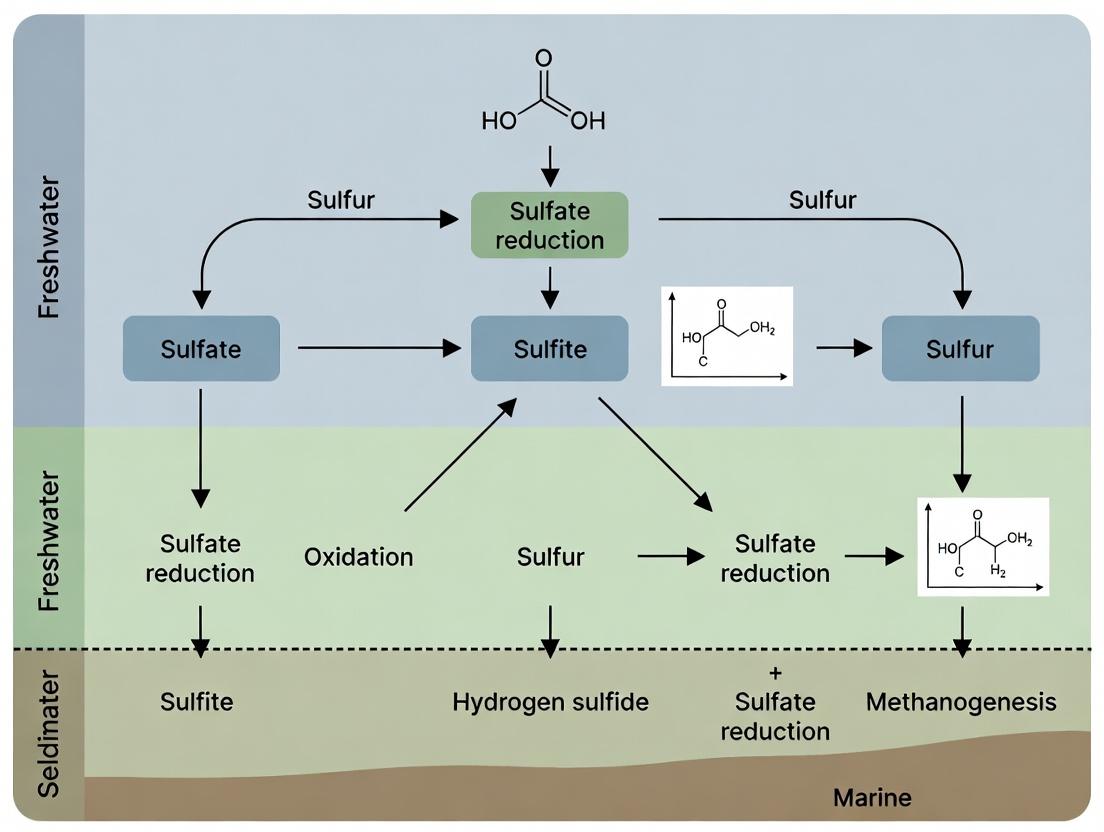
Diagram: Key Sulfur Cycling Pathways in Sediments
(Title: Key sulfur cycling pathways in freshwater and marine sediments)
The Scientist's Toolkit: Research Reagent Solutions
Table 3: Essential Reagents and Materials for Sulfur-Cycling Microbe Research
| Item | Function & Application | Key Supplier Examples |
|---|---|---|
| Anoxic Baltschik | Creates and maintains an oxygen-free atmosphere for sample processing and cultivation. | Sigma-Aldrich, Coy Laboratory Products |
| Sodium [³⁴S]-Sulfate | Stable isotope tracer for SIP experiments to identify active sulfate reducers. | Cambridge Isotope Laboratories |
| ³²P/³³P-Radiolabeled Sulfate | High-sensitivity tracer for measuring sulfate reduction rates (SRR) in sediments. | PerkinElmer, American Radiolabeled Chemicals |
| Cesium Trifluoroacetate (CsTFA) | Gradient medium for density-based separation of isotopically labeled (heavy) DNA/RNA in SIP. | Merck, MP Biomedicals |
| Methanogenic & Sulfidogenic Media | Defined, anoxic culture media for enrichment of target functional groups. | ATCC, DSMZ |
| Detergents for Cell Lysis (e.g., SDS) | Critical for efficient DNA/RNA extraction from sediment matrices and tough cell walls. | Thermo Fisher Scientific |
| Molybdate (Na₂MoO₄) | Specific inhibitor of sulfate reduction; used to confirm process in microcosms. | Sigma-Aldrich |
| Bromoethanesulfonate (BES) | Specific inhibitor of methanogenesis; used to study AOM consortia. | TCI Chemicals |
| Fluorescence In Situ Hybridization (FISH) Probes | Oligonucleotide probes targeting 16S rRNA of uncultivated groups (e.g., ANME, Sva0485). | Biomers, Thermo Fisher Scientific |
Advanced Techniques for Probing Sediment Sulfur Microbiology and Biotechnological Potential
Within the broader thesis investigating microbial sulfur cycling processes in freshwater versus marine sediments, selecting the appropriate omics workflow is critical. Each approach—metagenomics, metatranscriptomics, and metaproteomics—provides a distinct layer of community analysis, from functional potential to active expression and protein synthesis. This guide objectively compares these workflows, focusing on their performance in elucidating key sulfur pathways like dissimilatory sulfate reduction (DSR), sulfur oxidation, and disproportionation in sediment environments.
Workflow Comparison: Technical Performance & Application
The table below summarizes the core performance metrics, strengths, and limitations of each omics approach for sediment sulfur cycling research, based on current methodologies and published benchmarks.
Table 1: Comparative Performance of Omics Workflows for Sediment Microbial Community Analysis
| Feature | Metagenomics | Metatranscriptomics | Metaproteomics |
|---|---|---|---|
| Target Molecule | Total DNA (genomic content) | Total RNA (mostly mRNA) | Proteins & peptides |
| Information Gained | Functional & taxonomic potential (e.g., presence of dsrAB, soxB genes) | Active gene expression (e.g., transcription of sulfur metabolism genes) | Functional protein expression & post-translational modifications |
| Sensitivity | Moderate-High (detects rare taxa) | High (captures dynamic expression) | Low-Moderate (limited by protein abundance & extraction efficiency) |
| Technical Difficulty | Moderate (standardized) | High (RNA instability, rRNA depletion) | Very High (complex extraction, mass spectrometry) |
| Turnaround Time | 1-2 weeks (post-library prep) | 2-3 weeks (includes cDNA conversion) | 3-4+ weeks (including LC-MS/MS & analysis) |
| Quantitative Accuracy | Semi-quantitative (copy number bias) | Quantitative (with spike-in standards) | Semi-quantitative (label-free or labelled) |
| Key Limitation for Sediments | Co-extraction of humic acids inhibits sequencing; does not indicate activity. | mRNA turnover is rapid; difficult to correlate directly with process rates. | Low protein yield from sediments; complex data analysis. |
| Best for Sulfur Cycling Research | Cataloging metabolic potential across salinity gradients. | Identifying in situ responses to sulfur compounds (e.g., sulfide pulses). | Confirming active metabolic pathways & enzyme abundance. |
Experimental Protocols for Sediment Sulfur Cycling Studies
Protocol 1: Sediment Metagenomic Sequencing fordsrBGene Diversity
Objective: To compare the genetic potential for sulfate reduction between freshwater and marine sediments.
- Sediment Core Sampling: Collect triplicate cores (0-5cm depth) from freshwater (lake) and marine (coastal) sites using a sterile corer. Process anoxically.
- DNA Extraction: Use the DNeasy PowerSoil Pro Kit (QIAGEN) with modified bead-beating (2x 45 sec) to lyse tough cells. Include a humic acid removal step (e.g., PVPP treatment).
- Library Preparation & Sequencing: Fragment DNA (Covaris), prepare libraries using the Illumina DNA Prep Kit, and sequence on an Illumina NovaSeq (2x150 bp, 20M reads per sample).
- Bioinformatic Analysis: Assemble reads (MEGAHIT), predict genes (Prodigal), and identify dsrAB genes via hidden Markov models (HMMs) against the MiDAS 4.8.2 database.
Protocol 2: Metatranscriptomic Profiling of Sulfide Oxidation Response
Objective: To profile active gene expression in marine sediments after a sulfide amendment.
- Microcosm Experiment: Establish sediment slurries from marine site. Treat triplicates with Na₂S (1mM) or control (sterile anoxic water). Incubate in the dark for 6 hours.
- RNA Preservation & Extraction: Preserve sediment immediately in RNAlater, then extract using the RNeasy PowerSoil Total RNA Kit. Treat with DNase I.
- rRNA Depletion & Sequencing: Deplete ribosomal RNA using the Illumina Ribo-Zero Plus kit. Construct cDNA libraries (NEBNext Ultra II RNA Library Prep) and sequence on Illumina NextSeq 2000 (2x100 bp).
- Analysis: Map reads to a curated sulfur gene database (e.g., SEED, KEGG) using Salmon for quantification. Differential expression analysis is performed with DESeq2.
Protocol 3: Metaproteomic Analysis of Active Sulfur Pathways
Objective: To identify and quantify expressed proteins in sulfur-cycling freshwater sediment communities.
- Protein Extraction: Lyse 5g of wet sediment using a buffer containing 1% SDS followed by bead-beating. Precipitate proteins using the ReadyPrep 2-D Cleanup Kit (Bio-Rad).
- Digestion & Peptide Cleanup: Digest proteins with trypsin using the Filter-Aided Sample Preparation (FASP) method. Desalt peptides using C18 Spin Columns.
- LC-MS/MS Analysis: Separate peptides on a nanoElute UHPLC (Bruker) coupled to a timsTOF Pro 2 mass spectrometer. Use data-independent acquisition (DIA) mode.
- Protein Identification & Quantification: Search spectra against a sample-specific metagenome-derived database using DIA-NN and MaxQuant. Quantify label-free using peak intensities.
Workflow Visualizations
Diagram 1: Integrated Omics Workflow for Sediment Sulfur Cycling
Title: Integrated Multi-Omics Workflow for Sediment Analysis
Diagram 2: Key Sulfur Cycling Pathways Targeted by Omics
Title: Microbial Sulfur Cycling Pathways & Key Genes
The Scientist's Toolkit: Essential Research Reagents & Materials
Table 2: Key Research Reagent Solutions for Sediment Omics
| Item | Function in Sulfur Cycling Omics | Example Product/Brand |
|---|---|---|
| Humic Acid Removal Columns | Critical for removing PCR/sequencing inhibitors from sediment DNA/RNA extracts. | OneStep PCR Inhibitor Removal Kit (Zymo), PVPP Spin Columns. |
| RNAlater Stabilization Solution | Preserves in situ RNA integrity immediately upon sediment sampling for metatranscriptomics. | RNAlater (Thermo Fisher). |
| Ribo-Zero Depletion Kits | Removes abundant rRNA to enrich messenger RNA (mRNA) for microbial community transcriptomics. | Ribo-Zero Plus (Illumina). |
| Mass Spectrometry Grade Trypsin | Enzyme for digesting complex protein mixtures into peptides for LC-MS/MS in metaproteomics. | Sequencing Grade Modified Trypsin (Promega). |
| Stable Isotope Probes (¹³C, ³⁴S) | Used in SIP-omics to link function (e.g., sulfide oxidation) to identity in active community members. | ³⁴S-Sodium Sulfide (Cambridge Isotopes). |
| DIA Mass Spectrometry Standards | Provides quantitative benchmarks for label-free metaproteomic quantification across samples. | ProCan-DIA Serum Protein Library (Sigma). |
| Custom HMM Databases | Curated gene profiles (e.g., for dsrAB, soxB) for accurate annotation of omics data. | FunGene resources, MiDAS database. |
This guide compares methodologies for tracking microbial activity in sulfur cycling, specifically Stable Isotope Probing (SIP) with ³⁴S and ¹³C versus Radioisotope Tracer methods using ³⁵S. The comparison is framed within a thesis investigating the distinct processes governing microbial sulfur cycling in freshwater versus marine sediments. Marine systems are often sulfate-rich, dominated by sulfate reduction, while freshwater sediments are typically sulfate-poor, with processes like sulfur disproportionation and iron-sulfur interactions playing larger roles. The selection of an appropriate isotopic tracer is critical for accurate process quantification in these differing environments.
Methodological Comparison & Experimental Data
Table 1: Core Characteristics of Isotopic Tracers for Microbial Sulfur Cycling
| Feature | ³⁴S Stable Isotope Probing | ¹³C Stable Isotope Probing (for Sulfur Cyclers) | ³⁵S Radioisotope Tracer |
|---|---|---|---|
| Isotope Type | Stable, non-radioactive | Stable, non-radioactive | Radioactive (β⁻ emitter) |
| Primary Target Process | Direct sulfur metabolism (e.g., sulfate reduction, sulfide oxidation) | Assimilation of carbon by sulfur-oxidizing or reducing microbes | High-sensitivity rate measurements of sulfate reduction (SRR) |
| Detection Method | Isotope Ratio Mass Spectrometry (IRMS), NanoSIMS | IRMS, GC-MS, PLFA-SIP, NanoSIMS | Liquid Scintillation Counting (LSC) |
| Spatial Resolution | Bulk to micro-scale (with NanoSIMS) | Bulk to micro-scale (with NanoSIMS) | Typically bulk sediment |
| Temporal Resolution | Integrates over incubation period | Integrates over incubation period | Can be used for short-term kinetic studies |
| Quantitative Output | Fraction of sulfur derived from tracer, isotopic enrichment | Fraction of carbon derived from tracer, identifies active cells | Radiotracer incorporated into sulfide (AVS, CRS), calculates SRR |
| Safety & Regulation | Minimal restrictions | Minimal restrictions | Strict licensing, containment, and waste disposal |
| Best Suited For | Linking taxonomy to function via DNA/RNA-SIP, micro-scale mapping | Identifying active consumers of sulfur-derived carbon (e.g., lithotrophs) | Most sensitive rate measurements in low-activity environments |
Table 2: Performance in Freshwater vs. Marine Sediment Contexts
| Parameter | ³⁴S-SIP | ¹³C-SIP (e.g., with ¹³C-CO₂ or ¹³C-acetate) | ³⁵S-SO₄²⁻ Radiotracer |
|---|---|---|---|
| Sensitivity in Low-Sulfate (Freshwater) | Challenging due to low sulfate pools; requires high enrichment. | Effective for identifying active microbes despite low sulfate. | Gold standard. Extremely sensitive; can use carrier-free tracer. |
| Sensitivity in Sulfate-Rich (Marine) | Excellent for tracing sulfur into biomass/biominerals. | Excellent for identifying syntrophs or autotrophs in the sulfur cycle. | Highly sensitive; risk of tracer dilution by ambient sulfate. |
| Process Identification | Direct link to S-metabolism. Can identify novel pathways. | Indirect. Identifies microbes assimilating carbon from sulfur-cycle linked processes. | Measures bulk sulfate reduction rate only; no taxonomic info. |
| Integration with Omics | Excellent. Compatible with ³⁴S-DNA/RNA-SIP for functional genomics. | Excellent. The established method for DNA/RNA-SIP. | Not directly compatible. |
| Typical Incubation Time | Days to weeks | Weeks | Hours to days |
| Key Limitation | High cost of enriched ³⁴S substrates; complex analysis. | Indirect link to sulfur metabolism; carbon may enter general metabolism. | No phylogenetic information; radioactive hazards. |
Detailed Experimental Protocols
Protocol 1: ³⁵S-Sulfate Radiotracer Core Injection for Sulfate Reduction Rates (SRR)
Objective: To measure in situ sulfate reduction rates in sediment cores.
- Preparation: Under anoxic conditions, prepare a carrier-free ³⁵S-Na₂SO₄ solution in sterile, anoxic water or artificial seawater/freshwater.
- Injection: Using a microsyringe, inject small volumes (typically 1-10 µL) of the tracer solution at regular depth intervals (e.g., every cm) through sealed ports in the core liner. Inject radially into the sediment.
- Incubation: Incubate the core in the dark at in situ temperature for a defined period (4-24 hours). Terminate by sectioning the core into depth intervals and immediately transferring slices to suitable fixative.
- Distillation & Counting: Use a single-step acidic chromium distillation to convert all reduced inorganic sulfur species (²⁵S-H₂S, ²⁵S-FeS, ²⁵S-S⁰) into Ag₂S. Wash, dry, and weigh the Ag₂S precipitate. Measure its radioactivity by liquid scintillation counting.
- Calculation: SRR = (²⁵S in reduced sulfur phases / Total ²⁵S injected) * (Ambient SO₄²⁻ concentration / Incubation time).
Protocol 2: ¹³C/³⁴S-DNA Stable Isotope Probing Workflow
Objective: To identify active microbial taxa assimilating labeled carbon or sulfur.
- Microcosm Setup: Establish sediment slurries or intact cores from marine or freshwater sites. Create anoxic conditions as needed.
- Tracer Addition: Amend microcosms with either ¹³C-labeled substrate (e.g., ¹³C-acetate for sulfate reducers, ¹³C-CO₂ for sulfur oxidizers) or ³⁴S-labeled substrate (e.g., ³⁴S-SO₄²⁻, ³⁴S-S⁰). Use a heavy-isotope-enriched control and a ¹²C/³²S natural abundance control.
- Long-Term Incubation: Incubate for weeks to allow sufficient isotope assimilation into microbial DNA. Monitor geochemistry (e.g., sulfate, sulfide).
- Nucleic Acid Extraction: Extract total community DNA from samples using a standard kit (e.g., PowerSoil DNA Isolation Kit).
- Density Gradient Centrifugation: Mix DNA with a cesium trifluoroacetate (CsTFA) gradient solution and ultracentrifuge at high speed (e.g., 177,000 g for 40+ hours). Fractionate the gradient to separate "heavy" (¹³C/³⁴S-DNA) from "light" (¹²C/³²S-DNA) DNA.
- Molecular Analysis: Quantify isotope incorporation in fractions by qPCR or IRMS. Amplify 16S rRNA genes from heavy and light fractions via PCR, followed by sequencing (amplicon or metagenomic) to identify taxa in the heavy (active) population.
Visualizations
Title: Stable Isotope Probing (SIP) Experimental Workflow
Title: Tracer Selection Decision Logic
The Scientist's Toolkit: Research Reagent Solutions
| Item | Function & Application |
|---|---|
| Carrier-free ³⁵S-Na₂SO₄ | High-specific-activity radiotracer for sensitive measurement of sulfate reduction rates (SRR) in sediments. |
| Enriched ³⁴S-Na₂SO₄ (≥95%) | Stable tracer for direct tracking of sulfur into microbial biomass, minerals, or gases for IRMS/NanoSIMS. |
| ¹³C-labeled Substrates (e.g., ¹³C-acetate, ¹³C-CO₂, ¹³C-bicarbonate) | Tracers for identifying microbes assimilating carbon via specific processes (e.g., sulfate reducer assimilation, chemolithoautotrophy). |
| Cesium Trifluoroacetate (CsTFA) | Density gradient medium for separating "heavy" isotope-labeled nucleic acids from "light" ones during SIP. |
| Anoxic Artificial Media (Freshwater/Marine) | For creating defined incubation conditions that mimic in situ geochemistry without background substrate interference. |
| Chromium(II) Chloride Solution | Strong reducing agent used in distillation traps to convert all reduced sulfur species to H₂S for ³⁵S-SRR quantification. |
| Zinc Acetate Traps | Used to fix distilled H₂S as solid ZnS, which is then precipitated as Ag₂S for scintillation counting or IRMS analysis. |
| DNA/RNA Shield & Anoxic Extraction Kits | Preserve in situ microbial nucleic acids and enable extraction under anoxia to prevent oxidative changes in sulfur cycle gene expression. |
Electrochemical and Microsensor Techniques for In Situ Rate Measurements and Geochemical Profiling
This comparison guide is framed within a thesis investigating the divergent microbial sulfur cycling processes in freshwater versus marine sediments. The critical requirement for such research is the ability to perform in situ, high-resolution rate measurements and geochemical profiling. Electrochemical and microsensor techniques are the primary tools for this task. This guide objectively compares the performance of key systems and methodologies, supported by experimental data.
Technique Comparison: Key Performance Metrics
Table 1: Comparison of Primary In Situ Profiling Techniques
| Technique | Spatial Resolution | Measurement Capability (Sulfur Species) | Response Time (t₉₀) | Deployment Depth (Sediment) | Key Limitation in S-Cycle Research |
|---|---|---|---|---|---|
| Amperometric Microsensors (H₂S, O₂) | 1-10 µm | H₂S, O₂, S⁰ | < 0.5 s | ≤ 50 cm | Measures only redox-active species; susceptible to biofilm fouling. |
| Potentiometric Microsensors (pH, S²⁻) | 1-20 µm | S²⁻ (via pH/Ag₂S) | 1-5 s | ≤ 30 cm | Interference from other ions (e.g., Cl⁻ in marine settings). |
| Voltammetric (Au/Hg) Microelectrodes | 10-50 µm | O₂, H₂S, S⁰, S₂O₃²⁻, Fe²⁺, Mn²⁺ | 0.1-1 s | ≤ 20 cm | Requires skilled operator; complex data interpretation. |
| Diffusive Gradients in Thin Films (DGT) | 1-2 mm | S²⁻, Fe²⁺, PO₄³⁻ | Time-integrated (hrs-days) | Surface layers | Provides time-integrated, not instantaneous, concentration. |
| Planar Optodes (O₂, pH) | 50-200 µm | O₂, pH (indirect for CO₂) | 0.3-3 s | 2D surface imaging | Limited to few analytes; difficult deep sediment penetration. |
Table 2: Performance in Freshwater vs. Marine Sediment Contexts
| Experimental Parameter | Freshwater Sediment Application | Marine Sediment Application | Recommended Tool for Thesis Context |
|---|---|---|---|
| Sulfide Gradient Mapping | Sharp, shallow gradients (µM over mm). | Broader, deeper gradients (mM over cm). | Au-amalgam Voltammetry for multi-species profiling. |
| Bioturbation/Bioirrigation Impact | High sensitivity needed for dynamic O₂ zones. | Larger macrofauna create complex 3D patterns. | O₂ Microsensor Arrays for high-res 1D profiling. |
| Salinity Interference | Minimal. S²⁻ detection stable. | High [Cl⁻] interferes with Ag-based sensors. | Cathodic Stripping Voltammetry (for S²⁻) or DGT. |
| S₈⁰ / Polysulfide Detection | Often a key intermediate. | Crucial in oxidation processes near mat surfaces. | Au/Hg Voltammetry is unrivaled for S⁰ detection. |
| In Situ Rate Measurement (SOR) | Microsensor H₂S/O₂ profiles + modeling. | Requires accounting for Fe-S precipitation. | Combination: Microsensors (O₂, H₂S) + DGT (Fe²⁺). |
Experimental Protocols for Key Comparisons
Protocol 1:In SituSulfate Reduction Rate (SRR) via Microsensor Profiling and Modeling
Objective: Quantify local sulfate reduction rates from microsensor profiles of O₂ and H₂S. Methodology:
- Deploy a motorized micromanipulator to insert O₂ and H₂S microsensors into sediment at 50-100 µm depth increments.
- Record steady-state concentration profiles for both analytes.
- Apply a 1D diffusion-reaction model (e.g., using software like PROFILE). The SRR is derived from the curvature of the H₂S profile below the oxic-anoxic interface, factoring in production, diffusion, and reaction with Fe²⁺ or O₂.
- Comparison Basis: This method provides high-resolution in situ rates but is indirect. It is compared to the ³⁵S-radiotracer incubation method (core injection, incubation, freezing, sectioning, and distillation), which is destructive but considered the gold standard for bulk SRR.
Protocol 2: DirectIn SituVoltammetric Scanning of Sulfur Species
Objective: Directly identify and semi-quantify multiple sulfur redox species simultaneously. Methodology:
- Use a gold-amalgam (Au/Hg) microelectrode (100 µm diameter) as the working electrode, with Ag/AgCl reference and Pt counter electrodes.
- Perform Linear Sweep Voltammetry (LSV) or Cathodic Stripping Voltammetry (CSV) in situ at depth intervals.
- Scans typically run from -0.1 V to -1.4 V (vs. Ag/AgCl). Key peaks: O₂ (-0.1 to -0.3 V), S⁰ (-0.5 V), S₂O₃²⁻ (-0.6 V), Mn²⁺ (-1.2 V), Fe²⁺ (-1.4 V). H₂S is detected as an anodic current upon scanning back.
- Comparison Basis: This single-electrode multi-analyte capability is compared against deploying multiple individual ion-selective microsensors, which is technically more challenging and measures fewer species.
Visualization of Workflows and Relationships
Diagram 1: Technique Selection Workflow for Sulfur Cycle Research
Diagram 2: Microsensor-Based In Situ Sulfate Reduction Rate Calculation
The Scientist's Toolkit: Research Reagent & Material Solutions
Table 3: Essential Materials for Electrochemical Microsensor Studies of Sulfur Cycling
| Item | Function & Specification | Application Note (Freshwater vs. Marine) |
|---|---|---|
| Gold-Amalgam Microelectrode | Working electrode for voltammetry. Au wire (100 µm) coated with Hg. | Critical for both. The only tool for direct in situ S⁰ detection in mats or gradients. |
| Clark-type O₂ Microsensor | Amperometric, guarded cathode. Tip 5-20 µm. | Higher sensitivity needed for freshwater due to lower O₂ solubility and steeper gradients. |
| H₂S Microsensor (Amperometric) | Permeable membrane, oxidized at Pt anode. | Calibration must use appropriate ionic strength background (NaCl for marine, NaClO₄ for freshwater). |
| Ag/AgCl Reference Electrode | Stable reference potential. Sealed with low-drift electrolyte. | Use double-junction design with sediment-like electrolyte to prevent Cl⁻ contamination in freshwater. |
| Motorized Micromanipulator | Precise depth positioning (µm resolution). | Essential for high-resolution 1D profiling in both systems. Vibration dampening is critical. |
| Multi-Channel Potentiostat | For voltammetric scans or multiple amperometric sensors. | Must have picoamp sensitivity for O₂ and nA sensitivity for H₂S/voltammetry. |
| DGT Probe (for Fe²⁺, S²⁻) | Passive sampler with binding gel. | Particularly useful in marine sediments to quantify Fe²⁺ availability, a major H₂S sink. |
| Deoxygenated Calibration Chamber | Glass chamber with continuous N₂/Ar flow. | For calibrating O₂ and H₂S sensors in a zero-O₂ environment at in situ temperature. |
| Sulfide Antioxidant Buffer (SAOB) | Alkaline solution (NaOH, EDTA, Ascorbic Acid) for S²⁻ ISE. | Prevents oxidation during S²⁻ sensor calibration. EDTA concentration may need adjustment for high Ca²⁺ freshwater. |
This comparison guide is framed within a broader thesis investigating the distinct microbial sulfur-cycling processes in freshwater versus marine sediments. Cultivating the fastidious microbes responsible—such as sulfate-reducing prokaryotes (SRPs), sulfur-oxidizing bacteria (SOB), and anaerobic methanotrophic archaea (ANME)—requires precise media design and bioreactor engineering. This guide objectively compares key cultivation approaches, supported by experimental data.
Comparison of Media Formulations for Key Functional Groups
Table 1: Comparison of Defined Media for Sulfur-Cycling Microbes from Different Habitats
| Microbe Functional Group (Example) | Habitat Origin | Key Media Components & Concentrations | Electron Donor/ Acceptor | Redox Potential (mV) / pH | Typical Doubling Time (hrs) | Yield (g protein/mol e- donor) | Key Inhibitors/ Challenges |
|---|---|---|---|---|---|---|---|
| Desulfovibrio vulgaris (SRP) | Freshwater Sediment | 30 mM Lactate, 20 mM SO₄²⁻, 0.001% Yeast Extract, 0.5 g/L Cysteine (reducing agent) | Lactate / SO₄²⁻ | -200 to -300 / 7.0-7.5 | 6-8 | 3.5 | O₂ ingress, lack of trace elements (Se, W, Ni). |
| Desulfobacter hydrogenophilus (SRP) | Marine Sediment | 20 mM Acetate, 25 mM SO₄²⁻, 0.5% NaCl, Vitamin B12, Tungstate | Acetate / SO₄²⁻ | -220 / 7.5-7.8 | 12-18 | 2.1 | Requires high sulfide tolerance (>2 mM). |
| Thiomicrospira crunogena (Chemolithoautotrophic SOB) | Marine Hydrothermal Vent | 10 mM Thiosulfate, CO₂ (gas phase), 2.5% NaCl, 10x Wolfe's Minerals | S₂O₃²⁻ / O₂ (5% in headspace) | +100 to +200 / 6.8 | 5-7 | 0.8 | O₂ toxicity if >10%, elemental sulfur precipitation. |
| "Candidatus Methanoperedens" (ANME-2d) | Freshwater Sediment | 50 mM CH₄ (headspace), 10 mM NO₃⁻, 1 mM Fe(II), 0.02% Yeast Extract | CH₄ / NO₃⁻ | -150 to -250 / 7.0 | ~240 (10 days) | 0.05 (est.) | Extremely slow growth; syntrophic partner required. |
| Beggiatoa spp. (Filamentous SOB) | Marine/ Freshwater Interface | 5 mM Sulfide, 5 mM Acetate, 1% Agar, 0.5-3% NaCl (variable) | H₂S / O₂ (gradient) | Microaerobic / 7.2 | 24-48 (biomass accumulation) | N/A | Requires solid medium and opposing S²⁻/O₂ gradients. |
Experimental Protocol 1: Establishing a Defined Low-Sulfate Freshwater Medium for SRPs
Objective: To cultivate freshwater SRPs with minimal artifacts from high sulfide production.
- Preparation: Anoxic chamber (97% N₂, 3% H₂). Boil 1L milli-Q water, cool under N₂ sparging.
- Basal Medium: Add (per liter): 0.5 g NH₄Cl, 0.1 g KCl, 0.2 g KH₂PO₄, 0.5 g NaCl, 0.15 g CaCl₂·2H₂O, 0.5 g MgCl₂·6H₂O.
- Trace Elements: Add 1 mL SL-10 trace element solution (contains Fe, Zn, Co, etc.).
- Vitamins: Add 1 mL Wolfe's vitamin solution.
- Redox Control: Add 0.5 g/L sodium thioglycolate and 0.0001% resazurin. Titrate with 1M Na₂S·9H₂O until colorless.
- Sulfur Source: Add sterile Na₂SO₄ stock to final 2-5 mM (freshwater level) vs. control at 20 mM (marine level).
- Electron Donor: Add sterile sodium lactate to final 20 mM.
- Inoculation: Inject 5% (v/v) sediment slurry homogenate under N₂ flow into serum bottles.
- Incubation: 30°C, static. Monitor sulfide production via HPLC or methylene blue assay.
Table 2: Comparison of Bioreactor Systems for Sulfur-Cycling Microbial Communities
| Bioreactor Type | Key Operational Principle | Application in Sulfur Cycling | Max Cell Density (cells/mL) | Control Parameters | Major Advantage | Major Limitation |
|---|---|---|---|---|---|---|
| Continuous Stirred-Tank Reactor (CSTR) | Continuous inflow/outflow, homogeneous mixing. | Enrichment of planktonic SRPs or SOBs. | 10⁸ - 10⁹ | Dilution rate, pH, stirring. | Steady-state kinetics study. | Washes out slow-growing microbes (e.g., ANME). |
| Sequential Batch Reactor (SBR) | Fill, react, settle, decant cycles. | Enrichment of slow-growing, biofilm-forming communities. | 10⁸ - 10⁹ (biofilm) | Cycle timing, settling time. | Selects for biomass retention. | Cycle complexity, potential for O₂ intrusion. |
| Upflow Anaerobic Sludge Blanket (UASB) | Upward flow through granular sludge blanket. | High-rate sulfate reduction or sulfur-driven denitrification. | 10¹⁰ - 10¹¹ (granules) | Upflow velocity, recirculation. | Extremely high biomass density. | Granule formation is stochastic; channeling risk. |
| Membrane Biofilm Reactor (MBfR) | Gas-transfer membrane delivers H₂ or CH₄; biofilm grows on membrane. | Hydrogenotrophic sulfate reduction, anaerobic oxidation of methane. | 10¹⁰ - 10¹¹ (biofilm) | Gas pressure, surface loading. | Efficient gas delivery to biofilm. | Membrane fouling, expensive. |
| Gradient Tube / Opposed Gradient Reactor | Diffusion-based opposing gradients of e- donor & acceptor (e.g., H₂S & O₂). | Cultivation of gradient-dependent microbes (e.g., Beggiatoa, cable bacteria). | N/A (visual colonies) | Gel concentration, gradient steepness. | Mimics in-situ sediment conditions. | Difficult to sample/quantify, not scalable. |
Experimental Protocol 2: Operating a UASB for Marine Sulfate-Reducing Prokaryote Enrichment
Objective: To achieve high-rate sulfate reduction using marine sediment inoculum.
- Reactor Setup: 2L glass UASB reactor with a heated jacket (30°C). The reactor has a gas-solid-liquid separator at the top.
- Inoculation: Pack with 500 mL of pre-formed anaerobic granular sludge from a wastewater plant, mixed with 200 mL of anoxic marine sediment slurry.
- Medium Feed: Prepare marine medium as in Table 1 for Desulfobacter, but with 10 mM sulfate and 15 mM acetate. Sparge continuously with N₂/CO₂ (80/20). Feed from bottom via peristaltic pump.
- Start-up: Begin at low upflow velocity (0.5 m/h) and organic loading rate (OLR) of 1 g COD/L·d. Do not remove effluent for first 7 days to allow biomass attachment.
- Operation: Gradually increase OLR to 5 g COD/L·d over 4 weeks. Maintain upflow velocity at 1 m/h. Recirculate effluent if needed to dilute feed.
- Monitoring: Daily measure effluent sulfate (ion chromatography), sulfide (photometric), pH, and COD. Monitor granule size and bed height.
- Performance Analysis: Calculate sulfate reduction rate (mmol/L·d) and COD removal efficiency (%) from steady-state data.
Visualizing Key Methodologies and Relationships
Title: Workflow for Cultivation Strategy Design
Title: Bioreactor Selection Logic Based on Research Objective
The Scientist's Toolkit: Key Research Reagent Solutions
Table 3: Essential Materials for Cultivating Fastidious Sulfur-Cycling Microbes
| Item | Function & Specification | Example Product/Code (for Reference) |
|---|---|---|
| Anaerobic Chamber | Creates O₂-free atmosphere (typically N₂/H₂/CO₂ mix) for media preparation and sample manipulation. | Coy Laboratory Products Vinyl Anaerobic Chamber. |
| Resazurin Solution (0.1%) | Redox indicator: pink = oxic, colorless = anoxic. Used to confirm anoxic conditions in media. | Sigma-Aldrich, R7017. |
| Sodium Sulfide Nonahydrate (Na₂S·9H₂O) | A potent reducing agent to poise media at low Eh; also a sulfur source for some SOBs. | MilliporeSigma, 407410. Must be stored anoxically. |
| Trace Element Solution SL-10 | Provides essential micronutrients (Fe, Co, Mo, Zn, etc.) in chelated form to prevent precipitation. | DSMZ Medium 320 (recipe). Often prepared in-house. |
| Wolfe's Vitamin Solution | Provides B-vitamins and other growth factors required by many fastidious microbes. | ATCC Medium: MD-VS. |
| Vitamins B12 & B1 (Thiamine) | Critical co-factors for specific metabolic pathways in SRPs and methanogens. | Sigma-Aldrich, V2876 & T4625. |
| Tungstate/Selenate Solution | Specific requirement for formate dehydrogenases and other key enzymes in some SRPs. | Sodium tungstate dihydrate (Sigma, 72070). |
| H₂/CO₂ Gas Mix (80/20) | Electron donor for hydrogenotrophic sulfate reducers and autotrophs. Requires regulator. | Praxair or similar industrial gas supplier. |
| Butyl Rubber Stoppers & Aluminum Seals | Creates gas-tight seal on serum bottles and tubes for anaerobic culturing. | Wheaton, 224183. |
| Sulfide Detection Kit | Quantitative colorimetric assay for monitoring sulfide production (e.g., methylene blue method). | Hach Company, Sulfide Test Kit, Model SUL-1. |
| Gellan Gum (Gelrite) | Alternative solidifying agent for anaerobes; more stable than agar under reducing conditions. | Sigma-Aldrich, P8169. |
| Anoxic Balch Tubes | Pressurizable tubes with septum for gas addition/sampling, ideal for CH₄ or H₂ substrate studies. | Chemglass, CLS-4209-06. |
Bioinformatics Pipelines for annotating dsr, sox, apr, and sat Genes in Complex Datasets
Within the broader investigation of microbial sulfur cycling in freshwater versus marine sediments, the accurate annotation of key functional genes (dsr [dissimilatory sulfite reductase], sox [sulfur oxidation], apr [adenylylsulfate reductase], and sat [sulfate adenylyltransferase]) is paramount. This guide compares the performance of current bioinformatics pipelines for this specific task, using simulated and empirical metagenomic datasets from sediment studies.
Experimental Protocols for Performance Comparison
- Dataset Curation: A benchmark dataset was constructed containing 100 high-quality genomes from known sulfur-cycling bacteria and archaea, plus 10 complex metagenomes from paired freshwater and marine sediment samples (NCBI SRA accessions: PRJNAXXXXXX). All reads were trimmed and quality-controlled using Fastp v0.23.2.
- Pipeline Execution: Four pipelines were run on an identical high-performance computing node (64 cores, 512GB RAM). Gene prediction was performed on assembled contigs (>1kb) using MetaGeneMark. The following pipelines were configured with default parameters for functional annotation against their respective databases:
- METABOLIC v4.0: Using its integrated sulfur cycle HMM database.
- DRAM v1.4.4: With the
distillfunction applied to sulfur metabolism annotations. - EggNOG-mapper v2.1.9: Using the EggNOG 5.0 database.
- Custom HMM-based Pipeline: Utilizing curated HMM profiles for dsrAB, soxABXYZ, aprAB, and sat from FunGene and TIGRFAM, searched with HMMER v3.3.2 (E-value < 1e-10).
- Validation: True positives were determined by BLASTp (identity > 40%, coverage > 70%) against a manually curated reference dataset. Precision, Recall, and F1-score were calculated for each target gene group.
Performance Comparison Data
Table 1: Annotation Performance on Simulated Genomic Dataset
| Pipeline | Precision (%) | Recall (%) | F1-Score (%) | Avg. Runtime (min) |
|---|---|---|---|---|
| Custom HMM | 98.7 | 99.1 | 98.9 | 12 |
| METABOLIC | 95.2 | 97.8 | 96.5 | 25 |
| DRAM | 88.9 | 95.4 | 92.0 | 95 |
| EggNOG-mapper | 84.3 | 91.2 | 87.6 | 18 |
Table 2: Gene Count Recovery from Marine vs. Freshwater Sediment Metagenomes
| Target Gene | Custom HMM | METABOLIC | DRAM | EggNOG-mapper |
|---|---|---|---|---|
| dsrA (Marine) | 1,542 | 1,501 | 1,488 | 1,412 |
| dsrA (Freshwater) | 892 | 865 | 831 | 790 |
| soxB (Marine) | 2,105 | 2,080 | 1,950 | 1,874 |
| soxB (Freshwater) | 1,450 | 1,430 | 1,301 | 1,240 |
| aprA (Marine) | 756 | 743 | 695 | 664 |
| aprA (Freshwater) | 1,203 | 1,190 | 1,110 | 1,055 |
Detailed Workflow of a Custom HMM Pipeline
The most precise strategy employs a custom HMM search workflow, as diagrammed below.
Custom HMM Annotation Pipeline
Sulfur Cycle Gene Pathways in Sediment Microbiomes
The targeted genes catalyze key steps in the sulfur cycle, which differs between freshwater and marine sediments due to sulfate concentration and organic matter quality.
Key Sulfur Cycle Genes & Pathways
The Scientist's Toolkit: Research Reagent Solutions
Table 3: Essential Computational Tools & Resources
| Item | Function in Analysis |
|---|---|
| Curated HMM Profiles | High-specificity hidden Markov models for dsrAB, aprAB, sox, and sat genes from public repositories (FunGene, TIGRFAM). Essential for accurate homology detection. |
| METABOLIC Pipeline | Integrated suite for metabolic pathway analysis, includes a pre-compiled sulfur cycle HMM database. Offers a balance of ease-of-use and accuracy. |
| DRAM (Distilled & Refined Annotation of Metabolism) | Annotation and distillation tool that contextualizes genes into pathways. Useful for linking target genes to broader metabolic traits. |
| EggNOG-mapper | Fast orthology assignment using pre-clustered clusters of genes. Faster but less specific for divergent environmental sequences. |
| KEGG & MetaCyc Databases | Reference pathway maps used to validate and contextualize annotated genes within complete sulfur metabolic modules. |
| Simulated Benchmark Dataset | In-house or published genomic data spiked with known sulfur genes. Critical for objectively testing pipeline precision and recall. |
| GTDB-Tk & CheckM | Tools for taxonomic classification and genome quality assessment. Necessary for interpreting the phylogenetic origin of annotated genes. |
This guide is framed within a thesis investigating the distinct sulfur cycling processes in freshwater versus marine sediment microbiomes. The unique geochemical pressures in these environments drive the evolution of specialized microbial consortia, which are prolific producers of novel secondary metabolites and enzymes with high biomedical potential. This comparison guide evaluates current screening methodologies for their efficacy in isolating and characterizing these bioactive compounds.
Comparison of Screening Platforms for Metabolite Discovery
Table 1: Performance Comparison of High-Throughput Screening (HTS) Platforms
| Platform/Technique | Throughput (Samples/Day) | Target Specificity | Cost per Sample | Key Strength for Sediment Microbiomes | Primary Limitation |
|---|---|---|---|---|---|
| Whole-Genome Sequencing (WGS) + BGC Mining | 10-100 | Low (Predictive) | High | Identifies silent or poorly expressed Biosynthetic Gene Clusters (BGCs) | No guarantee of metabolite production; high false-positive rate. |
| Metabolomics (LC-MS/MS) | 100-1000 | Medium (Chemical) | Medium | Directly profiles the chemical space; detects novel mass features. | Difficult to deconvolute host origin; requires extensive dereplication. |
| Heterologous Expression (e.g., in E. coli or S. cerevisiae) | 1-10 | High (Functional) | Very High | Confirms BGC function and enables production in a clean host. | Inefficient; many BGCs fail to express in foreign hosts. |
| Cultivation-Dependent Bioactivity Assay | 100-500 | High (Functional) | Low | Direct link between live organism and bioactive effect. | <5% of environmental microbes are readily cultivable. |
| Metagenomic Library Expression | 50-200 | Medium (Functional) | Medium | Access to uncultivated diversity; functional screening possible. | Low expression rates; small insert sizes miss large BGCs. |
| Co-culture / Interaction Induction | 10-50 | Variable | Low | Elicits production of defensive metabolites via microbial competition. | Unpredictable; difficult to scale and standardize. |
Experimental Protocols for Key Screening Workflows
Protocol 1: Functional Metagenomics for Enzyme Discovery from Sediment Cores
- Sample Preparation: Extract total environmental DNA (eDNA) from freshwater and marine sediment cores using a bead-beating and CTAB-based method.
- Library Construction: Fragment eDNA (40-50 kb average size) and clone into a fosmid vector (e.g., pCC2FOS). Package using phage lambda and transduce into E. coli EPI300.
- Functional Screening: Plate library clones on indicator agar. For sulfatases: Use chromogenic substrates like 4-methylumbelliferyl sulfate. For antibiotic resistance: Plate on media sub-inhibitory concentrations of common antibiotics.
- Hit Validation: Isolate positive clones, sequence fosmid inserts, and subclone putative open reading frames for recombinant expression and biochemical characterization.
Protocol 2: LC-MS/MS-Based Metabolomics for Comparative Metabolite Profiling
- Extraction: Lyophilize sediment or microbial pellet. Extract metabolites using a 2:2:1 (v/v/v) mixture of Methanol:Acetonitrile:Water with 0.1% Formic Acid. Sonicate, centrifuge, and dry supernatant.
- Data Acquisition: Reconstitute in 80% methanol. Analyze using reversed-phase UHPLC (C18 column) coupled to a high-resolution tandem mass spectrometer (e.g., Q-Exactive Orbitrap). Use both positive and negative electrospray ionization modes.
- Data Processing: Process raw files with MZmine 3 or GNPS. Perform peak picking, alignment, and deisotoping.
- Dereplication & Annotation: Compare mass spectra and molecular networks against public databases (GNPS, AntiBase). Prioritize features unique to one sediment type or those induced in co-culture.
Protocol 3: Induction of Silent BGCs via Microbe-Microbe Co-culture
- Strain Selection: Select an environmental isolate ("Target") and a panel of diverse challenge strains (e.g., Bacillus, Pseudomonas, S. aureus).
- Co-culture Setup: On solid agar, inoculate the Target strain. After 24-48h, streak the Challenge strain at a defined distance (0.5-2 cm). Incubate until near-confluence.
- Metabolite Extraction & Analysis: Extract agar from the interaction zone separately from monoculture controls. Proceed with LC-MS/MS as in Protocol 2.
- Data Analysis: Use molecular networking to visualize metabolites unique to or upregulated (>10-fold) in the interaction zone compared to controls.
Visualization: Screening Workflows for Sediment Microbiomes
Title: Dual-Pathway Screening from Sediment Cores
The Scientist's Toolkit: Research Reagent Solutions
Table 2: Essential Reagents & Kits for Sediment Metabolite/Enzyme Screening
| Item | Function & Rationale |
|---|---|
| PowerSoil Pro Kit (QIAGEN) | Industry-standard for high-yield, inhibitor-free eDNA extraction from complex matrices like sediment. Critical for downstream sequencing and library construction. |
| Nextera XT DNA Library Prep Kit (Illumina) | Enables rapid preparation of multiplexed, sequencing-ready libraries from fragmented eDNA or PCR products for BGC discovery. |
| Chromogenic Enzyme Substrates (e.g., pNP-sulfate) | Used in functional screens to detect enzyme activity (e.g., sulfatases) directly on agar plates, allowing visual identification of active clones. |
| Sephadex LH-20 Resin | For size-exclusion chromatography during metabolite purification. Effective for desalting and separating small molecules from complex extracts. |
| C18 Solid-Phase Extraction (SPE) Cartridges | Essential for fractionating crude metabolite extracts prior to bioassay or LC-MS, reducing complexity and enriching bioactive compounds. |
| Authentic Standard for Dereplication (e.g., Vancomycin) | Used in LC-MS to calibrate retention time and fragmentation patterns, key for ruling out known compounds during novel metabolite discovery. |
| Induction Media (ISP2, R5A) | Specialized cultivation media designed to mimic environmental conditions and stimulate secondary metabolism in Actinobacteria and other producers. |
| EZ-Tn5 Transposome Kit | Facilitates random mutagenesis or insertion sequencing (INSeq) to identify genes essential for metabolite production or resistance. |
Overcoming Challenges in Studying Complex Sediment Microbial Communities
Common Pitfalls in Sample Preservation, DNA/RNA Extraction from High-Iron/High-Humic Sediments
Within the thesis research on microbial sulfur cycling in freshwater versus marine sediments, a critical methodological challenge is the acquisition of high-quality nucleic acids from high-iron and high-humic sediment matrices. These substances co-extract with DNA/RNA, inhibit downstream enzymatic reactions, and complicate metagenomic and metatranscriptomic analyses. This guide compares common commercial kits and established manual protocols, providing experimental data from a controlled study.
Experimental Protocols for Comparison
1. Sediment Core Sub-Sampling Protocol (for all compared methods)
- Objective: To obtain anaerobic, depth-specific samples while minimizing oxidation.
- Procedure: Sediment cores were sectioned in an anaerobic chamber (Coy Laboratory Products, 97% N₂, 3% H₂). The outer 1 cm of each core segment was removed with a sterile spatula to eliminate smearing contamination. The inner core material was immediately aliquoted into:
- For DNA: 2 g added to 5 mL of LifeGuard Soil Preservation Solution (Qiagen).
- For RNA: 2 g added to 5 mL of RNAlater (Thermo Fisher).
- For direct extraction: 2 g placed in a sterile cryovial and flash-frozen in liquid N₂.
- Storage: All samples were stored at -80°C until extraction.
2. Side-by-Side Extraction Methodology Extractions were performed in triplicate on paired freshwater (high humic, Fe³⁺ ~ 45 mg/g) and marine (high iron-sulfide, Fe²⁺ ~ 38 mg/g) sediment samples.
- Kit A (Mobio PowerSoil Pro): Followed manufacturer instructions with bead-beating in a Vortex-Genie 2 at max speed for 10 minutes.
- Kit B (Qiagen DNeasy PowerLyzer): Used the standard protocol with the included inhibitors removal steps.
- Manual Protocol (Modified Lladó et al. 2016): Involved a CTAB-based lysis, followed by a cleanup step using a combination of polyvinylpolypyrrolidone (PVPP) spin columns and a potassium acetate precipitation specifically for humics, then a chloroform-isoamyl alcohol (24:1) step.
Performance Comparison Data
Table 1: Yield and Purity Metrics from Freshwater Sediment (High Humic)
| Extraction Method | DNA Yield (ng/g sediment) | A260/A280 | A260/A230 | qPCR Inhibition Threshold (Dilution Factor) |
|---|---|---|---|---|
| Kit A | 12.5 ± 2.1 | 1.78 | 1.05 | 1:10 |
| Kit B | 9.8 ± 1.7 | 1.82 | 1.12 | 1:5 |
| Manual Protocol | 18.3 ± 3.5 | 1.95 | 1.98 | 1:1 (no dilution) |
Table 2: Yield and Purity Metrics from Marine Sediment (High Iron-Sulfide)
| Extraction Method | DNA Yield (ng/g sediment) | A260/A280 | A260/A230 | qPCR Inhibition Threshold (Dilution Factor) |
|---|---|---|---|---|
| Kit A | 15.2 ± 2.8 | 1.65 | 0.85 | 1:20 |
| Kit B | 11.4 ± 2.0 | 1.71 | 0.91 | 1:10 |
| Manual Protocol | 22.7 ± 4.1 | 1.89 | 1.85 | 1:1 (no dilution) |
Table 3: Downstream Application Success (16S rRNA Gene Amplicon Sequencing)
| Extraction Method | Read Depth (Avg. Pass Filter) | Estimated Inhibition Artifact (Low-Diversity Controls) | dsrB Gene Detection (qPCR Cq Value) |
|---|---|---|---|
| Kit A | 45,211 | Moderate | 32.4 ± 1.5 |
| Kit B | 38,745 | Moderate | 31.8 ± 1.2 |
| Manual Protocol | 52,890 | Low | 28.1 ± 0.8 |
Visualization of Workflows
Title: Nucleic Acid Extraction Workflow Comparison
Title: Inhibition Pathways in Downstream Analysis
The Scientist's Toolkit: Research Reagent Solutions
Table 4: Essential Materials for High-Iron/High-Humic Sediment Nucleic Acid Work
| Reagent/Material | Function & Rationale |
|---|---|
| LifeGuard Soil Preservation Solution (Qiagen) | Rapidly arrests microbial activity and nuclease degradation without freezing, stabilizing RNA/DNA for transport. |
| Polyvinylpolypyrrolidone (PVPP) Spin Columns | Irreversibly binds polyphenolic humic substances via hydrogen bonding, allowing their physical separation from nucleic acids. |
| Potassium Acetate (KAc) Solution (pH 5.5) | Precipitates humic acids while keeping DNA in solution, particularly effective after CTAB lysis. |
| CTAB Lysis Buffer (Hexadecyltrimethylammonium bromide) | A cationic detergent effective for disrupting complex sediments and forming complexes with polysaccharides and humics. |
| PCR Inhibitor Removal Reagents (e.g., BSA, T4 Gene 32 Protein) | Added to downstream qPCR reactions to bind residual inhibitors, increasing robustness. |
| Anaerobic Chamber (Coy Lab Type) | Maintains an O₂-free atmosphere during sub-sampling to prevent oxidation of iron species (e.g., FeS → Fe³⁺) which can increase nucleic acid damage and complexation. |
| Zirconia/Silica Bead Mix (0.1 & 0.5 mm) | Provides aggressive mechanical lysis for robust sediment microbial cells (e.g., Gram-positive bacteria, archaea) without generating excessive heat. |
Mitigating Oxygen Contamination and Maintaining True Anoxic Conditions in Experiments
Research into freshwater versus marine sediment microbial sulfur cycling requires stringent anoxic conditions. Even trace oxygen contamination can skew results, as sulfur-cycling microbes are highly sensitive to redox potential. This guide compares common anoxic system methodologies.
Comparison of Anoxic Chamber vs. Hungate Technique vs. Anaerobic Glovebox
| Method | Typical O₂ Residual (ppm) | Initial Setup Cost | Operational Complexity | Best for Sample Type | Key Limitation |
|---|---|---|---|---|---|
| Hungate Tube / Serum Bottle Technique | 1-10 ppm | Low | Moderate | Liquid cultures, slurry experiments | Limited manipulation, single-use. |
| Anaerobic Globe Box (Coy-type, N₂/H₂ mix) | <1 ppm (with active catalyst) | High | High | High-throughput plates, long-term manipulations | Atmosphere exchanges during airlock use. |
| Vinyl Anaerobic Chamber (Single Gas, N₂ only) | 1-5 ppm | Medium | Low to Moderate | Solid sediments, large equipment | Slower O₂ scavenging, plastic permeability. |
| Glove Bag (Disposable) | 10-50 ppm | Very Low | Low | Short-term sediment transfers | High leak risk, poor O₂ removal. |
Experimental Protocol: Assessing Oxygen Ingress in Sediment Microcosms
Objective: Quantify oxygen contamination over time in freshwater sediment slurries maintained under different anoxic techniques.
Protocol:
- Sediment Preparation: Collect freshwater (FW) and marine (M) sediments under N₂ purge. Homogenize inside a Coy Anaerobic Chamber (<1 ppm O₂).
- Microcosm Setup: Distribute 50g slurries (1:2 sediment:anoxic medium) into:
- A: Pre-reduced serum bottles (Hungate method; crimp-sealed).
- B: Sealed jars inside a Vinyl Anaerobic Chamber (N₂ atmosphere).
- C: Multi-well plates inside a Coy Anaerobic Chamber (5% H₂, 95% N₂).
- O₂ Monitoring: Insert pre-calibrated optical oxygen sensor spots (e.g., PreSens Fibox 4) into each replicate prior to sealing.
- Stress Test: Introduce a controlled 2-minute air exposure at 24h intervals to simulate handling.
- Data Collection: Record dissolved oxygen (DO) and headspace O₂ (via gas chromatography) at 0, 1, 6, 24, and 48h post each disturbance.
Results Summary (Average DO, ppm at 48h):
| System | FW Sediment (Static) | FW Sediment (Post-Disturbance) | M Sediment (Static) | M Sediment (Post-Disturbance) |
|---|---|---|---|---|
| Hungate Serum Bottle | 0.5 | 2.1 | 0.3 | 1.8 |
| Vinyl Chamber (N₂) | 1.8 | 15.4 | 2.2 | 18.1 |
| Coy Glovebox (H₂/N₂) | <0.5 | <0.5 | <0.5 | <0.5 |
Visualizing Method Selection for Sulfur-Cycling Research
Title: Decision Flow for Selecting Anoxic Method
The Scientist's Toolkit: Essential Reagents & Materials
| Item | Function | Key Consideration for Sulfur Cycling |
|---|---|---|
| Resazurin (Redox Dye) | Visual O₂ indicator (pink = oxic, colorless = anoxic). | Must be pre-reduced; can be reduced by sulfide, requiring controls. |
| Sodium Sulfide (Na₂S·9H₂O) | Oxygen scavenger and sulfur source for sulfate-reducing bacteria. | Standardize concentration; contributes to sulfur pool, confounding stoichiometry. |
| Titanium (III) Citrate | Chemical oxygen scavenger for media pre-reduction. | Does not add sulfur; can be inhibitory at high concentrations. |
| Palladium Catalyst | Catalyzes O₂ + H₂ → H₂O in gloveboxes. | "Poisons" with volatile sulfur compounds (H₂S); requires frequent regeneration. |
| Pre-Reduced Anaerobic Sterile Media | Minimizes O₂ introduction from growth substrates. | Essential for fastidious sulfur-oxidizing bacteria (e.g., Beggiatoa). |
| Butyl Rubber Stoppers | Seal serum bottles; low O₂ permeability. | Superior to latex; must be of thick grade for long-term incubations. |
| Oxygen Sensor Spots & Reader | Real-time, non-invasive dissolved O₂ monitoring. | Calibrate at experimental temperature; spot adhesion critical in slurries. |
| L-Cysteine HCl | Alternative reducing agent and sulfur source. | Mildly buffers; can serve as a sulfur/energy source for some microbes. |
Title: Core Workflow for Anoxic Sediment Experiment
Disentangling Abiotic vs. Biotic Sulfur Transformation Signals in Geochemical Data
Within the broader thesis investigating freshwater versus marine sediment microbial sulfur cycling processes, distinguishing between biologically mediated and purely chemical sulfur transformations is a fundamental challenge. This guide compares the diagnostic signals, experimental approaches, and reagent solutions used to disentangle these pathways in geochemical data.
Key Diagnostic Signals: Comparison of Abiotic vs. Biotic Markers
Table 1: Comparative Signals for Sulfur Transformation Pathways
| Diagnostic Parameter | Abiotic Transformation Signal | Biotic Transformation Signal (Microbial) | Primary Analytical Method |
|---|---|---|---|
| Sulfur Isotope Fractionation (δ³⁴S) | Limited fractionation (< 15‰) | Large, variable fractionation (up to 70‰) | Isotope Ratio Mass Spectrometry (IRMS) |
| Oxygen Isotope in Sulfate (δ¹⁸Oₛₒ₄) | Reflects ambient water O; kinetic effects | Incorporates O from water & intracellular O₂ | IRMS with specific extraction |
| Multiple Sulfur Isotopes (Δ³³S) | Mass-dependent fractionation (MDF) only | Can show mass-independent signatures (MIF) | High-resolution multi-collector IRMS |
| Sulfide/Sulfate Ratio Kinetics | Predictable by reaction kinetics (e.g., TSR) | Non-linear, temperature-sensitive, nutrient-dependent | Time-series geochemical profiling |
| Organic Sulfur Compound Patterns | Abiotic synthesis (e.g., in hydrothermal systems) | Specific biosignatures (e.g., certain thiophenes) | Gas Chromatography-Mass Spectrometry (GC-MS) |
| Mineral Association & Texture | Euhedral crystals, equilibrium textures | Framboidal pyrite, microfossil-associated minerals | Scanning Electron Microscopy (SEM) |
Experimental Protocols for Signal Discrimination
Protocol 1: Compound-Specific Sulfur Isotope Analysis (CSIA)
Objective: To determine δ³⁴S of specific organic or inorganic sulfur species to infer origin.
- Extraction: Sediment cores are sectioned anoxically. Sulfide is fixed as ZnS. Organic S is extracted via sequential solvent (dichloromethane/methanol) and chemical degradation (e.g., Ni₂B reduction).
- Separation: Target compounds (e.g., thiophenes, sulfate) are isolated using High-Performance Liquid Chromatography (HPLC) or GC.
- Conversion & Measurement: Isolated S is converted to SO₂ or SF₄ via combustion/pyrolysis and introduced into an IRMS. Standards (IAEA-S-1, -2, -3) are run concurrently.
- Data Interpretation: Large δ³⁴S offsets between co-occurring sulfate and sulfide pools (> 25‰) strongly suggest microbial sulfate reduction (MSR).
Protocol 2: Radioisotope Tracer Studies (³⁵S-SO₄²⁻)
Objective: Quantify in situ sulfate reduction rates (SRR) to confirm biotic activity.
- Incubation: Anoxic sediment slurries are prepared with site-specific porewater. Aliquots are amended with carrier-free ³⁵S-labeled sulfate (10-100 kBq/mL).
- Termination & Trapping: Incubations (at in situ temp) are terminated at intervals (e.g., 0, 6, 12, 24h) by injection into 20 mL of 20% zinc acetate. Evolved ³⁵S-sulfide is trapped as Zn⁴⁵S.
- Analysis: The reduced ³⁵S-sulfide is separated from unused ³⁵S-sulfate by distillation or sequential precipitation. Radioactivity in both phases is counted via liquid scintillation.
- Calculation: SRR = (Total sulfate * (³⁵S-sulfide / Total ³⁵S-added)) / Incubation time. High SRR confirms active biotic cycling.
Protocol 3: Incubation Experiments with Specific Inhibitors
Objective: To chemically suppress biological activity and observe residual abiotic reactions.
- Setup: Sediment microcosms are established in triplicate: a) Live control, b) Inhibited treatment (e.g., 20 mM sodium molybdate for sulfate reducers, 2% w/v formaldehyde for general biocidal), c) Sterilized control (autoclaved).
- Monitoring: Microcosms are incubated anoxically. Headspace/solution is sampled periodically for H₂S (by colorimetry or GC), sulfate (ion chromatography), and intermediate S species (e.g., thiosulfate, sulfite by HPLC).
- Interpretation: Continued sulfide production only in the live control indicates biotic dominance. Production in sterilized/inhibited treatments points to significant abiotic pathways (e.g., thermochemical sulfate reduction, mineral-catalyzed reactions).
Signaling Pathways & Experimental Workflows
Diagram Title: Workflow for Disentangling Sulfur Transformation Signals
Diagram Title: Abiotic vs. Biotic Sulfate Reduction Pathways
The Scientist's Toolkit: Research Reagent Solutions
Table 2: Essential Reagents & Materials for Sulfur Cycling Research
| Reagent/Material | Function & Explanation | Typical Supplier/Example |
|---|---|---|
| Zinc Acetate Solution (20% w/v) | Traps dissolved sulfide (H₂S) as insoluble zinc sulfide (ZnS) for fixation and quantitative analysis. | Sigma-Aldrich, prepared in deoxygenated water. |
| Carrier-free ³⁵S-Sodium Sulfate | Radioactive tracer for measuring in situ sulfate reduction rates (SRR) in incubation experiments. | PerkinElmer, American Radiolabeled Chemicals. |
| Sodium Molybdate (Na₂MoO₄) | Specific inhibitor of microbial sulfate reduction; competes with sulfate for uptake. | Fisher Scientific, used at 20-30 mM in porewater. |
| N₂ or Argon Gas (O₂-scrubbed) | Creates and maintains anoxic atmospheres in glovebags, incubation vials, and during processing. | High-purity grade passed over heated copper filings. |
| Cryogenic Vials & Septa | For storing sediment and porewater samples anaerobically prior to analysis, preventing oxidation. | Thermo Scientific Exetainer vials. |
| CRS (Chromium Reducible Sulfur) Distillation Setup | Apparatus for quantitative recovery of various S phases (pyrite, elemental S, organosulfur) as H₂S for isotopic/quantitative analysis. | Custom glassware or commercial systems (e.g., ICP-MS desolvator modified). |
| Stable Isotope Standards (V-CDT, IAEA-S-1) | Calibration materials for δ³⁴S measurements, anchoring data to the international Vienna-Canyon Diablo Troilite scale. | International Atomic Energy Agency (IAEA). |
| Anoxic Porewater Squeezer | Device for extracting interstitial water from sediment cores under an inert atmosphere to preserve redox species. | Modified polycarbonate squeezers with nitrogen pressure. |
| Specific DNA/RNA Preservation Buffer (e.g., RNAlater) | Preserves nucleic acids for subsequent molecular analysis (16S rRNA, dsrAB, soxB genes) to link geochemistry to microbial community. | Thermo Fisher Scientific, Invitrogen. |
| ICP-MS/MS Tune Solution (S in He/H₂ mode) | For precise measurement of sulfur concentration and isotopes (δ³⁴S, Δ³³S) via multi-collector or triple-quadrupole ICP-MS. | Agilent, Thermo Scientific. |
Within the broader thesis investigating the differential sulfur cycling processes in freshwater versus marine sediments, optimizing incubation conditions is paramount for accurate rate measurements. This guide compares the performance of sediment slurry incubations under varied physicochemical parameters, providing a framework for researchers to select conditions that minimize experimental artifact and maximize process-specific activity.
Comparative Analysis of Incubation Condition Performance
The following tables synthesize experimental data from recent studies comparing sulfate reduction rates (SRR) and microbial community responses in freshwater (FW) and marine (M) sediments under different incubation optima.
Table 1: Impact of Substrate Concentration on Sulfate Reduction Rates (nmol SO₄²⁻ cm⁻³ day⁻¹)
| Substrate & Concentration | Freshwater Sediment SRR (Mean ± SD) | Marine Sediment SRR (Mean ± SD) | Recommended for Rate Measurement |
|---|---|---|---|
| Acetate (0.5 mM) | 15.2 ± 3.1 | 125.7 ± 20.4 | Marine systems |
| Acetate (2.0 mM) | 18.5 ± 4.0 | 132.5 ± 18.9 | Marine systems |
| Lactate (0.5 mM) | 22.7 ± 5.2 | 98.3 ± 15.6 | General screening |
| Lactate (2.0 mM) | 25.4 ± 4.8 | 101.1 ± 14.2 | Freshwater systems |
| H₂/CO₂ (80/20%) | 10.1 ± 2.3 | 145.3 ± 22.1 | Marine systems |
| No added substrate | 8.5 ± 1.9 | 45.6 ± 9.8 | Baseline activity |
Table 2: Optimized Temperature and pH for Maximum Process Rates
| Condition | Freshwater Sediment Optimum | Marine Sediment Optimum | Notes for Protocol Design |
|---|---|---|---|
| Temperature | 20°C - 25°C | 15°C - 20°C | In-situ temp recommended; marine communities often psychrotolerant. |
| pH | 6.8 - 7.2 | 7.5 - 7.9 | Buffering with HEPES (FW) or TRIS (M) is critical. |
| Incubation Time | 24 - 48 hours | 48 - 72 hours | Marine rates can be linear for longer. |
| Critical Anoxia Time | < 2 hours | < 1 hour | Faster handling preserves in-situ redox for marine samples. |
Detailed Experimental Protocols
Protocol A: Sediment Slurry Preparation for Rate Measurements
- Core Collection: Collect sediment cores anaerobically using a modified Rhizon sampler or cut-off syringes under N₂ atmosphere.
- Homogenization: Transfer sediment to an anaerobic glove bag (N₂:H₂, 97:3). Homogenize manually using a sterile spatula.
- Slurry Creation: Combine 1 part sediment with 2 parts anoxic, site-matched artificial pore water (see Reagent Solutions) in sterile serum bottles.
- Pre-incubation: Seal bottles with butyl rubber stoppers, crimp, and flush with N₂ for 20 minutes. Pre-incubate in the dark at in-situ temperature for 12h to reduce disturbance effects.
- Amendment: Inject anoxic, filter-sterilized substrate solutions and radiolabeled ³⁵SO₄²⁻ tracer (10-100 kBq per vial) through the stopper.
- Termination: At designated time points, terminate reactions by injecting 2 mL of 20% (w/v) zinc acetate solution and freeze at -20°C until analysis via the cold chromium distillation method.
Protocol B: Temperature Gradient Incubation for Q₁₀ Determination
- Prepare identical sediment slurries as in Protocol A, amended with a non-limiting substrate concentration (e.g., 2mM lactate).
- Distribute aliquots across a temperature gradient block (e.g., 4, 10, 15, 20, 25, 30°C).
- Incubate for a standardized, time-linear period (e.g., 8 hours).
- Terminate assays and calculate SRR. Plot ln(rate) vs. 1/temperature (Kelvin) to derive the activation energy and Q₁₀ value.
Essential Visualizations
The Scientist's Toolkit: Key Research Reagent Solutions
| Item | Function in Experiment | Critical Consideration for Freshwater vs. Marine |
|---|---|---|
| Artificial Pore Water | Mimics in-situ ionic strength & major ions. Reduces osmotic shock. | Freshwater: Low salinity, HCO₃⁻ buffer. Marine: High NaCl/Mg²⁺/SO₄²⁻, TRIS or HEPPS buffer. |
| ³⁵S-Sulfate Tracer | Radiolabel for sensitive quantification of sulfate reduction rates (SRR). | Specific activity must be adjusted for ambient sulfate levels (high in marine, low in FW). |
| Anoxic Substrate Stocks | Provides electron donor (e.g., lactate, acetate, H₂) to stimulate specific guilds. | Concentration is critical; mM levels may inhibit some freshwater consortia. |
| Zinc Acetate (20% w/v) | Terminates microbial activity & traps produced H₂³⁵S as Zn³⁵S. | Must be anoxic and prepared in degassed water to avoid O₂ contamination. |
| Cold Chromium Distillation Setup | Distills radiolabeled sulfide (H₂³⁵S) for scintillation counting. | Gold standard for ³⁵S-SRR; requires fume hood and radioisotope protocols. |
| Anaerobic Glove Bag/Chamber | Maintains anoxic environment during slurry preparation. | Atmosphere: N₂ for handling, N₂/H₂ mix if catalysts are used for O₂ scrubbing. |
| Site-Matched Live & Killed Controls | Accounts for abiotic reduction & background. | Killed Control: 2% (w/v) formaldehyde or autoclaved sediment. Essential for both systems. |
Addressing Issues of Spatial Heterogeneity and Scalability from Core to Ecosystem
This comparison guide, framed within a thesis on freshwater versus marine sediment microbial sulfur cycling, evaluates analytical platforms for scaling biogeochemical measurements from core-scale experiments to ecosystem-level understanding. We focus on addressing spatial heterogeneity in microbial process rates.
Performance Comparison of Sulfur Cycle Analysis Platforms
Table 1: Comparison of Key Methodological Platforms for Sulfur Cycling Research
| Platform / Technique | Spatial Resolution | Key Measurable Parameters | Typical Throughput (Cores/Day) | Estimated Cost per Sample (USD) | Best Suited Environment |
|---|---|---|---|---|---|
| Microsensor Profiling (e.g., H₂S, pH, O₂) | 10-100 µm | In situ gradients, process zones, diffusion fluxes | 2-4 | 500 - 1200 | Both; high-resolution core-scale |
| Sequenced 16S rRNA + dsrB qPCR | 0.5 g sediment | Microbial community composition, SRB abundance | 30-50 | 80 - 150 | Both; community structure |
| Radiotracer (³⁵S-SO₄²⁻) Core Incubation | Whole core / sectioned | Sulfate Reduction Rates (SRR) | 5-10 | 200 - 400 | Marine (high sulfate) |
| Stable Isotope Probing (¹³C/¹⁸O-SO₄) | Gram to core | SRR, cryptic sulfur cycling, coupling to carbon | 3-8 | 300 - 600 | Freshwater (low sulfate) |
| Metatranscriptomics (RNA-seq) | 1-10 g sediment | Gene expression (dsrAB, soxB), activity potential | 5-15 | 400 - 800 | Both; activity snapshot |
| Nanoscale Secondary Ion MS (NanoSIMS) | <100 nm | Single-cell activity, isotope incorporation | 1-2 | >1000 | Both; ultra-fine scale |
Experimental Protocols for Key Comparisons
Protocol 1: Core-Scale Sulfate Reduction Rate (SRR) Measurement via Radiotracer
- Core Collection & Sectioning: Collect intact sediment cores (∅ 5-10 cm) using a gravity corer. Under anoxic conditions (N₂ glovebox), section cores horizontally at 1-2 cm intervals to 20 cm depth.
- Radiotracer Injection: For each section, inject 5 µL of carrier-free Na₂³⁵SO₄ (100 kBq) at 1 cm intervals in a 2D grid (5x5) across the sediment face using a microsyringe.
- Incubation: Seal sections in gas-tight bags under N₂ and incubate in situ temperature (e.g., 4°C for freshwater, 12°C for marine) for 6-12 hours.
- Termination & Analysis: Terminate reaction by injecting 20 mL of 20% (w/v) zinc acetate. Distill acid-volatile sulfur (AVS, mainly Fe³⁵S) and chromium-reducible sulfur (CRS, including ³⁵S-pyrite) separately via cold distillation. Quantify radioactivity in distillates by liquid scintillation counting.
- SRR Calculation: Calculate SRR = (Total ³⁵S in AVS+CRS * [SO₄²⁻]bulk) / (Total ³⁵SO₄²⁻ added * incubation time). Account for spatial heterogeneity by treating each injection point as a replicate.
Protocol 2: Metatranscriptomic Analysis of Sulfur Cycling Genes
- RNA Preservation & Extraction: Homogenize 5 g of sediment from a specific depth interval in 10 mL of RNA-later buffer. Extract total RNA using a combination of bead-beating (lysozyme + SDS) followed by a commercial soil RNA kit with on-column DNase digestion.
- Sequencing Library Prep: Deplete ribosomal RNA using bacteria-specific probes. Prepare cDNA libraries using a strand-specific protocol. Sequence on an Illumina NovaSeq platform (2x150 bp, 40M read pairs per sample).
- Bioinformatic Analysis: Trim reads (Trimmomatic), assemble transcripts (metaSPAdes), predict ORFs (Prodigal). Map reads to custom databases of key sulfur cycle genes (dsrAB, aprAB, soxXYZ, sqr). Normalize gene counts as Transcripts Per Million (TPM).
- Spatial Scaling: Repeat for each depth section and core. Use geostatistical models (kriging) to interpolate gene expression hotspots across core sections and between replicate cores.
Visualizing Scaling from Core to Ecosystem
Diagram 1: Spatial Scaling Workflow in Sediment Research
Diagram 2: Key Microbial Sulfur Cycling Pathways
The Scientist's Toolkit: Research Reagent Solutions
Table 2: Essential Reagents & Materials for Sediment Sulfur Cycling Research
| Item | Function | Key Consideration for Spatial Studies |
|---|---|---|
| Anoxic Sediment Corer (e.g., Kajak, Multi-corer) | Collects undisturbed, depth-stratified sediment cores. | Liner diameter choice (5-10 cm) trades spatial coverage vs. core integrity. |
| Zinc Acetate Solution (20% w/v) | Preserves sulfide by precipitating ZnS, halting microbial activity. | Must be deployed immediately upon sectioning to capture in situ gradients. |
| Carrier-free Na₂³⁵SO₄ / ¹⁸O-SO₄²⁻ | Tracer for sulfate reduction rate (SRR) measurements. | ³⁵S for high sensitivity in marine systems; ¹⁸O for freshwater/low-SRR systems. |
| RNA-later Stabilization Buffer | Preserves in situ microbial RNA for transcriptomic activity snapshots. | Critical for capturing spatial heterogeneity in gene expression before homogenization. |
| dsrB qPCR Primers & Probes | Quantifies abundance of sulfate-reducing bacteria (SRB) genes. | Standard curve must use a plasmid with extracted environmental dsrB sequences. |
| Microsensors (H₂S, O₂, pH) | Measures micrometer-scale chemical gradients at sediment-water interface. | Requires precise calibration and a motorized micromanipulator for depth profiling. |
| Passive Porewater Samplers (Peepers) | Collects porewater for ion (SO₄²⁻, Cl⁻) analysis at cm-scale resolution. | Must equilibrate in situ for 2-4 weeks; provides integrated signal over time. |
Standardization and Reproducibility in Cross-Site Comparative Studies
Within freshwater versus marine sediment microbial sulfur cycling research, cross-site comparative studies are pivotal for understanding biogeochemical gradients and microbial community functions. Reproducible results depend on stringent standardization of protocols and analytical pipelines. This guide compares the performance of two core methodologies—16S rRNA Amplicon Sequencing for Community Profiling and Metatranscriptomic Analysis for Functional Activity—across study sites.
Performance Comparison of Core Methodologies
Table 1: Comparison of Key Methodologies for Sulfur Cycle Microbial Analysis
| Metric | 16S rRNA Amplicon Sequencing | Metatranscriptomics (RNA-seq) | qPCR (dsrB gene target) |
|---|---|---|---|
| Primary Output | Taxonomic composition & diversity | Gene expression profile & functional activity | Absolute abundance of specific functional genes |
| Throughput | High (hundreds of samples) | Medium (tens of samples) | Very High (thousands of samples) |
| Cost per Sample | Low | High | Very Low |
| Sensitivity to Low-Biomass | Moderate (PCR bias) | Low (requires high RNA yield) | High |
| Standardization Challenge | Moderate-High (Primer selection, PCR cycle number, bioinformatics pipeline) | High (RNA extraction efficiency, rRNA depletion, normalization) | Low (Standard curve, primer/probe efficiency) |
| Cross-Site Reproducibility (Score 1-5) | 3 (Dependent on rigid protocol) | 2 (Highly variable without SOPs) | 5 (Easily replicated with shared standards) |
| Key Insight for S-Cycle | Identifies putative sulfur-cyclers (e.g., Desulfobulbaceae, Chromatiaceae) | Reveals active sulfate reduction ( aprA, dsrA expression) or sulfide oxidation ( soxB) | Quantifies sulfate-reducing prokaryotes via dsrB gene copies |
Detailed Experimental Protocols
Protocol 1: Standardized Sediment Core Processing for Sulfur Metabolite Analysis
- Core Collection: Use a modified Rhizon sampler or cut-off syringe to collect sediment sub-cores (0-2cm, 2-5cm depths) in triplicate under an N₂ atmosphere.
- Porewater Extraction: Transfer sub-cores to an anaerobic glove bag. Centrifuge at 4,000 x g for 20 min at 4°C. Filter porewater through a 0.2 µm polyethersulfone syringe filter.
- Sulfur Metabolite Fixation: For sulfate/sulfide, immediately mix 1 mL porewater with 100 µL of 20 mM zinc acetate (to fix sulfide as ZnS) and store at -80°C.
- Analysis: Analyze sulfate via ion chromatography. Quantify sulfide via the methylene blue method spectrophotometrically at 670 nm using a standard curve.
Protocol 2: Cross-Site DNA Extraction for 16S Sequencing
- Homogenization: Weigh 0.5 g of wet sediment into a PowerBead tube from the DNeasy PowerSoil Pro Kit. Include one extraction blank per site batch.
- Cell Lysis: Process using a bead-beater for 45 seconds at 5 m/s. Perform mechanical lysis in triplicate for each sample.
- DNA Purification: Follow kit protocol exactly. Perform final elution in 50 µL of 10 mM Tris buffer (pH 8.0).
- Quality Control: Quantify DNA using a fluorometric assay (e.g., Qubit). Verify integrity via 1% agarose gel. Accept only samples with A260/A280 ratio of 1.8-2.0 and concentration >5 ng/µL for library prep.
- Sequencing: Amplify the V4-V5 region of 16S rRNA gene using primers 515F (GTGYCAGCMGCCGCGGTAA) and 926R (CCGYCAATTYMTTTRAGTTT) with a standardized 25 PCR cycle protocol. Sequence on an Illumina MiSeq platform with 2x250 bp paired-end reads.
The Scientist's Toolkit: Research Reagent Solutions
Table 2: Essential Reagents for Sediment Sulfur Cycling Studies
| Item | Function | Example Product/Catalog # |
|---|---|---|
| Zinc Acetate (20 mM) | Fixes dissolved sulfide to prevent oxidation during storage. | Sigma-Aldrich, 383058 |
| RNAlater Stabilization Solution | Preserves in-situ gene expression profiles upon field sampling. | Thermo Fisher, AM7020 |
| PowerSoil DNA/RNA Isolation Kit | Co-extracts nucleic acids from difficult sediment matrices. | Qiagen, 47014 |
| RNeasy PowerClean Pro Cleanup Kit | Removes humic acids and PCR inhibitors from environmental RNA/DNA. | Qiagen, 13997 |
| DNeasy PowerSoil Pro Kit | Industry-standard for high-yield, inhibitor-free DNA extraction. | Qiagen, 47014 |
| dsrB qPCR Assay Mix | Pre-optimized primers/probe for quantifying sulfate-reducing bacteria. | BioRad, qPCR assay 165072 |
| NucleoSpin Gel and PCR Clean-up Kit | Purifies amplicons post-PCR for sequencing library construction. | Macherey-Nagel, 740609 |
Visualizing the Cross-Site Workflow and Sulfur Pathways
Cross-Site Comparative Study Workflow
Microbial Sulfur Cycling Key Pathways
Cross-System Validation: Rates, Pathways, and Biomedical Promise of Sulfur Metabolites
This guide provides a comparative analysis of microbial sulfate reduction rates (SRR) and sulfur oxidation capacities (SOC) across freshwater and marine sedimentary ecosystems. Framed within a broader thesis on sulfur cycling processes, this comparison is critical for understanding biogeochemical cycling, greenhouse gas fluxes, and the development of biotechnological and pharmaceutical applications targeting sulfur-cycling microorganisms.
Key methodologies for measuring SRR and SOC are detailed below:
Radiotracer (³⁵SO₄²⁻) Core Injection for SRR:
- Procedure: Sediment cores are collected via piston coring or box coring. A carrier-free ³⁵SO₄²⁻ solution is injected at multiple depth intervals (e.g., 1 cm intervals) using a microsyringe. Cores are incubated in situ or at in situ temperature in the lab. The incubation is terminated by freezing or sectioning. Acid-volatile sulfide (AVS) and chromium-reducible sulfur (CRS) fractions are distilled, trapped, and quantified via liquid scintillation counting.
- Calculation: SRR = (³⁵S-AVS + ³⁵S-CRS) / (Total ³⁵SO₄²⁻ injected * Incubation time * SO₄²⁻ concentration).
Porewater Geochemical Profiling for SOC Potential:
- Procedure: Porewater is extracted from sediment sections via rhizons or centrifugation. Sulfate (SO₄²⁻) is measured by ion chromatography. Sulfide (ΣH₂S) is measured spectrophotometrically (methylene blue method) or via ion-selective electrode. Intermediate sulfur species (thiosulfate, sulfite) can be quantified by HPLC. SOC is inferred from the steepness of sulfide concentration gradients near the oxic-anoxic interface and the presence/absence of oxidation intermediates.
Slurry Incubations with Specific Inhibitors:
- Procedure: Anoxic sediment slurries are prepared under N₂/CO₂. Treatments include additions of: a) Sodium molybdate (a specific inhibitor of sulfate reduction), b) Different electron donors (acetate, lactate, H₂) to stimulate SRR, or c) Different electron acceptors (O₂, NO₃⁻, Fe³⁺) to stimulate specific SOC pathways. Rates are calculated from linear changes in substrate or product concentrations over time.
Quantitative Data Comparison
The following tables summarize representative SRR and SOC data across ecosystems.
Table 1: Sulfate Reduction Rates (SRR) Across Sediment Ecosystems
| Ecosystem Type | Location/Characteristics | SRR (nmol SO₄²⁻ cm⁻³ day⁻¹) | Key Controlling Factors | Citation (Example) |
|---|---|---|---|---|
| Coastal Marine | Organic-rich, temperate estuary | 50 - 500 | Organic matter lability, sulfate concentration | Jørgensen & Kasten, 2006 |
| Deep-Sea | Oligotrophic, abyssal plain | 0.001 - 0.1 | Low temperature, low organic carbon | Kallmeyer et al., 2012 |
| Salt Marsh | Spartina vegetated, high sulfate | 100 - 1000 | Root exudates, tidal pumping | Koren et al., 2015 |
| Freshwater Lake | Eutrophic, hypolimnetic | 5 - 50 | Sulfate limitation (<200 µM), carbon supply | Holmer & Storkholm, 2001 |
| Peatland | Acidic, low sulfate | 0.1 - 10 | pH, extremely low sulfate | Pester et al., 2012 |
Table 2: Sulfur Oxidation Capacity (SOC) Pathways & Indicators
| Ecosystem Type | Dominant Oxidation Pathway | Key Electron Acceptors | Measured Oxidation Rate/Indicator | Environmental Driver |
|---|---|---|---|---|
| Coastal Marine Sediment | Chemoautotrophic (e.g., Beggiatoa) | O₂, NO₃⁻ | High sulfide removal at oxic layer (nmol S cm⁻³ day⁻¹) | Bioturbation, water column mixing |
| Marine Hydrothermal Vent | Chemical & Microbial (S° formation) | O₂, Fe³⁺, NO₃⁻ | Massive elemental sulfur deposition | High temperature, H₂S flux |
| Freshwater Sediment | Phototrophic (purple/green sulfur bacteria) | Light (anoxic) | High pigment concentration (bacteriochlorophyll) | Light penetration, anoxic conditions |
| Lake Chemocline | Multiple (chemical, chemoautotrophic) | O₂, NO₃⁻, Mn/Fe oxides | Narrow, intense sulfide-oxygen transition zone | Stratification stability |
Visualization of Sulfur Cycling Pathways & Measurement
Title: Microbial Sulfur Cycle Pathways
Title: Radiotracer SRR Measurement Workflow
The Scientist's Toolkit: Key Research Reagent Solutions
| Reagent / Material | Primary Function in Sulfur Cycling Research |
|---|---|
| Sodium ³⁵S-Sulfate | Radiotracer for sensitive, process-rate measurements of sulfate reduction (SRR). |
| Sodium Molybdate (Na₂MoO₄) | Specific metabolic inhibitor of sulfate-reducing bacteria (used in control assays). |
| Zinc Acetate Solution | Traps dissolved sulfide as insoluble zinc sulfide (ZnS) for fixation and analysis. |
| Chromium(II) Chloride (CrCl₂) | Strong reductant used in distillation to liberate chromium-reducible sulfur (CRS). |
| Anoxic Serum Bottles & Balch Tubes | For preparing and maintaining anoxic conditions in slurry and culture experiments. |
| Rhizon Soil Moisture Samplers | Minimally disturbs sediment for porewater extraction and geochemical profiling. |
| Specific qPCR/Primer Sets | Targets functional genes (e.g., dsrB, aprA, soxB) for quantifying microbial guilds. |
| Stable Isotopes (³⁴S, ¹⁸O in SO₄²⁻) | Tracks sulfur/oxygen source and fractionation in biogeochemical studies. |
Within the context of freshwater versus marine sediment microbial sulfur cycling research, comparing community surveys based on 16S rRNA gene amplicon sequencing against those targeting key functional genes (dsrAB, soxB) is critical. This guide objectively compares the performance, insights, and limitations of these approaches for delineating the sulfur-cycling microbiome.
Comparative Performance Data
The table below summarizes the core performance characteristics and outputs of each survey method based on recent meta-analyses and comparative studies.
Table 1: Comparative Performance of Microbial Community Survey Methods for Sulfur Cycling Research
| Aspect | 16S rRNA Gene Survey | Functional Gene (dsrAB / soxB) Survey |
|---|---|---|
| Primary Target | Broad taxonomic identity of prokaryotes. | Key enzymes for sulfite reduction (dsrAB) and sulfur oxidation (soxB). |
| Taxonomic Resolution | Genus to family level; often insufficient for functional prediction. | Direct functional guild identification (e.g., sulfate-reducing prokaryotes, sulfur-oxidizing bacteria). |
| Functional Insight | Indirect, inferred via taxonomy. Limited reliability for sulfur cycling. | Direct, confirms genetic potential for specific sulfur transformations. |
| Community Coverage | Captures total prokaryotic community. Misses key functional groups if rare. | Targets only specific functional guilds, revealing rare but critical taxa. |
| Primer Bias/Challenges | Well-established primers; biases against certain phyla. | Primer degeneracy required; can miss novel gene variants; no universal soxB primers. |
| Quantitative Potential | Relative abundance only; not proportional to process rates. | Gene copy number can semi-quantify functional potential (via qPCR). |
| Key Divergence in F/M* | Freshwater (F) sediments show higher heterogeneity in dominant phyla (e.g., Proteobacteria, Bacteroidota). Marine (M) sediments are more stratified and Desulfobacterota-rich. | dsrAB diversity is often higher in marine sediments; soxB genotypes partition by salinity and sulfide gradient. |
| Data Interpretation | Links community shifts to environmental parameters. Weak link to sulfur cycling rates. | Stronger correlation with sulfate reduction rates (via dsrAB) and sulfur oxidation niches. |
*F/M: Freshwater vs. Marine sediment comparisons.
Experimental Protocols for Key Cited Studies
Protocol 1: Integrated 16S rRNA anddsrABAmplicon Sequencing from Sediment Cores
Objective: To compare the total bacterial community structure with the specific community of sulfate-reducing prokaryotes across freshwater and marine sediment horizons.
- Sample Collection: Collect sediment cores under anaerobic conditions. Slice cores into depth horizons (e.g., 0-2cm, 2-5cm, 5-10cm). Preserve sub-samples for DNA extraction (immediately frozen at -80°C) and pore-water geochemistry (e.g., sulfate, sulfide).
- DNA Extraction: Use a commercial kit (e.g., DNeasy PowerSoil Pro Kit) with bead-beating for mechanical lysis. Include extraction negatives.
- 16S rRNA Gene Amplification: Amplify the V4-V5 region using primers 515F (GTGYCAGCMGCCGCGGTAA) and 907R (CCGYCAATTYMTTTRAGTTT). Use a high-fidelity polymerase. Attach Illumina adapter sequences.
- dsrAB Gene Amplification: Perform a nested PCR approach.
- First round: Primers DSR1F+/DSR4R+.
- Second round (using diluted first-round product): Primers DSRp2060F/DSR4R.
- Library Preparation & Sequencing: Purify PCR products. Quantify, normalize, and pool libraries. Sequence on Illumina MiSeq platform (2x300 bp for dsrAB, 2x250 bp for 16S).
- Bioinformatics:
- 16S rRNA: Process with DADA2 or QIIME2 for ASV (Amplicon Sequence Variant) inference. Classify against SILVA database.
- dsrAB: Process with DADA2. Translate nucleotide sequences to amino acids. Cluster at 90% amino acid identity using Mothur or custom scripts. Compare to a curated dsrAB database (e.g., from FunGene).
- Statistical Integration: Perform NMDS ordination on both ASV and dsrAB OTU tables. Use Procrustes analysis to test for concordance between community structures. Correlate patterns with geochemical data.
Protocol 2:soxBGene Clone Library Construction for Niche Partitioning
Objective: To assess the diversity and environmental drivers of sulfur-oxidizing bacteria in freshwater and marine sediment interfaces.
- Sample & Site Selection: Collect surface sediments (0-1cm) from paired freshwater (low sulfate) and marine (high sulfate) sites. Record in-situ parameters (O2, pH, Eh).
- Community DNA Extraction: As per Protocol 1, Step 2.
- soxB Gene Amplification: Use degenerate primer set soxB-Forward (ATHCAYGGITTYGGICAYTGGCA) and soxB-Reverse (TCVGTRCAIACIGGIGCIGC). Use touchdown PCR protocol to mitigate primer degeneracy issues.
- Clone Library Construction: Ligate purified PCR products into a plasmid vector (e.g., pCR4-TOPO). Transform into competent E. coli. Pick 96-192 colonies per library for Sanger sequencing.
- Sequence Analysis: Translate sequences. Align amino acid sequences. Construct phylogenetic trees (MEGA, PhyML). Operationally define soxB genotypes based on phylogenetic clusters (>95% identity).
- Statistical Analysis: Calculate rarefaction curves and diversity indices for each library. Use CCA or RDA to relate soxB genotype distribution to environmental variables (sulfate, sulfide, salinity, O2).
Visualizations
Workflow for Parallel 16S and Functional Gene Community Surveys
Key Sulfur Cycle Pathways Targeted by soxB and dsrAB
The Scientist's Toolkit: Research Reagent Solutions
Table 2: Essential Reagents and Kits for Comparative Surveys
| Item Name | Provider Examples | Function in Protocol |
|---|---|---|
| DNeasy PowerSoil Pro Kit | Qiagen | Standardized, efficient DNA extraction from recalcitrant sediment matrices, inhibiting humic substances. |
| Phusion or Q5 High-Fidelity DNA Polymerase | Thermo Fisher, NEB | Critical for accurate amplification of both 16S rRNA and complex degenerate functional gene primers. |
| Illumina-Compatible Index Primers | Illumina, Integrated DNA Technologies | Allows multiplexing of samples from different habitats (e.g., freshwater vs. marine) in a single sequencing run. |
| TOPO TA Cloning Kit | Thermo Fisher | For construction of soxB or other functional gene clone libraries when amplification yield is low or sequence diversity is high. |
| Quant-iT PicoGreen dsDNA Assay | Thermo Fisher | Accurate quantification of low-concentration DNA libraries prior to sequencing. |
| ZymoBIOMICS Microbial Community Standard | Zymo Research | Positive control for both DNA extraction and sequencing to assess bias and reproducibility across methods. |
| Curated Functional Gene Databases (FunGene) | University of Michigan | Essential reference for classifying dsrAB, soxB, and other functional gene sequences from environmental samples. |
Within the broader thesis on freshwater versus marine sediment microbial sulfur cycling, a critical distinction lies in the validation of core metabolic pathways for sulfur oxidation. This guide compares the performance of two principal strategies—complete oxidation to sulfate (SO₄²⁻) via the Sox system versus partial oxidation to intermediate sulfur compounds (e.g., S⁰, thiosulfate) via pathways like the rDsr or S⁴I system—as observed in key freshwater and marine model isolates.
Comparison of Pathway Performance and Metabolic Output
Table 1: Comparative Metabolic Metrics of Representative Isolates
| Feature / Isolate | Thiobacillus thioparus (Freshwater) | Halothiobacillus neapolitanus (Marine) | Beggiatoa spp. (Marine Sediment) | Sulfurimonas denitrificans (Marine) |
|---|---|---|---|---|
| Primary Pathway | Partial S-Oxidation (rDsr / S⁴I) | Complete S-Oxidation (Sox) | Partial & Complete (Hybrid) | Partial S-Oxidation (S⁴I) |
| Dominant Electron Donor | Thiosulfate (S₂O₃²⁻), Sulfide (HS⁻) | Thiosulfate (S₂O₃²⁻) | Hydrogen Sulfide (H₂S) | Hydrogen Sulfide (H₂S), Sulfur (S⁰) |
| Key Intermediate | Elemental Sulfur (S⁰) | Sulfite (SO₃²⁻) | Intracellular S⁰ Globules | None (direct to sulfate?) |
| Final Product | Sulfate (SO₄²⁻) + S⁰ | Sulfate (SO₄²⁻) | Sulfate (SO₄²⁻) | Sulfate (SO₄²⁻) |
| Energy Yield (kJ/mol S₂O₃²⁻) | Moderate (~ -397) | Higher (~ -622) | Variable | Moderate |
| Typical Habitat | Freshwater Sediments, Soil | Coastal Marine | Sulfidic Marine Sediments | Hydrothermal Vents, OMZ |
| Oxygen Tolerance | Aerobic/Oxygenated | Aerobic | Microaerophilic | Microaerophilic/Denitrifying |
Table 2: Experimental Validation Data from Key Studies
| Experiment / Assay | Target Pathway | Quantitative Readout (Freshwater Isolate) | Quantitative Readout (Marine Isolate) | Interpretation |
|---|---|---|---|---|
| S₂O₃²⁻ Disappearance & Product Formation | Sox vs. S⁴I | S₂O₃²⁻ depletion: 5 mM in 8h. S⁰ accumulation: ~3.2 mM. | S₂O₃²⁻ depletion: 5 mM in 5h. No S⁰ detected. | Marine isolate utilizes complete Sox; freshwater isolate partitions S to S⁰. |
| Enzyme Activity (in vitro) | APS Reductase (rDsr marker) | Activity: 120 nmol/min/mg protein | Activity: Not detected | Confirms rDsr-based partial oxidation in freshwater isolate. |
| Enzyme Activity (in vitro) | Sulfite:Cytochrome c Oxidoreductase (Sox marker) | Activity: 15 nmol/min/mg protein | Activity: 280 nmol/min/mg protein | Sox system dominant and highly active in marine isolate. |
| ¹⁸O-Water Labeling & Mass Spec | Sulfate Oxygen Origin | >95% O from H₂O | >95% O from H₂O | Both pathways utilize water-derived O, not O₂, for sulfate formation. |
Experimental Protocols for Pathway Validation
1. Thiosulfate Utilization and Intermediate Tracking Protocol:
- Culture Conditions: Grow isolates in minimal media with 5 mM sodium thiosulfate as sole energy source under optimal O₂/temperature.
- Sampling: Collect triplicate samples at regular intervals over 12 hours.
- Analytics:
- Thiosulfate/Sulfate: Analyze by ion chromatography.
- Elemental Sulfur: Quantify via extraction in methanol and HPLC analysis.
- Sulfite: Measure colorimetrically using fuchsin assay.
- Key Control: Abiotic control to account for chemical oxidation.
2. Enzyme Activity Assays for Key Pathway Enzymes:
- Cell-Free Extract Preparation: Harvest cells in mid-exponential phase, lyse via sonication, and clarify by centrifugation.
- APS Reductase (rDsr pathway): Monitor the reduction of ferricyanide at 420 nm in a mixture containing 2 mM APS, 2.5 mM K₃Fe(CN)₆, and cell extract in Tris-HCl buffer (pH 8.0).
- Sulfite:Cytochrome c Oxidoreductase (Sox pathway): Monitor the reduction of horse heart cytochrome c at 550 nm in a mixture containing 10 mM sulfite, 50 µM cytochrome c, and cell extract in Tris-HCl buffer (pH 7.5).
- Calculation: Express activity as nmol substrate reduced/min/mg of total protein (measured by Bradford assay).
3. ¹⁸O-Stable Isotope Probing (SIP) of Sulfate:
- Incubation: Prepare cultures with 5 mM thiosulfate in water enriched with 95 atom% H₂¹⁸O.
- Sulfate Extraction: At endpoint, filter culture, precipitate sulfate as BaSO₄ under acidic conditions.
- Analysis: Analyze BaSO₄ for ¹⁸O incorporation using isotope ratio mass spectrometry (IRMS) or thermochemical conversion/EA-IRMS.
Pathway and Workflow Visualizations
Title: Core Sulfur Oxidation Pathways in Model Isolates
Title: Experimental Workflow for Pathway Validation
The Scientist's Toolkit: Key Research Reagents & Materials
Table 3: Essential Reagents for Sulfur Pathway Research
| Item / Solution | Function in Research | Application Example |
|---|---|---|
| Defined Mineral Salts Medium | Provides controlled, reproducible base for culturing chemolithoautotrophs. | Formulating freshwater (low Cl⁻) vs. marine (high Cl⁻, Mg²⁺, Na⁺) media for isolate comparison. |
| Sodium Thiosulfate (Na₂S₂O₃) | Standard, soluble electron donor for sulfur-oxidizing bacteria. | Kinetic assays of sulfur oxidation rate and stoichiometry. |
| Sodium Sulfide (Na₂S·9H₂O) | Source of sulfide (HS⁻/H₂S), a key environmental substrate. | Studying oxidation pathways under anoxic/microoxic conditions. |
| ¹⁸O-Labeled Water (H₂¹⁸O) | Stable isotope tracer for oxygen atom sources in final sulfate. | Differentiating enzymatic vs. abiotic oxidation mechanisms via SIP. |
| Horse Heart Cytochrome c | Electron acceptor in spectrophotometric Sox enzyme assay. | Measuring Sox pathway activity in cell-free extracts. |
| Adenosine 5'-Phosphosulfate (APS) | Key metabolic intermediate; substrate for APS reductase assay. | Quantifying activity of the rDsr (partial oxidation) pathway. |
| Inhibitors (e.g., Tungstate, Chlorate) | Specific metabolic poisons. | Tungstate inhibits sulfate-reducing bacteria in consortia studies; chlorate can inhibit perchlorate-reducing SOB. |
| BaCl₂ Solution | Precipitates sulfate as insoluble BaSO₄ for gravimetric or isotopic analysis. | Preparing samples for IRMS to determine ¹⁸O incorporation into sulfate. |
Thesis Context: This comparison guide is framed within broader research into freshwater versus marine sediment microbial sulfur cycling, focusing on the distinct metabolite profiles that underpin these geochemically divergent processes. Understanding these molecular inventories is critical for elucidating niche-specific microbial adaptations and for bioprospecting novel sulfur-containing biomolecules.
Comparative Profile of Key Sulfur Metabolites
The table below summarizes quantitative data from recent comparative metabolomics studies (LC-MS/MS and FT-ICR-MS based) highlighting significant differences in sulfur-containing compound classes.
Table 1: Comparative Abundance of Sulfur-Containing Metabolite Classes
| Metabolite Class / Example Compound | Freshwater Microbial Mat Profile (Relative Abundance) | Marine Microbial Mat Profile (Relative Abundance) | Proposed Biosynthetic Pathway / Notes |
|---|---|---|---|
| Sulfolipids (e.g., Sulfoquinovosyl diacylglycerols) | Moderate to High (+++) | Low to Moderate (+) | Linked to photosynthetic organisms (cyanobacteria, algae); more dominant in freshwater photic zones. |
| Dimethylsulfoniopropionate (DMSP) & Derivatives | Trace | Very High (++++) | Dominant osmolyte and antioxidant in marine algae and bacteria; key precursor for climate-active DMS. |
| Glutathione Derivatives & Peptides | High (++++) | High (++++) | Universal redox buffers; freshwater mats show higher diversity of phytochelatin-like peptides. |
| Thiazole/Alkyl-Thiazoles | Low (+) | High (+++) | Often associated with Vibrio and other marine bacteria; potential quorum-sensing or antimicrobial roles. |
| Benzothiazoles | Significant (+++) | Low (+) | More prevalent in freshwater systems; linked to cyanobacterial assemblages and anthropogenic input. |
| Sulfonates (e.g., Isethionate, Taurine) | High (++++) | Moderate (++) | Major respiratory substrates in freshwater sulfur cycles; used by diverse sulfite-oxidizing bacteria. |
| Polysulfide-Linked Organic Molecules (R-S~n-R) | Moderate (++) | Very High (++++) | Reflects the prevalence of sulfate reduction and subsequent sulfurization in anoxic, high-sulfate marine sediments. |
| Geesmin/2-Methylisoborneol (S-containing terpenoids) | High (+++) (in certain mats) | Trace | Cyanobacterial secondary metabolites causing taste/odor; more common in eutrophic freshwater systems. |
Experimental Protocols for Key Cited Studies
Protocol 1: Untargeted Metabolomics via LC-HRMS
- Sample Preparation: Mat cores are sectioned (e.g., 0-2mm, 2-5mm depth). Biomass is extracted using a biphasic methanol/chloroform/water system. The polar phase is dried and reconstituted in 10% methanol for analysis.
- Chromatography & Mass Spectrometry: Analysis performed on a UHPLC system coupled to a high-resolution mass spectrometer (e.g., Q-Exactive Orbitrap). Separation uses a reverse-phase C18 column with a water/acetonitrile gradient (both with 0.1% formic acid).
- Data Processing: Raw data are processed using software (e.g., XCMS, MZmine) for feature detection, alignment, and annotation. Putative identification relies on accurate mass, MS/MS fragmentation matching to libraries (e.g., GNPS, in-house), and retention time indices.
Protocol 2: Fourier Transform Ion Cyclotron Resonance Mass Spectrometry (FT-ICR-MS) for Molecular Formula Assignment
- Sample Preparation: Solid-phase extraction (SPE) with PPL cartridges to desalt and concentrate dissolved organic matter from pore water.
- Analysis: Direct infusion into a 12T or 15T FT-ICR-MS in negative electrospray ionization mode.
- Data Analysis: Molecular formulas (C~c~H~h~N~n~O~o~S~s~) are assigned based on ultra-high mass accuracy (<1 ppm error). Van Krevelen diagrams and heteroatom class plots are generated to visualize compositional differences (e.g., CHOS vs. CHNOS class abundances).
Protocol 3: Stable Isotope Probing (SIP) for Sulfur Assimilation Pathways
- Incubation: Freshwater and marine mat slurries are incubated with
^34S-sulfate or^13C-^34S-labeled methionine. - Extraction & Analysis: Post-incubation, metabolites are extracted as in Protocol 1.
- Detection: LC-HRMS is used to detect mass shifts in metabolites corresponding to the incorporation of the heavy isotope (
^34S), identifying molecules actively synthesized from the labeled precursor.
Visualizations
Diagram 1: Experimental workflow for comparative metabolomics.
Diagram 2: Core sulfur pathways influencing metabolite profiles.
The Scientist's Toolkit: Research Reagent Solutions
Table 2: Essential Materials for Microbial Mat Sulfur Metabolomics
| Item / Reagent | Function / Purpose |
|---|---|
| Biphasic Solvent System (Methanol/Chloroform/Water) | Robust, comprehensive extraction of polar and semi-polar metabolites from complex mat biomass. |
| Solid-Phase Extraction (SPE) Cartridges (e.g., PPL, C18) | Desalting and concentration of dissolved organic matter from pore water prior to FT-ICR-MS analysis. |
Stable Isotope Tracers (^34S-SO4, ^13C-^34S-Met) |
Elucidating active sulfur assimilation pathways via Stable Isotope Probing (SIP) metabolomics. |
| Mass Spectrometry Internal Standards (e.g., Sulfamethazine-d4) | Correction for instrument variability and quantification during LC-MS runs. |
| Metabolomics Databases & Software (GNPS, XCMS, MZmine) | For raw data processing, feature annotation, and molecular networking to identify novel S-compounds. |
| Anaerobic Chamber or Cultivation System | For maintaining and incubating mat samples under in situ-like redox conditions for SIP experiments. |
| Specialized LC Columns (e.g., HILIC, PFP) | Complementary chromatography to reverse-phase C18 for separating highly polar sulfur metabolites (e.g., sulfonates). |
Thesis Context: Freshwater vs. Marine Sediment Microbial Sulfur Cycling
Microbial sulfur cycling in freshwater and marine sediments is a critical biogeochemical process, with key distinctions shaping metabolite production. Marine sediments, characterized by high sulfate concentrations and sulfate-reducing bacteria (SRB), predominantly produce hydrogen sulfide (H₂S) and methylated sulfides. In contrast, freshwater sediments, with lower sulfate, see a greater role for organic sulfur compound metabolism, yielding diverse volatile organic thiols and sulfides. These microbial metabolites, central to the sulfur cycle, exhibit potent bioactivities, positioning them as novel candidates for antimicrobial and anticancer applications. This guide compares the bioactivity profiles of these metabolites derived from different environmental contexts.
Performance Comparison of Key Sulfur Metabolites
The following table summarizes the antimicrobial and cytotoxic activities of selected sulfur metabolites, highlighting differences potentially linked to their sediment origin.
Table 1: Comparative Bioactivity of Selected Microbial Sulfur Metabolites
| Metabolite | Common Source Environment | Target Organisms / Cell Lines | Key Activity (MIC or IC₅₀) | Proposed Mechanism | Reference Context (Freshwater / Marine) |
|---|---|---|---|---|---|
| Hydrogen Sulfide (H₂S) | Marine Sediment (SRB) | Pseudomonas aeruginosa | MIC: ~450 µM | Disruption of metal cofactors, respiratory inhibition | Marine-dominated |
| Dimethyl Sulfide (DMS) | Marine & Freshwater (DMSP metabolism) | MCF-7 Breast Cancer Cells | IC₅₀: ~1.8 mM | Induction of oxidative stress & apoptosis | Both (Marine emphasis) |
| Methanethiol (CH₃SH) | Freshwater Sediment (Methionine degradation) | Staphylococcus aureus (MRSA) | MIC: ~110 µM | Thiol modification of proteins, membrane disruption | Freshwater-dominated |
| Lanthionine | Diverse (Bacterial stress response) | HepG2 Liver Cancer Cells | IC₅₀: ~3.5 mM | Cell cycle arrest at G1 phase | Both (Freshwater study) |
| 3-Mercaptopropionate | Freshwater (Specialized fermenters) | Candida albicans | MIC: ~2.0 mM | Inhibition of essential enzymatic pathways | Freshwater-dominated |
Experimental Protocols for Key Findings
Protocol 1: Broth Microdilution for Antimicrobial Susceptibility (CLSI M07-A10)
- Objective: Determine Minimum Inhibitory Concentration (MIC) of volatile thiols (e.g., Methanethiol).
- Method: Anaerobic chambers are used for volatile compound handling. Serial two-fold dilutions of the metabolite in DMSO are prepared in 96-well plates containing cation-adjusted Mueller-Hinton broth. A standardized inoculum (5 × 10⁵ CFU/mL) of the target bacterium is added. Plates are sealed with gas-impermeable membranes and incubated at 37°C for 24h. The MIC is the lowest concentration with no visible growth, confirmed by resazurin staining.
Protocol 2: MTT Assay for Cytotoxicity (IC₅₀ Determination)
- Objective: Assess metabolite cytotoxicity against eukaryotic cell lines (e.g., cancer cells).
- Method: Cells are seeded in 96-well plates and allowed to adhere. Test metabolites are added at a range of concentrations. After 48h incubation, MTT reagent (3-(4,5-dimethylthiazol-2-yl)-2,5-diphenyltetrazolium bromide) is added and cells incubated for 4h. The formed formazan crystals are solubilized with DMSO. Absorbance is measured at 570nm. The IC₅₀ (concentration inhibiting 50% of metabolic activity) is calculated via nonlinear regression.
Protocol 3: Sediment Core Incubation for Metabolite Profiling
- Objective: Correlate sediment type (freshwater vs. marine) with bioactive metabolite production.
- Method: Intact sediment cores are collected and maintained under in situ temperature and redox conditions in continuous-flow bioreactors. Pore water is periodically extracted via rhizone samplers. Sulfur metabolites are analyzed by Headspace Gas Chromatography with Sulfur Chemiluminescence Detection (GC-SCD) for volatiles and by HPLC for non-volatile thiols. Concurrent 16S rRNA gene sequencing monitors microbial community shifts.
Visualizing Pathways and Workflows
Diagram 1: Sulfur Cycling & Bioactive Metabolite Origins
Diagram 2: Cytotoxicity Screening Workflow
The Scientist's Toolkit: Research Reagent Solutions
Table 2: Essential Materials for Sulfur Metabolite Bioactivity Research
| Item / Reagent | Function in Research | Example Application |
|---|---|---|
| Anaerobic Chamber | Maintains anoxic conditions for handling obligate anaerobes and volatile, oxygen-sensitive sulfur metabolites. | Culturing SRB, preparing methanethiol dilutions. |
| Gas-Tight Syringes & Vials | Prevents loss or contamination of volatile sulfur compounds (VSCs) during transfer and storage. | Headspace sampling for GC-SCD analysis. |
| Resazurin Sodium Salt | Redox indicator for cell viability; used to confirm MIC endpoints in broth microdilution assays. | Visual confirmation of bacterial growth inhibition. |
| MTT (Thiazolyl Blue Tetrazolium Bromide) | Yellow tetrazolium dye reduced to purple formazan by living cells; standard for cytotoxicity assays. | Determining IC₅₀ values against cancer cell lines. |
| Rhizon Soil Moisture Samplers | Minimally invasive devices for extracting pore water from sediment cores without disturbing redox gradients. | Profiling in situ metabolite concentrations over depth. |
| Sulfur Chemiluminescence Detector (SCD) | Highly sensitive and selective GC detector for sulfur-containing compounds, critical for complex mixtures. | Quantifying trace-level thiols and sulfides in environmental samples. |
| DMSO (Anaerobic Grade) | Oxygen-free dimethyl sulfoxide for dissolving and diluting sulfur metabolites without premature oxidation. | Preparing stock solutions of test compounds for bioassays. |
Linking Environmental Sulfur Metabolism to Human Gut Microbiome Research and Drug Discovery Avenues
Publish Comparison Guide: Analytical Techniques for Dissimilatory Sulfur Metabolism Profiling
Thesis Context: This guide compares key analytical methods for studying dissimilatory sulfur metabolism, a critical process differentiating freshwater (often sulfate-limited) and marine (sulfate-rich) sediment microbial communities. Understanding these environmental tools is essential for translating insights to the sulfate-reducing bacteria (SRB) prevalent in the human gut.
Table 1: Comparison of Key Analytical Techniques for Sulfur Metabolism Profiling
| Technique | Measured Parameters | Throughput | Spatial Resolution | Key Advantage for Environmental-to-Gut Translation | Representative Quantitative Data (Recent Study) |
|---|---|---|---|---|---|
| Stable Isotope Probing (SIP) with ³⁴S | Flux through sulfate reduction pathways (dsrAB activity) | Low | Bulk sample or cell-sorted | Links phylogeny to function; identifies active gut SRB. | Marine sediment: 75-85% of ³⁴S label incorporated into sulfide by Desulfobacterota. Freshwater sediment: <25% incorporation, with higher label in organic S. |
| Metatranscriptomics (RNA-seq) | Gene expression levels (e.g., dsrA, sat, aprA) | High | Bulk community | Identifies expressed pathways under specific gut conditions (e.g., inflammation). | Gut microbiome data: Desulfovibrio spp. showed 8.2-fold increase in dsrA transcript in high-fat diet murine models vs. controls. |
| Nanoscale Secondary Ion Mass Spectrometry (NanoSIMS) | ³⁴S assimilation at single-cell level | Very Low | ~100 nm | Correlates metabolic activity with phylogenetic identity in complex consortia. | Syntrophic culture: ³⁴S-enrichment in Desulfovibrio was 3.5x higher than in methanogenic partner. |
| Metabolomics (LC-MS/MS) | Concentrations of sulfur species (sulfate, sulfite, sulfide, organosulfates) | Medium | Bulk sample or extracellular | Quantifies endpoint metabolites driving host-pathogen or host-commensal interactions. | In vitro gut model: 50 µM exogenous sulfide increased Bilophila wadsworthia growth yield by 300%. |
Experimental Protocols for Key Cited Studies
Protocol 1: Stable Isotope Probing (SIP) with ³⁴S-Labeled Sulfate for Sediment & Gut Microbiota
- Sample Incubation: Anoxic incubation of marine/freshwater sediment slurry or in vitro gut model content with 5 mM ³⁴S-labeled sodium sulfate (≥95% atom enrichment).
- Time-Series Sampling: Collect triplicate samples at 0, 6, 12, 24, and 48 hours. For sediments, fix with 2% (w/v) zinc acetate to trap produced sulfide.
- Sulfide Precipitation & Analysis: Precipitate sulfide as ZnS, convert to Ag₂S, and analyze ³⁴S/³²S ratio via isotope-ratio mass spectrometry (IRMS).
- DNA/RNA-SIP: For active population identification, extract nucleic acids after incubation. Perform density gradient ultracentrifugation (CsTFA for DNA, Cs₂SO₄ for RNA). Fractionate, quantify density, and perform 16S rRNA amplicon or metatranscriptomic sequencing on heavy fractions.
Protocol 2: Metatranscriptomic Profiling of Gut Microbiome Sulfur Metabolism
- RNA Preservation & Extraction: Preserve gut/fecal samples immediately in RNAlater. Extract total RNA using a bead-beating protocol with phenol-chloroform and a column-based clean-up kit.
- rRNA Depletion & Library Prep: Deplete prokaryotic and host ribosomal RNA using sequence-specific probes. Construct cDNA libraries using a strand-specific protocol (e.g., Illumina TruSeq Stranded Total RNA).
- Sequencing & Bioinformatic Analysis: Perform 150bp paired-end sequencing on an Illumina platform. Trim adapters, quality filter reads. Map non-rRNA reads to a curated database of sulfur metabolism genes (KEGG, SEED subsystems) using Salmon for quantification. Normalize to transcripts per million (TPM).
Protocol 3: Targeted Sulfur Metabolite Quantification via LC-MS/MS
- Metabolite Extraction: Homogenize 50 mg of frozen sample (sediment/stool) in 1 mL of 80:20 methanol:water containing 0.1% formic acid and isotopically labeled internal standards (e.g., Na₂³⁴SO₄, ¹³C₃-taurine).
- Derivatization: For sulfite and sulfide, add 50 µL of a 10 mM solution of monobromobimane (mBBr) in acetonitrile. Incubate in the dark for 30 min. Reaction is quenched with 10 µL of 20% (v/v) methanesulfonic acid.
- LC-MS/MS Analysis: Separate derivatives on a C18 column (2.1 x 100 mm, 1.8 µm) using a water/acetonitrile gradient with 0.1% formic acid. Analyze using a triple quadrupole MS in negative electrospray ionization (ESI-) and multiple reaction monitoring (MRM) mode.
Visualizations
Title: Environmental Sulfur Cycle Informs Gut SRB Research
Title: Workflow: From Environmental Samples to Drug Target ID
The Scientist's Toolkit: Research Reagent Solutions
Table 2: Essential Reagents for Sulfur Metabolism Research
| Item | Function & Rationale |
|---|---|
| Sodium Sulfate-³⁴S (≥95% atom) | Stable isotope tracer for quantifying sulfate reduction rates (SRR) and tracking sulfur flow in SIP experiments in both sediments and gut models. |
| Zinc Acetate (2% w/v solution) | Anoxic fixative that rapidly precipitates sulfide (as ZnS), preventing its volatilization or oxidation during sample storage and processing. |
| Monobromobimane (mBBr) | Thiol-specific derivatizing agent for sensitive detection and quantification of labile sulfur species (sulfide, sulfite, thiols) via HPLC or LC-MS/MS. |
| RNAlater Stabilization Solution | Preserves the in situ transcriptional profile of microbial communities at collection, critical for accurate metatranscriptomic analysis of active pathways. |
| Density Gradient Media (CsTFA, Cs₂SO₄) | Essential for SIP ultracentrifugation, separating nucleic acids based on ¹³C or ¹⁸O/¹⁵N/²H incorporation to link activity to identity. |
| Anti-dsrA Antibody (for FISH) | Enables fluorescence in situ hybridization-flow cytometry (FISH-FC) for quantifying and sorting active sulfate-reducing bacteria from complex samples. |
| Gnotobiotic Mouse Models | Provides a controlled, germ-free host to reconstitute with specific SRB and study causal mechanisms of microbial sulfur metabolism on host physiology. |
Conclusion
This comparative analysis elucidates that while the core thermodynamics of the microbial sulfur cycle are universal, its execution in freshwater and marine sediments is fundamentally shaped by discrete environmental pressures—primarily sulfate availability and ionic strength—selecting for distinct microbial guilds and metabolic nuances. Methodological advances now allow us to move beyond census-taking to mechanistic, rate-based understanding, though significant optimization is required to overcome habitat-specific technical challenges. Validation across systems confirms that marine sediments typically host higher sulfate reduction rates and more diverse SRP lineages, whereas freshwater systems present unique consortia adapted to low-sulfate, dynamic redox conditions. The most significant implication for biomedical research lies in this microbial diversity as an untapped reservoir of novel biochemistry. The unique sulfur-transforming enzymes and bioactive secondary metabolites (e.g., organosulfur antibiotics, signaling molecules like H2S) discovered in these environments offer direct promise for drug discovery, particularly in antimicrobial and anti-cancer therapeutic development. Future research must prioritize coupling in situ activity measurements with targeted cultivation and metabolomics to bridge the gap between environmental process understanding and the translation of microbial sulfur chemistry into clinical applications, potentially illuminating parallels with sulfur-mediated processes in the human microbiome.