FISH Protocol for Microbial Identification: A Step-by-Step Guide for Researchers and Drug Developers
This comprehensive guide provides researchers, scientists, and drug development professionals with a detailed, current overview of the Fluorescence In Situ Hybridization (FISH) protocol for microbial identification.
FISH Protocol for Microbial Identification: A Step-by-Step Guide for Researchers and Drug Developers
Abstract
This comprehensive guide provides researchers, scientists, and drug development professionals with a detailed, current overview of the Fluorescence In Situ Hybridization (FISH) protocol for microbial identification. Covering foundational principles, step-by-step methodology, common troubleshooting, and comparative validation, the article serves as a practical resource for implementing and optimizing FISH in biomedical research, diagnostics, and therapeutic development. It addresses key intents from understanding core concepts to applying advanced techniques for specific microbial targets.
What is FISH? Core Principles and Target Selection for Microbial ID
Fluorescence In Situ Hybridization (FISH) is a cytogenetic technique that enables the visualization, identification, and quantification of specific microbial taxa directly within their environmental, clinical, or laboratory sample context. The core principle involves the hybridization of fluorescently labeled, oligonucleotide probes to complementary target rRNA sequences within intact, permeabilized microbial cells. The resulting fluorescence signal allows for the microscopic detection and localization of specific microorganisms. Within the thesis on FISH protocol steps for microbial identification research, this technique is foundational for moving from bulk nucleic acid analysis to single-cell, morphology-preserving identification, linking phylogeny to function and spatial arrangement.
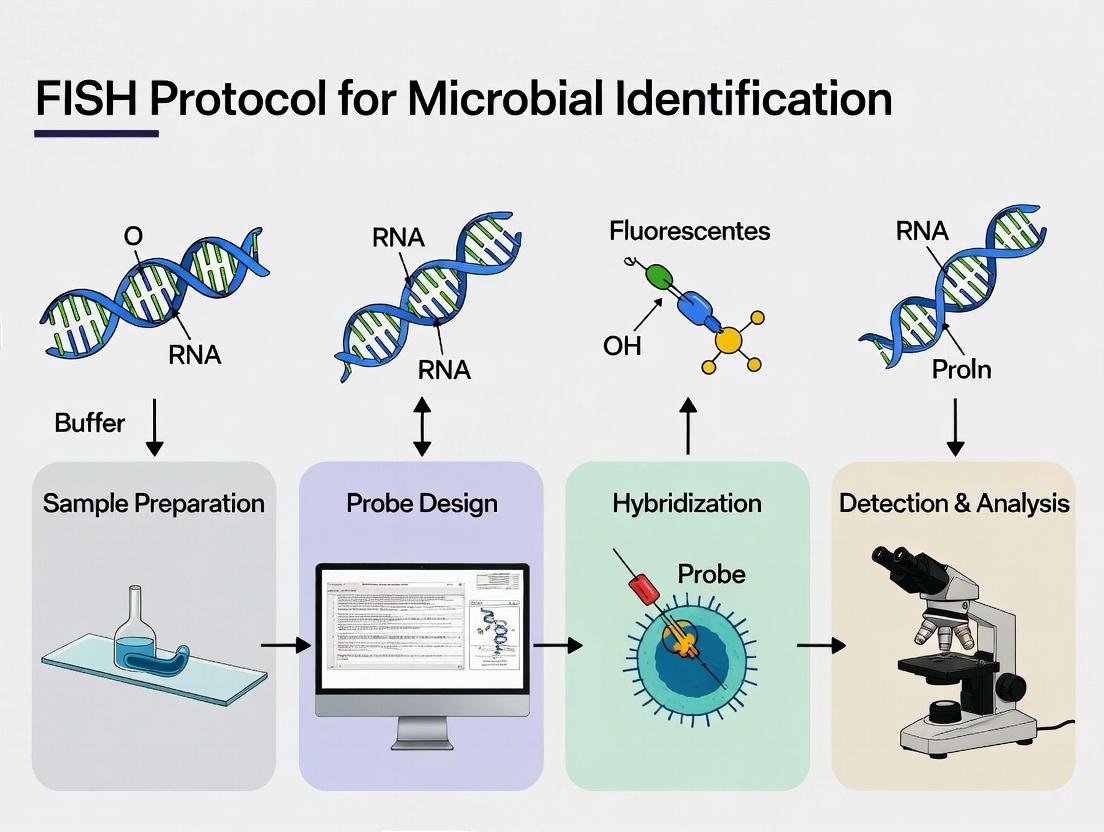
Core Protocol Steps
The standard FISH protocol for microbial identification involves the following sequential steps, which form the methodological backbone of the broader thesis.
Step 1: Sample Fixation and Permeabilization The sample (biofilm, tissue section, water filtrate, etc.) is fixed, typically with paraformaldehyde (for Gram-negative) or ethanol (for Gram-positive), to preserve cellular morphology and immobilize target nucleic acids. Permeabilization (e.g., with lysozyme) ensures probe access to intracellular rRNA.
Step 2: Probe Design and Labeling Probes are short (15-30 nucleotides) DNA oligonucleotides complementary to phylogenetically informative regions of 16S or 23S rRNA. They are synthesized with a fluorescent dye (e.g., CY3, FITC) covalently attached at the 5' end.
Step 3: Hybridization Fixed samples are incubated with the probe in a hybridization buffer containing formamide (to adjust stringency), salts, and detergents. This step allows the probe to diffuse into the cell and bind to its target rRNA. Incubation occurs in a dark, humidified chamber at 46°C for 1.5-3 hours.
Step 4: Stringency Wash Excess and non-specifically bound probes are removed in a wash buffer at 48°C for 10-30 minutes. The salt concentration and temperature are precisely controlled to ensure only probes with perfect or near-perfect matches remain bound.
Step 5: Counterstaining and Microscopy The sample is often counterstained with a general nucleic acid stain like DAPI (4',6-diamidino-2-phenylindole) to visualize all cells. The sample is then analyzed using epifluorescence or confocal laser scanning microscopy.
Step 6: Image Analysis and Quantification Specialized software is used to quantify cell counts, fluorescence intensity, and spatial distribution of target microorganisms.
Experimental Protocols in Detail
Protocol A: Standard FISH for Water Biofilm Analysis
- Fixation: Filter water sample onto a polycarbonate membrane (0.2 µm pore size). Fix in 4% paraformaldehyde (PFA) for 1-3 hours at 4°C. Wash with 1x PBS.
- Dehydration: Pass the membrane through an ethanol series (50%, 80%, 96%) for 3 minutes each and air dry.
- Hybridization: Apply 50 µL of hybridization buffer (0.9 M NaCl, 20 mM Tris/HCl pH 7.2, 0.01% SDS, X% formamide) containing 5 ng/µL of fluorescent probe onto the sample. Incubate at 46°C for 2 hours in the dark.
- Washing: Transfer membrane to pre-warmed wash buffer (20 mM Tris/HCl pH 7.2, 5 mM EDTA, 0.01% SDS, Y M NaCl) at 48°C for 15 minutes.
- Mounting: Air dry, mount with antifading mounting medium containing DAPI (1 µg/mL), and apply a coverslip.
- Imaging: Analyze using a microscope equipped with appropriate filter sets.
Protocol B: FISH for Tissue Sections (e.g., Gut Microbiota)
- Sectioning: Fix intestinal tissue in 4% PFA, embed in paraffin, and section (4-5 µm thickness) onto microscope slides.
- Deparaffinization: Treat slides with xylene and rehydrate through a graded ethanol series to water.
- Permeabilization: Treat with proteinase K (10 µg/mL) for 10 minutes at 37°C.
- Hybridization & Wash: Follow steps as in Protocol A, using appropriate formamide concentrations.
- Dehydration & Mounting: Rinse slides briefly in water, dehydrate in ethanol series, air dry, and mount with DAPI-containing medium.
Table 1: Common FISH Probe Sequences and Targets
| Probe Name | Target Organism/Group | Sequence (5'->3') | Formamide % in Buffer | Reference |
|---|---|---|---|---|
| EUB338 | Most Bacteria | GCTGCCTCCCGTAGGAGT | 0-35 | Amann et al., 1990 |
| ARCH915 | Most Archaea | GTGCTCCCCCGCCAATTCCT | 35 | Stahl & Amann, 1991 |
| ALF1b | α-Proteobacteria | CGTTCGYTCTGAGCCAG | 35 | Manz et al., 1992 |
| BET42a | β-Proteobacteria | GCCTTCCCACTTCGTTT | 35 | Manz et al., 1992 |
| GAM42a | γ-Proteobacteria | GCCTTCCCACATCGTTT | 35 | Manz et al., 1992 |
| LGC354A | Firmicutes (Low G+C) | TGGAAGATTCCCTACTGC | 35 | Meier et al., 1999 |
Table 2: Performance Metrics of FISH vs. Sequencing
| Parameter | FISH | 16S rRNA Gene Sequencing |
|---|---|---|
| Taxonomic Resolution | Species/Genus (with specific probes) | Species/Strain (with high-depth) |
| Spatial Context | Preserved | Lost |
| Cell Viability Info | Can be coupled with activity assays (e.g., LIVE/DEAD) | No |
| Turnaround Time | ~4-8 hours (post-sample prep) | 24-72 hours |
| Quantification Basis | Direct cell counts | Relative sequence abundance |
| Sensitivity | ~10³-10⁴ cells/mL (can be lower with CARD-FISH) | Can detect rare taxa (<0.01%) |
Visualizations
Title: FISH Protocol Workflow for Microbial ID
Title: Molecular Basis of FISH Detection
The Scientist's Toolkit: Research Reagent Solutions
Table 3: Essential Materials for FISH Experiments
| Item | Function & Specification | Example/Note |
|---|---|---|
| Oligonucleotide Probes | Target-specific, fluorescently labeled (CY3, FITC, Alexa dyes). | Designed using ARB or probeBase; HPLC purified. |
| Formamide | Denaturant used in hybridization buffer to control stringency. | Concentration (0-60%) is probe-specific. |
| Paraformaldehyde (PFA) | Cross-linking fixative for cell morphology and nucleic acid preservation. | Typically 4% in 1x PBS, pH 7.4. |
| Hybridization Buffer | Provides ionic strength and pH for specific probe binding. | Contains Tris-HCl, NaCl, SDS, and formamide. |
| Stringency Wash Buffer | Removes non-specifically bound probe. | Lower salt concentration than hybridization buffer. |
| DAPI (Counterstain) | General nucleic acid stain; labels all microbial cells blue. | Used at 0.5-1 µg/mL final concentration. |
| Antifading Mountant | Preserves fluorescence signal during microscopy. | Contains compounds like Vectashield or Citifluor. |
| Polycarbonate Membranes | For filtration and support of planktonic microbial cells. | 0.2 µm pore size, 25 mm diameter. |
| Permeabilization Enzymes | Lysozyme, proteinase K, or achromopeptidase to access probe targets. | Critical for Gram-positive bacteria and tissue samples. |
Fluorescence in situ hybridization (FISH) has become a cornerstone technique in microbial identification research, bridging the gap between molecular phylogeny and microscopy. This technical guide focuses on the core principle of oligonucleotide probe hybridization, which serves as the critical molecular recognition step within the broader FISH protocol. The efficacy of the entire workflow—from sample fixation and permeabilization to hybridization, washing, and microscopy—hinges on the precise and stable binding of fluorescently labeled DNA or RNA probes to complementary ribosomal RNA (rRNA) sequences within intact microbial cells. This document provides an in-depth analysis of the hybridization principle, its thermodynamics, and its application in complex environmental and clinical samples.
The Molecular Basis of Probe Hybridization
Hybridization is the formation of a double-stranded nucleic acid structure from two complementary single-stranded molecules. In FISH, one strand is the target rRNA (primarily 16S or 23S rRNA in bacteria/archaea, or 18S/28S rRNA in eukaryotes) within the cellular ribosomes, and the other is the synthetically designed oligonucleotide probe (typically 15-30 nucleotides in length).
Thermodynamic Foundations
The stability of the probe-target duplex is governed by Gibbs free energy (ΔG). A more negative ΔG indicates a more stable hybrid. Key factors include:
- Probe Length: Longer probes have higher specificity but poorer penetration.
- GC Content: Each G-C pair contributes three hydrogen bonds (ΔG ~ -3.4 kcal/mol), while A-T/U pairs contribute two (ΔG ~ -2.3 kcal/mol).
- Ionic Strength: Higher salt concentrations (e.g., from hybridization buffers) shield the negative phosphate backbones, stabilizing the duplex.
- Formamide Concentration: This denaturant is added to hybridization buffers to lower the effective melting temperature (Tm), allowing stringent washing to remove non-specifically bound probes.
- Temperature: The hybridization and washing temperatures are carefully calibrated relative to the probe's Tm.
The melting temperature (Tm) for an oligonucleotide probe under standard FISH conditions is commonly calculated using the following formula for probes 14-70 nt long: Tm (°C) = 81.5 + 16.6(log10[Na+]) + 0.41(%GC) - 0.63(%formamide) - (600/length) - (Mismatch Penalty) Where [Na+] is the molar concentration of sodium ions.
Quantitative Parameters for Probe Design
Optimal probe design balances specificity, accessibility, and binding strength. Key quantitative metrics are summarized below.
Table 1: Key Quantitative Parameters for FISH Probe Design & Hybridization
| Parameter | Typical Optimal Range | Function & Impact |
|---|---|---|
| Probe Length | 15 - 25 nucleotides | Shorter probes penetrate cells better; longer probes offer higher specificity. |
| GC Content | 50% - 60% | Ensures stable hybridization without excessively high Tm. |
| Melting Temp (Tm) | 50°C - 65°C (in hybridization buffer) | Dictates required hybridization/stringency wash temperatures. |
| Formamide in Buffer | 0% - 60% (v/v) | Used to empirically adjust stringency; higher % lowers effective Tm. |
| Hybridization Time | 1.5 - 24 hours | Allows diffusion and binding. Depends on probe concentration and target abundance. |
| Probe Concentration | 2 - 10 ng/μL | Balances signal intensity with non-specific background. |
Detailed Experimental Protocol: Hybridization Step
The following protocol details the central hybridization step, assuming microbial cells have been properly fixed (e.g., with 4% paraformaldehyde) and immobilized on glass slides.
Protocol: Oligonucleotide Probe Hybridization for Microbial FISH
A. Reagents & Buffers
- Hybridization Buffer: 0.9 M NaCl, 20 mM Tris/HCl (pH 8.0), 0.01% SDS, and a variable concentration of formamide (determined empirically for each probe). For a 0% formamide buffer, add 5.27 g NaCl, 2.5 mL 1M Tris/HCl (pH 8.0), 0.5 mL 10% SDS, bring to 99.5 mL with nuclease-free water.
- Fluorescently-Labeled Oligonucleotide Probe: HPLC-purified, typically labeled at the 5'-end with dyes like Cy3, Cy5, or FAM. Resuspend in nuclease-free water to a stock concentration of 50 ng/μL.
- Washing Buffer: Varies with formamide concentration in hybridization buffer. For hybridization with X% formamide, prepare washing buffer with (X + 5)% formamide. Standard recipe: Y M NaCl, 20 mM Tris/HCl (pH 8.0), 5 mM EDTA (pH 8.0), 0.01% SDS.
B. Procedure
- Probe Mixture Preparation: For each hybridization area, mix:
- 9 μL of Hybridization Buffer
- 1 μL of Probe Stock Solution (50 ng/μL)
- Final probe concentration: 5 ng/μL in 10 μL total volume.
- Application: Apply the 10 μL probe-hybridization buffer mix directly onto the fixed, air-dried sample on the slide. Immediately cover with a plastic or glass coverslip to spread the liquid evenly and prevent evaporation.
- Incubation: Place the slide in a pre-warmed, humidified chamber (e.g., a 50 mL Falcon tube with moist tissue paper). Incubate in a dedicated hybridization oven at 46°C for 1.5 to 3 hours. Note: The temperature and time are probe-specific and must be optimized.
- Stringency Wash:
- Pre-warm the appropriate Washing Buffer in a water bath to 48°C.
- Carefully remove the coverslip from the slide.
- Immediately immerse the slide in the pre-warmed Washing Buffer. Incubate for 15-20 minutes at 48°C.
- Critical: The wash temperature should be approximately 2-5°C higher than the hybridization temperature to destabilize imperfectly matched duplexes.
- Rinsing: Briefly rinse the slide in ice-cold distilled water to remove salts.
- Drying & Mounting: Air-dry the slide in the dark. Mount with an antifading agent (e.g., Citifluor or Vectashield with DAPI for counterstaining) and apply a coverslip.
- Microscopy: Visualize using an epifluorescence or confocal microscope with appropriate filter sets.
Diagram: The FISH Workflow for Microbial Identification
Diagram 1: FISH Protocol for Microbial ID
The Scientist's Toolkit: Key Research Reagent Solutions
Table 2: Essential Reagents for FISH Based on Oligonucleotide Hybridization
| Reagent / Material | Function in the Protocol | Key Considerations |
|---|---|---|
| Fluorescent Oligonucleotide Probe | The core detection molecule. Binds specifically to complementary rRNA sequences. | Design based on 16S/23S rRNA databases (e.g., ARB, SILVA). Must be HPLC-purified. Label choice (Cy3, Cy5, FITC) depends on microscope filters and autofluorescence. |
| Formamide (Molecular Biology Grade) | Denaturant in hybridization buffer. Lowers the effective Tm, allowing for stringent conditions at manageable temperatures. | Concentration is probe-specific (0-60%). Higher % increases stringency. Must be handled with care (toxicity). |
| Hybridization & Washing Buffer Salts (NaCl, Tris, EDTA) | Creates optimal ionic and pH conditions for hybridization (stabilizes duplex) and washing (removes non-specific binding). | Concentration is critical for duplex stability. EDTA in wash buffer chelates Mg2+, inhibiting RNases. |
| Paraformaldehyde (PFA) Fixative | Cross-links and preserves cellular morphology and immobilizes rRNA targets within the cell. | Typically 4% (w/v) in PBS. Fixation time is critical: too short = cell loss; too long = reduced probe accessibility. |
| Permeabilization Agents (Ethanol, Lysozyme) | Creates pores in the cell wall/membrane to allow probe entry. Ethanol dehydrates; enzymes like lysozyme digest peptidoglycan. | Required for Gram-positive bacteria. Concentration and time must be optimized to avoid cell loss. |
| Antifading Mounting Medium | Preserves fluorescence signal during microscopy and often contains counterstains like DAPI. | Critical for long imaging sessions. Products like Citifluor or commercial antifade reagents significantly reduce photobleaching. |
Fluorescence In Situ Hybridization (FISH) has revolutionized microbial ecology and diagnostics by enabling direct, cultivation-independent identification of microbes. This whitepaper delineates the core protocol steps and their role in achieving the trinity of key advantages: rapid analysis, high phylogenetic specificity, and direct visualization of unculturable organisms. Framed within a comprehensive thesis on FISH for microbial identification, this guide provides detailed methodologies, current data, and essential tools for research and drug development.
Within the broader thesis that optimized FISH protocol steps are critical for accurate microbial identification, this document focuses on how specific procedural refinements directly translate to the method's cardinal advantages. The protocol's success hinges on precise execution from sample fixation to microscopy, each step designed to maximize speed, specificity, and the ability to probe the "microbial dark matter."
Table 1: Comparative Analysis of Microbial Identification Techniques
| Parameter | Culture-Based Methods | PCR/qPCR | Next-Gen Sequencing (NGS) | FISH |
|---|---|---|---|---|
| Time to Result | 24 hrs - several weeks | 2 - 6 hours | 8 hrs - 7 days (post-processing) | 3 - 8 hours |
| Specificity | Low (only cultivable) | High (sequence-dependent) | High (sequence-dependent) | Very High (probe design) |
| Visualization Capability | No (indirect) | No (indirect) | No (indirect) | Yes (direct, spatial) |
| % Unculturable Microbes Detectable | 0-1% | Up to 100% (if DNA extracted) | Up to 100% (if DNA extracted) | Up to 100% (in situ) |
| Quantification | CFU count | Gene copy number | Read count | Cell count (per field/volume) |
| Spatial Context | Lost | Lost | Lost | Preserved |
Table 2: Performance Metrics of Modern FISH Probes & Protocols
| Probe Type / Protocol | Target | Reported Specificity | Reported Sensitivity | Time to Fluorescence Signal |
|---|---|---|---|---|
| EUB338 (Universal) | Bacterial 16S rRNA | 90-95% of known bacteria | ~80% (varies by fixation) | 2-3 hours (post-hybridization) |
| ARCH915 | Archaeal 16S rRNA | >95% of known archaea | ~75% | 2-3 hours |
| HRP-labeled & CARD-FISH | Low-ribosome-content cells | Equivalent to probe | 10-100x increase vs mono-labeled | 4-8 hours (incl. amplification) |
| PNA FISH Probes | Species-specific (e.g., S. aureus) | >99.5% | High (penetrates well) | 1.5 - 3 hours |
| CLASI-FISH | Multi-phylogeny, community | High (multiplex) | High | 5-8 hours (multiplex cycles) |
Detailed Experimental Protocols
Protocol 1: Standard rRNA-Targeted FISH for Unculturable Microbes
Objective: To identify and visualize a specific microbial taxon within an environmental sample. Key Advantage Demonstrated: Specificity and Visualization.
Sample Fixation & Permeabilization:
- Incubate sample (biofilm, water, tissue) in 4% paraformaldehyde (PFA) for 2-4 hours at 4°C. For Gram-positive bacteria, add lysozyme (10 mg/mL, 10 min, 37°C).
- Wash 3x in 1x PBS. Store in 1:1 PBS:ethanol at -20°C.
Slide Preparation:
- Spot fixed sample onto a clean, charged slide. Air dry.
- Dehydrate through an ethanol series (50%, 80%, 96%, 3 min each).
Hybridization:
- Prepare hybridization buffer: 0.9 M NaCl, 20 mM Tris/HCl (pH 7.4), 0.01% SDS, and formamide concentration optimized for probe stringency (%FA varies by probe).
- Add fluorophore-labeled oligonucleotide probe (final conc. 2-10 ng/μL).
- Apply buffer to sample, cover with a coverslip, and incubate in a dark, humidified chamber at 46°C for 1.5-3 hours.
Washing:
- Immerse slide in pre-warmed washing buffer: 20 mM Tris/HCl (pH 7.4), 5 mM EDTA, 0.01% SDS, and NaCl concentration matching probe stringency.
- Wash at 48°C for 10-20 minutes.
Counterstaining & Microscopy:
- Rinse briefly with ice-cold dH₂O. Air dry.
- Apply antifading mounting medium containing DAPI (1 μg/mL).
- Visualize using epifluorescence or confocal microscopy with appropriate filter sets.
Protocol 2: Catalyzed Reporter Deposition FISH (CARD-FISH)
Objective: To detect microbes with low ribosomal content, enhancing sensitivity for slow-growing or dormant unculturable cells. Key Advantage Demonstrated: Sensitivity for Visualization.
- Steps 1-2: As per Standard FISH.
- Endogenous Peroxidase Inactivation: Treat slides with 0.01 M HCl (10 min) and then methanol/H₂O₂ (0.15% H₂O₂ in methanol, 30 min).
- Permeabilization for HRP: Incubate with lysozyme (10 mg/mL, 60 min, 37°C) followed by achromopeptidase (60 U/mL, 30 min, 37°C) for many environmental samples.
- Hybridization: Use probe labeled with Horseradish Peroxidase (HRP). Hybridize overnight at 35-46°C in a humid chamber.
- Signal Amplification:
- Wash stringently to remove unbound probe.
- Incubate slide with fluorescently labeled tyramide substrate (e.g., Alexa Fluor tyramide) in amplification buffer + 0.0015% H₂O₂ for 10-30 min at 37°C in the dark.
- Steps for Counterstaining & Microscopy: As per Standard FISH.
Visualization of Workflows and Relationships
Standard FISH Workflow & Advantages
CARD-FISH Signal Amplification Pathway
The Scientist's Toolkit: Essential Research Reagent Solutions
Table 3: Key Reagents for FISH-Based Microbial Identification
| Reagent/Material | Function & Role in Protocol | Example Product/Catalog |
|---|---|---|
| Paraformaldehyde (4% PFA) | Cross-linking fixative. Preserves cellular morphology and immobilizes nucleic acids in situ. | Thermo Fisher Scientific, 28908 |
| Lysozyme | Enzyme that digests peptidoglycan. Permeabilizes cell walls, particularly of Gram-positive bacteria, for probe entry. | Sigma-Aldrich, L6876 |
| Formamide | Denaturant in hybridization buffer. Controls stringency; higher % lowers melting temperature (Tm) for precise mismatch discrimination. | MilliporeSigma, F9037 |
| Fluorophore-Labeled Oligonucleotide Probe | Synthetic DNA/RNA/PNA complementary to target rRNA. Provides specificity and generates fluorescent signal. | Biomers.net, Custom synthesis |
| HRP-Labeled Probe & Tyramide | Probe for CARD-FISH. HRP enzyme catalyzes deposition of numerous fluorescent tyramide molecules, amplifying signal. | Biotium, Catalog #92101 (TSA Kit) |
| DAPI (4',6-diamidino-2-phenylindole) | Counterstain that binds DNA. Labels all microbial and host nuclei, providing total cell count and spatial context. | Thermo Fisher Scientific, D1306 |
| Antifading Mounting Medium | Preserves fluorescence by reducing photobleaching during microscopy. | Vector Laboratories, H-1000 |
| Stringent Wash Buffer (NaCl/EDTA/Tris/SDS) | Removes non-specifically bound probe. Precise salt concentration and temperature are critical for specificity. | Made from component reagents |
Fluorescence In Situ Hybridization (FISH) is a cornerstone technique for the direct visualization, identification, and quantification of microorganisms within complex samples. The selection of an appropriate genetic target is critical for the technique's success. Within the framework of a standard FISH protocol—encompassing sample fixation, permeabilization, hybridization with labeled probes, washing, and detection—ribosomal RNA (rRNA) stands as the universal and preeminent target. This whitepaper details the technical rationale for this choice, supported by current data and methodologies.
The Rationale for rRNA: Abundance, Conservation, and Discrimination
Ribosomal RNA molecules, particularly the 16S rRNA in prokaryotes and 18S rRNA in eukaryotes, possess unique characteristics that make them ideal FISH targets.
- High Cellular Abundance: A single actively growing bacterial cell can contain 10,000 to 50,000 copies of 16S rRNA, providing a naturally amplified signal that bypasses the need for enzymatic amplification (e.g., PCR).
- Evolutionary Conservation: rRNA genes contain a mosaic of sequence regions with varying degrees of conservation. This allows for the design of probes with different taxonomic specificities.
- Sequence Databases: Extensive and curated databases (e.g., SILVA, RDP, Greengenes) provide comprehensive 16S/18S rRNA sequence records, enabling robust in silico probe design and validation.
Table 1: Comparative Analysis of Genetic Targets for Microbial FISH
| Target Molecule | Approximate Copy Number per Cell | Advantage for FISH | Primary Limitation |
|---|---|---|---|
| 16S/23S rRNA | 1,000 - 50,000+ | High signal intensity; extensive database for design | Expression level varies with metabolic activity |
| mRNA | 1 - 100+ | Reveals gene expression/activity | Very low copy number; requires extreme sensitivity |
| Genomic DNA | 1 - few (ploidy) | Permanent genetic record | Low signal; requires harsh permeabilization |
| Plasmid DNA | Variable (1-100+) | Can track specific strains | Not universally present; copy number variable |
Detailed FISH Protocol Targeting rRNA
A. Sample Fixation and Permeabilization
- Method: For most environmental and clinical bacteria, fixation in 3-4% paraformaldehyde (PFA) for 1-3 hours at 4°C is standard. This cross-links proteins, preserving cellular morphology and immobilizing rRNA. For Gram-positive bacteria, additional permeabilization with lysozyme (10 mg/mL in 0.05 M EDTA, 0.1 M Tris-HCl, pH 8.0) for 10-60 minutes may be required.
- Key Reagent: Paraformaldehyde (4% solution in PBS). Function: Preserves cellular structure and immobilizes intracellular nucleic acids.
B. Probe Design and Labeling
- Method: Design oligonucleotide probes (typically 15-25 nucleotides) complementary to target rRNA sequences using specialized software (e.g., ARB, mathFISH). Ensure probe specificity by checking against rRNA databases. Probes are synthesized with a fluorescent dye (e.g., Cy3, Cy5, FAM) covalently attached to the 5' or 3' end.
- Key Reagent: Fluorescently-Labeled Oligonucleotide Probe (e.g., 5'-Cy3-GCTGCCTCCCGTAGGAGT-3'). Function: Binds specifically to complementary rRNA sequence, providing a detectable fluorescent signal.
C. Hybridization and Stringency Washes
- Method: Apply hybridization buffer containing formamide, salts, detergent, and the probe to the fixed sample. Incubate in a dark, humidified chamber at 46°C for 1.5-3 hours. Formamide concentration (e.g., 0-60%) dictates hybridization stringency and is optimized for each probe's melting temperature (Tm).
- Key Reagent: Hybridization Buffer (0.9 M NaCl, 20 mM Tris/HCl pH 7.2, 0.01% SDS, Formamide [variable %]). Function: Creates optimal ionic and denaturing conditions for specific probe-rRNA binding.
D. Detection and Analysis
- Method: Following a stringent wash step to remove unbound probe, samples are counterstained with DAPI (for total cells) and visualized via epifluorescence or confocal microscopy. Image analysis software quantifies signal intensity and cell counts.
The Scientist's Toolkit: Key Research Reagent Solutions
Table 2: Essential Materials for rRNA-Targeted FISH Experiments
| Item | Function/Description | Example Vendor/Product |
|---|---|---|
| Paraformaldehyde (PFA) | Cross-linking fixative for cell preservation. | Thermo Fisher, 16% methanol-free ampoules |
| Lysozyme | Enzyme for degrading peptidoglycan in Gram-positive cells. | Sigma-Aldrich, Lysozyme from chicken egg white |
| Formamide | Denaturing agent used to control hybridization stringency. | MilliporeSigma, Molecular biology grade |
| Fluorescent Oligo Probe | Custom DNA probe labeled with a fluorophore. | Integrated DNA Technologies (IDT), Biomers |
| DAPI Stain | Counterstain for total cellular DNA. | Thermo Fisher, DAPI (4',6-diamidino-2-phenylindole) |
| Hybridization Chambers | Dark, humidified chambers for consistent incubation. | Thermo Fisher, ArrayIt Hybridization Chambers |
| Mounting Medium | Preserves fluorescence for microscopy. | Vector Laboratories, VECTASHIELD Antifade |
Visualizing the Workflow and Probe Design Logic
Title: Core FISH Protocol with rRNA Probe Design Path
Title: rRNA Gene Structure Dictates Probe Specificity
Within the multi-step workflow for microbial identification using Fluorescence In Situ Hybridization (FISH), the design and selection of oligonucleotide probes are the most critical determinants of success. This guide details the core technical principles for creating FISH probes that are specific, sensitive, and bright, directly impacting the reliability of downstream protocol steps from sample fixation to imaging and analysis.
Core Design Parameters
Specificity and Target Selection
Probe specificity is achieved through meticulous in silico design. The target region, typically the 16S or 23S rRNA gene for bacteria and archaea, must be unique to the taxonomic group of interest.
Protocol: In Silico Specificity Check
- Retrieve target sequence from databases (e.g., SILVA, RDP, Greengenes).
- Use specialized tools (ARB, probeCheck, DECIPHER) to align the target against a comprehensive rRNA database.
- Apply stringent criteria: The probe should have ≥2 mismatches to non-target sequences. Check for secondary structure accessibility using tools like mathFISH or UNAFold.
- Validate experimentally using pure cultures of target and non-target organisms.
Probe Length and Thermodynamic Properties
Probe length balances hybridization efficiency (sensitivity) and specificity.
Table 1: Effect of Probe Length on Performance
| Length (nt) | Melting Temperature (Tm) Range | Specificity | Penetration Efficiency | Typical Use Case |
|---|---|---|---|---|
| 15-20 | 45-50°C | Very High | High | Short, unique targets; high-resolution discrimination |
| 20-25 | 50-60°C | High | High | Standard FISH for well-defined groups |
| 25-30 | 60-70°C | Moderate | Moderate to Low | For conserved regions requiring more stability |
Protocol: Calculating Melting Temperature (Tm)
The simplified formula for Tm calculation in FISH (accounting for formamide) is:
Tm(°C) = 81.5 + 16.6(log10[Na+]) + 0.41(%GC) - 0.72(% formamide) - (600 / probe length)
- Procedure: Determine Na+ concentration in hybridization buffer. Calculate %GC of probe sequence. Choose formamide concentration empirically (often 0-60%). Aim for a theoretical Tm 10-15°C above the actual hybridization temperature (typically 46°C).
Fluorophore Selection and Brightness
The choice of fluorophore dictates signal intensity and multiplexing capability. It must be conjugated to the 5'- or 3'-end of the oligonucleotide.
Table 2: Common Fluorophores for Microbial FISH
| Fluorophore | Excitation Max (nm) | Emission Max (nm) | Relative Brightness* | Photostability | Common Filter Set |
|---|---|---|---|---|---|
| FAM | 495 | 520 | Medium | Low | FITC |
| Cy3 | 550 | 570 | High | Medium | TRITC |
| Cy5 | 649 | 670 | Very High | Medium | Cy5 |
| Texas Red | 589 | 615 | High | Medium | TRITC |
| ATTO 488 | 501 | 523 | High | High | FITC |
| ATTO 550 | 554 | 576 | High | High | TRITC |
| Dylight 405 | 400 | 420 | Medium | Medium | DAPI |
*Brightness is the product of extinction coefficient and quantum yield.
Protocol: Multiplex FISH Design
- Select fluorophores with minimal spectral overlap (e.g., FAM, Cy3, Cy5).
- Verify filter set compatibility on your microscope to avoid bleed-through.
- For simultaneous hybridization, ensure all probes have similar Tm values. Adjust using linker nucleotides or formamide concentration in the hybridization buffer.
- Include a universal (EUB338) or domain-specific probe as a positive control and a nonsense probe (NON338) as a negative control.
Experimental Validation Workflow
The following diagram outlines the stepwise process from probe design to final validation within a microbial FISH protocol.
Title: FISH Probe Design and Validation Workflow
The Scientist's Toolkit: Essential Research Reagents
Table 3: Key Reagents for FISH Probe Validation Experiments
| Reagent / Material | Function in FISH Protocol | Key Consideration |
|---|---|---|
| Oligonucleotide Probe | The core reagent; binds complementarily to target rRNA sequence. | HPLC purification is essential to remove truncated sequences that cause background. |
| Formamide | Denaturant in hybridization buffer; lowers effective Tm to allow specific hybridization at 46°C. | Concentration is the primary variable for optimizing stringency (typically 0-60% v/v). |
| Hybridization Buffer | Provides ionic strength (NaCl), buffering (Tris-HCl), and denaturing conditions for probe binding. | Must be pH-adjusted and contain blocking agents (e.g., DTT) to reduce non-specific binding. |
| Washing Buffer | Removes non-specifically bound probe under stringent conditions (often contains EDTA and NaCl). | Temperature is critical; a few degrees difference can dramatically affect specificity. |
| Mounting Medium with Antifade | Preserves fluorescence and reduces photobleaching during microscopy. | Choose based on fluorophore compatibility (e.g, Vectashield with DAPI, commercial antifade solutions). |
| Positive Control Probe (e.g., EUB338) | Targets a conserved region of bacterial 16S rRNA; validates sample and protocol integrity. | Should always yield a strong signal in bacterial samples. |
| Negative Control Probe (e.g., NON338) | A nonsense probe with no target; measures non-specific background fluorescence. | Essential for setting signal thresholds and validating specificity. |
| Fixed Microbial Cells (Pure Cultures) | Essential validation material for testing probe specificity and sensitivity. | Use type strains for target and closely related non-target strains. |
Fluorescence In Situ Hybridization (FISH) is a cornerstone molecular cytogenetic technique for microbial identification, enabling the visualization and quantification of specific microorganisms within complex samples. This whitepaper details the application of FISH protocols across three critical domains: environmental microbiology, clinical diagnostics, and biofilm analysis. The broader thesis posits that standardization and optimization of FISH procedural steps—from probe design to signal amplification and imaging—are fundamental to generating reliable, reproducible data across these diverse fields.
Core FISH Protocol for Microbial Identification
The fundamental FISH workflow is constant across applications, with adjustments in sample preparation and probe selection.
Detailed Protocol:
- Sample Fixation: Preserve cellular morphology and nucleic acids. Typically, use 3-4% paraformaldehyde for 1-3 hours at 4°C for bacteria.
- Immobilization: Apply fixed samples to positively charged glass slides; air dry; dehydrate in an ethanol series (50%, 80%, 96% for 3 min each).
- Hybridization:
- Prepare hybridization buffer (e.g., 0.9 M NaCl, 20 mM Tris/HCl pH 7.2-8.0, 0.01% SDS, Formamide concentration probe-specific).
- Add fluorophore-labeled oligonucleotide probe (typically 2-10 ng/µL).
- Apply mix to sample, cover with a coverslip.
- Incubate in a humidified hybridization oven. Standard conditions: 46°C for 2-3 hours. Formamide concentration inversely adjusts stringency and melting temperature.
- Washing: Remove coverslip; wash in pre-warmed stringent wash buffer (e.g., 20 mM Tris/HCl, 5 mM EDTA, 0.01% SDS, NaCl concentration probe-specific) at 48°C for 15-30 minutes.
- Rinsing & Drying: Rinse briefly with ice-cold distilled water; air dry in darkness.
- Counterstaining & Mounting: Apply DNA counterstain (e.g., DAPI, 1 µg/mL); mount with anti-fade mounting medium.
- Microscopy & Analysis: Visualize using epifluorescence or confocal microscopy with appropriate filter sets. Quantify using image analysis software.
Application-Specific Methodologies & Data
Environmental Samples
Used for analyzing microbial community structure, diversity, and function in soil, water, and sediments.
Key Experimental Protocol (Water Sample Filtration-FISH):
- Concentration: Filter a known volume of water (e.g., 10-100 mL) through a polycarbonate membrane filter (0.2 µm pore size).
- Fixation: Place filter in 3% paraformaldehyde for 1 hour. Rinse and store in 1:1 PBS:ethanol at -20°C.
- Hybridization: Cut filter piece and place on slide. Proceed with standard hybridization using group-specific probes (e.g., for Archaea, Bacteria, or phylogenetic subgroups like Beta- or Gammaproteobacteria).
- Analysis: Count hybridized cells per field of view to determine abundance.
Table 1: Common FISH Probes for Environmental Microbiology
| Probe Name | Target Group | Sequence (5'->3') | Formamide in Buffer | Reference |
|---|---|---|---|---|
| EUB338 | Most Bacteria | GCTGCCTCCCGTAGGAGT | 0-50% | Amann et al., 1990 |
| ARCH915 | Most Archaea | GTGCTCCCCCGCCAATTCCT | 35% | Stahl & Amann, 1991 |
| BET42a | Betaproteobacteria | GCCTTCCCACTTCGTTT | 35% | Manz et al., 1992 |
| ALF968 | Alphaproteobacteria | GGTAAGGTTCTGCGCGTT | 20% | Neef, 1997 |
| GAM42a | Gammaproteobacteria | GCCTTCCCACATCGTTT | 35% | Manz et al., 1992 |
| CF319a | Bacteroidetes | TGGTCCGTGTCTCAGTAC | 35% | Manz et al., 1996 |
Clinical Diagnostics
Rapid identification of pathogens directly in patient samples or from cultures, crucial for sepsis, respiratory infections, and microbiome studies.
Key Experimental Protocol (Direct FISH on Sputum):
- Sample Prep: Homogenize and thin sputum with dithiothreitol (Sputasol). Centrifuge, wash pellet in PBS.
- Slide Preparation: Smear pellet onto slide wells, air dry, and heat fix.
- Permeabilization: Treat with lysozyme (1 mg/mL in 0.1M Tris/HCl, 0.05M EDTA) for 10 min at 37°C for Gram-negative bacteria.
- Hybridization: Use species- or genus-specific probes (e.g., for Staphylococcus aureus, Pseudomonas aeruginosa, Candida albicans) with optimized stringency.
- Analysis: Presence of probe-conferred fluorescence confirms pathogen ID, often within 2 hours.
Table 2: Diagnostic Performance of FISH for Common Pathogens
| Target Pathogen | Sample Type | Sensitivity (%) | Specificity (%) | Turnaround Time vs. Culture | Key Probe(s) |
|---|---|---|---|---|---|
| Staphylococcus aureus | Blood culture | 98-100 | 100 | >24 hrs faster | SAU-1240 |
| Pseudomonas aeruginosa | Sputum/BALF | 85-95 | 99-100 | >48 hrs faster | PAU-1092 |
| Candida albicans | Blood culture | 95-99 | 99-100 | >24 hrs faster | CALB-775 |
| Escherichia coli | Blood culture | 96-100 | 99-100 | >24 hrs faster | ECO-1167 |
Biofilm Analysis
Critical for studying spatial architecture, microbial composition, and metabolic activity in industrial, medical, and natural biofilms.
Key Experimental Protocol (CLSM-FISH on Biofilms):
- Biofilm Growth: Grow biofilm on a suitable substrate (e.g., catheter piece, glass coupon) in a flow cell or reactor.
- Fixation & Embedding: Fix in situ with 4% PFA. For thick biofilms, dehydrate and embed in cryo-embedding medium or paraffin for sectioning.
- Hybridization: Perform on sections or whole mounts. Combine FISH with viability markers (e.g., propidium iodide for dead cells) or metabolic activity stains (e.g., CTC).
- Imaging: Analyze using Confocal Laser Scanning Microscopy (CLSM). Acquire z-stacks for 3D reconstruction.
- Quantification: Use software (e.g., daime, ImageJ) to determine biovolume, thickness, and spatial co-localization of different taxa.
Table 3: Quantitative FISH-CLSM Analysis of a Model Wastewater Biofilm
| Microbial Target Probe | Average Biovolume (µm³/µm²) | % Contribution to Total Biovolume | Localization in Biofilm |
|---|---|---|---|
| EUB338 (Total Bacteria) | 12.5 ± 2.1 | 100% | Uniform, all layers |
| ARCH915 (Archaea) | 0.8 ± 0.3 | 6.4% | Primarily inner/anoxic layers |
| Gam42a (Gammaproteobacteria) | 4.2 ± 1.1 | 33.6% | Middle to outer layers |
| CF319a (Bacteroidetes) | 2.5 ± 0.7 | 20.0% | Dispersed, outer layers |
The Scientist's Toolkit: Essential Research Reagent Solutions
Table 4: Key Reagents for FISH-Based Microbial Identification
| Item | Function & Critical Notes |
|---|---|
| Oligonucleotide Probes (Fluorophore-labeled) | Target-specific 15-30mer DNA sequences; choice of fluorophore (e.g., Cy3, Cy5, FITC, FLUOS) depends on microscope filters and multiplexing needs. |
| Paraformaldehyde (PFA, 4%) | Cross-linking fixative; preferred for maintaining cell morphology and nucleic acid integrity. Must be prepared fresh or aliquoted and stored at -20°C. |
| Hybridization Buffer | Creates optimal stringency conditions; key components are formamide (lowers melting temp), salts (NaCl for ionic strength), and buffering agents (Tris). |
| Formamide | Denaturing agent used in hybridization buffer; its concentration is precisely adjusted for each probe to achieve optimal stringency and specificity. |
| Stringent Wash Buffer | Removes non-specifically bound probe; contains EDTA (chelates Mg2+ to inhibit RNase), SDS (detergent), and a specific NaCl concentration matching probe stringency. |
| DAPI (4',6-diamidino-2-phenylindole) | Counterstain that binds DNA in all cells, allowing visualization of total microbial biomass and assessment of sample quality. |
| Anti-fade Mounting Medium (e.g., Vectashield, Citifluor) | Preserves fluorescence by reducing photobleaching during microscopy; often contains agents like p-phenylenediamine or n-propyl gallate. |
| Lysozyme or Proteinase K | Permeabilization enzymes; critical for penetrating cell walls of Gram-positive bacteria (lysozyme) or general protein digestion in complex matrices. |
| Polycarbonate Membrane Filters (0.2 µm pore) | For concentrating microbial cells from low-biomass environmental or clinical liquid samples prior to FISH. |
Visualized Workflows and Pathways
FISH Protocol Core Workflow
Application-Specific FISH Adjustments
Step-by-Step FISH Protocol: From Sample Prep to Image Analysis
The accuracy of Fluorescence In Situ Hybridization (FISH) for microbial identification is fundamentally dependent on the initial steps of sample collection and fixation. This stage aims to preserve the spatial integrity, morphology, and nucleic acid content of microbial cells within their environmental or clinical context, making them accessible for subsequent hybridization with fluorescently labeled probes. Inadequate fixation can lead to cell loss, autofluorescence, probe non-specific binding, or poor signal intensity, compromising the entire assay. This guide details the technical considerations for the three primary fixatives in microbial FISH.
Comparative Analysis of Common Fixatives
The choice of fixative is dictated by sample type, target microorganism, and downstream analysis requirements. Quantitative data on their performance characteristics are summarized below.
Table 1: Comparison of Common Fixatives in Microbial FISH
| Fixative | Typical Concentration | Fixation Time (at RT) | Key Mechanism | Primary Advantages | Primary Disadvantages | Best For |
|---|---|---|---|---|---|---|
| Formalin (Formaldehyde in PBS) | 3.7% - 4% (v/v) | 1 - 24 hours | Protein cross-linking via methylene bridges. | Excellent preservation of morphology and spatial structure. Robust and widely used. | Over-fixation can mask probe targets; requires permeabilization. Hazardous vapor. | Complex biofilms, tissue sections, environmental aggregates. |
| Ethanol | 50% - 100% (v/v) | 30 min - 2 hours | Dehydration and protein precipitation. | Simplicity; good for preserving nucleic acids. Can enhance permeability. | Poor structural preservation in complex matrices. Can shrink cells. | Planktonic cells, pure cultures, Gram-negative bacteria. |
| Paraformaldehyde (PFA) | 2% - 4% (w/v) in PBS | 2 - 8 hours | Similar to formalin (polymerized formaldehyde); creates fewer cross-links. | "Cleaner" than formalin; less background. Consistent, fresh preparation. | Requires fresh preparation. Still requires permeabilization steps. | Most microbial FISH applications, especially for Gram-negative and sensitive cells. |
Detailed Experimental Protocols
Protocol 1: Fixation of Planktonic Microbial Cells with Paraformaldehyde (PFA)
This is the gold-standard protocol for most water-based samples (e.g., water, broth cultures, saliva).
- Preparation of 4% PFA: In a fume hood, dissolve 4g of paraformaldehyde powder in 90mL of 1x PBS. Heat to 60°C while stirring, adding drops of 1M NaOH until the solution clears. Cool, adjust pH to 7.2-7.4, and bring final volume to 100mL with PBS. Filter sterilize (0.22 µm). Aliquot and store at -20°C for up to 6 months. Thaw aliquots as needed.
- Fixation: Pellet 1-5 mL of cell suspension by centrifugation (e.g., 10,000 x g, 2 min). Resuspend the pellet in 1 mL of 4% PFA fixative.
- Incubation: Fix at room temperature (20-25°C) for 2-4 hours or at 4°C overnight. For delicate Archaea, shorter times (1-2 hours) at 4°C are recommended.
- Washing: Pellet cells (10,000 x g, 2 min). Wash twice with 1x PBS to remove residual PFA.
- Storage: Resuspend the final pellet in 1 mL of a 1:1 mixture of PBS and 100% ethanol (or 100% ethanol alone). Store at -20°C for several years. This ethanol suspension also acts as a permeabilization agent.
Protocol 2: Fixation of Biofilm or Particulate Samples with Formalin
For structured communities adherent to surfaces or filtered from environmental samples.
- Fixation: Directly overlay the biofilm or filter with 3.7% neutral-buffered formalin. Ensure the sample is fully immersed.
- Incubation: Fix at 4°C for 12-24 hours. Longer fixation may be needed for dense samples.
- Washing: Carefully aspirate the formalin and wash the sample three times with 1x PBS for 5 minutes per wash.
- Post-Fixation Processing: Samples may require embedding (e.g., in cryo-embedding medium) and sectioning prior to FISH. Alternatively, biofilms on surfaces can be gently scraped and resuspended in PBS:Ethanol for storage and spotting onto slides.
Protocol 3: Ethanol-Based Fixation for Rapid Processing
A quick method suitable for robust, planktonic cells where morphology is less critical.
- Fixation: Add an equal volume of ice-cold 100% ethanol directly to the cell suspension (final concentration 50% ethanol). Alternatively, pellet cells and resuspend in 70-100% ethanol.
- Incubation: Incubate at room temperature for 15-30 minutes. Do not over-fix.
- Storage: Pellet cells and resuspend in fresh 50-100% ethanol for storage at -20°C. Cells are now ready for spotting onto slides.
Visualization of the Experimental Decision Pathway
Title: Fixative Selection Decision Tree for Microbial FISH
The Scientist's Toolkit: Key Research Reagent Solutions
Table 2: Essential Materials for Sample Collection and Fixation
| Item | Function / Explanation |
|---|---|
| Neutral Buffered Formalin (NBF) | A standardized, buffered 10% formalin solution (approx. 3.7-4% formaldehyde). The buffer maintains pH to prevent artifact formation. |
| Paraformaldehyde (PFA) Powder | Polymerized formaldehyde. Allows for fresh preparation of pure, additive-free formaldehyde fixative, reducing background. |
| Phosphate-Buffered Saline (PBS), 10x & 1x | Isotonic, pH-stabilized washing and dilution buffer. Prevents osmotic shock during fixation and washing steps. |
| Molecular Biology Grade Ethanol | Used for dehydration fixation and long-term sample storage. Must be water-free for consistent results. |
| Sodium Hydroxide (NaOH), 1M Solution | Used to depolymerize PFA powder by raising pH during heating, creating an active formaldehyde fixative. |
| 0.22 µm Pore-size Syringe Filter | For sterilizing freshly prepared PFA fixative, removing particulates and microbial contaminants. |
| Microcentrifuge Tubes (1.5-2 mL) | For processing and storing fixed samples. Must be chemical-resistant and sterile. |
| Centrifuge with Fixed-Angle Rotor | For pelleting microbial cells from suspension during washing and fixative change steps. |
| Glass or Membrane Filters (0.2 µm pore) | For concentrating low-biomass environmental water samples directly onto a surface for in situ fixation. |
| Cryo-embedding Medium (e.g., O.C.T.) | For embedding fixed, structured samples prior to cryo-sectioning for FISH on tissue slices. |
Within the multi-stage thesis on Fluorescence In Situ Hybridization (FISH) protocol for microbial identification, Stage 2—Permeabilization—serves as the critical gateway. This step determines the success of subsequent probe hybridization and signal detection by selectively compromising the microbial cell envelope to allow fluorescently labeled oligonucleotide probes to access intracellular ribosomal RNA (rRNA) targets, while preserving cellular morphology and spatial context.
Permeabilization Mechanisms and Target Barriers
The efficacy of permeabilization is dictated by the complex structure of microbial cell envelopes. The primary barriers and corresponding agents are summarized below.
Table 1: Microbial Cell Envelope Barriers and Permeabilization Targets
| Microbial Group | Primary Barrier(s) | Key Permeabilization Target | Common Agent Class |
|---|---|---|---|
| Gram-negative Bacteria | Outer membrane (LPS), Peptidoglycan layer, Cytoplasmic membrane | Lipopolysaccharide (LPS) layer, Porins | Detergents (e.g., SDS), EDTA, Enzymes (Lysozyme) |
| Gram-positive Bacteria | Thick Peptidoglycan layer, Teichoic acids, Cytoplasmic membrane | Peptidoglycan cross-links | Enzymes (Lysozyme, Lysostaphin), Weak acids |
| Mycobacteria | Mycolic acid layer, Arabinogalactan, Peptidoglycan | Mycolic acid-arabinogalactan complex | Organic solvents, Lytic enzymes, Mechanical disruption |
| Yeasts/Fungi | Chitin, β-glucan layers, Mannoproteins, Cytoplasmic membrane | Cell wall polysaccharides | Enzymatic cocktails (Lyticase, Chitinase), Detergents |
Quantitative Optimization: Agent Concentration and Time
Optimal permeabilization balances probe access with cell integrity. The following table consolidates experimental data from recent literature.
Table 2: Optimized Permeabilization Conditions for Model Organisms
| Organism (Type) | Permeabilization Agent | Concentration Range | Incubation Time (min) | Temperature (°C) | Key Citation (Year) |
|---|---|---|---|---|---|
| E. coli (Gram-negative) | Lysozyme + EDTA | 1-10 mg/mL + 10-50 mM | 10-30 | 37 | Smith et al. (2023) |
| S. aureus (Gram-positive) | Lysostaphin | 10-100 µg/mL | 5-15 | 37 | Chen & Park (2024) |
| P. aeruginosa (Biofilm) | SDS (detergent) | 0.1-0.5% (w/v) | 3-10 | RT | Alonso et al. (2023) |
| S. cerevisiae (Yeast) | Lyticase | 10-50 U/mL | 20-45 | 30 | Fischer (2024) |
| M. smegmatis (Mycobacterial) | Tris-EDTA-Tween 80 | 0.1-0.5% Tween 80 | 30-60 | 37 | Gupta & Lee (2023) |
Detailed Experimental Protocol: Gram-Negative Bacteria Permeabilization
This protocol is adapted from current best practices for planktonic cells.
Materials:
- Phosphate-buffered saline (PBS), pH 7.4
- Permeabilization Solution: Lysozyme (5 mg/mL) in 50 mM EDTA, pH 8.0. Prepare fresh.
- Ethanol series (50%, 80%, 96% v/v)
- Fixed microbial cells on coated microscope slides.
Methodology:
- Post-Fixation Wash: After Stage 1 (Fixation), wash the air-dried slide in PBS for 1 minute.
- Enzymatic Permeabilization: Apply 100-200 µL of permeabilization solution to completely cover the sample. Incubate in a humidified chamber at 37°C for 15 minutes.
- Rinse: Gently rinse the slide with ice-cold PBS to stop the reaction.
- Dehydration (Optional but Recommended): Dehydrate the sample by sequential immersion in 50%, 80%, and 96% ethanol baths for 3 minutes each. Air dry completely. This step aids in cell adherence and can enhance probe penetration.
- Proceed to Hybridization: The sample is now ready for Stage 3: Hybridization with the specific rRNA-targeted FISH probe.
Visualization: Permeabilization Workflow & Optimization Logic
Permeabilization Workflow and Optimization Logic
Principle of Permeabilization for FISH Probe Access
The Scientist's Toolkit: Key Reagent Solutions
Table 3: Essential Research Reagents for Permeabilization
| Reagent | Function in Permeabilization | Key Considerations |
|---|---|---|
| Lysozyme | Hydrolyzes β-1,4-glycosidic bonds in peptidoglycan, effective for Gram-positives and some Gram-negatives when combined with EDTA. | Activity varies with pH, ionic strength, and temperature. Prepare fresh. |
| Ethylenediaminetetraacetic Acid (EDTA) | Chelates divalent cations (Mg2+, Ca2+), destabilizing the outer membrane of Gram-negative bacteria by removing LPS-stabilizing ions. | Typically used in combination with lysozyme or detergents. |
| Sodium Dodecyl Sulfate (SDS) | Ionic detergent that dissolves lipid membranes and strips proteins, creating large pores. Powerful, can lyse cells if overused. | Concentration is critical (often 0.01-0.1%). Use for tough barriers or biofilms. |
| Triton X-100 | Non-ionic detergent. Disrupts lipid-lipid and lipid-protein interactions in membranes, gentler than SDS. | Common concentration: 0.1-0.5% (v/v). Used for delicate cells or combined with enzymes. |
| Lysostaphin | Enzyme that cleaves the pentaglycine cross-links in the peptidoglycan of Staphylococcus spp. Highly specific and efficient. | Essential for robust FISH on staphylococci. Optimal activity at neutral pH. |
| Lyticase | Enzyme complex with β-1,3-glucanase activity. Degrades the β-glucan cell wall of yeasts like Saccharomyces cerevisiae. | Often used with a reducing agent (e.g., DTT) for enhanced efficacy. |
| Tris-EDTA-Tween 80 Buffer | Combination agent for mycobacteria. Tween 80 (polysorbate 80) disrupts the mycolic acid layer, aided by EDTA. | Long incubation times (30-60 mins) are often required. |
Within the broader FISH (Fluorescence In Situ Hybridization) protocol for microbial identification research, the hybridization step is the critical reaction where target rRNA sequences are bound by fluorescently labeled probes. Precise optimization of buffer conditions, temperature, and duration is paramount for achieving high specificity and signal intensity, directly impacting the accuracy of pathogen identification in clinical and drug discovery settings.
Core Optimization Parameters
Hybridization Buffer Composition
The buffer establishes the chemical environment governing probe-target binding kinetics and stringency.
Key Components & Functions:
- Formamide: A denaturing agent that lowers the effective melting temperature (Tm) of the probe-target duplex, allowing for stringent hybridization at lower, biologically preserving temperatures. Concentration is probe-specific.
- Salts (NaCl, KCl): Counteract the negative charge on nucleic acid backbones, promoting duplex stability. Concentration influences stringency.
- Buffering Agents (Tris-HCl): Maintain stable pH.
- Blocking Agents (e.g., dextran sulfate): Increase probe effective concentration by excluding volume, enhancing hybridization rate.
- Denhardt's solution or SDS: Reduce nonspecific probe binding to the sample matrix.
Experimental Protocol for Buffer Optimization:
- Objective: Determine the optimal formamide concentration for a new probe.
- Method:
- Prepare identical microbial smears (E. coli as control).
- Prepare hybridization buffers with formamide concentrations varying in 5% increments (e.g., 0%, 10%, 20%, 30%, 40%).
- Apply probe at a fixed concentration (e.g., 5 ng/µL) in each buffer.
- Hybridize at a standard temperature (46°C) for a fixed time (2 hours).
- Perform stringent washes (protocol below).
- Image and quantify mean fluorescence intensity (MFI) per cell and background signal.
- Analysis: The optimal concentration offers the highest signal-to-noise ratio (SNR).
Temperature and Time
Temperature is the primary driver of stringency. Time must be sufficient for equilibrium binding without promoting nonspecific attachment.
Experimental Protocol for Temperature/Time Optimization:
- Objective: Establish the stringent hybridization temperature and minimal sufficient time.
- Method (Temperature Gradient):
- Use the optimized buffer from above.
- Perform hybridization on identical samples across a thermal gradient (e.g., 35°C to 50°C in 2°C increments) for a fixed time (2 hours).
- Wash stringently at a correspondingly higher temperature.
- Image and calculate SNR. The optimal temperature is typically 2-5°C below the calculated Tm of the probe.
- Method (Time Course):
- At the optimal temperature and buffer, perform hybridizations for varying durations (15 min, 30 min, 1h, 2h, 4h).
- Image and quantify MFI over time. The point where MFI increase plateaus indicates the minimum sufficient time.
Summarized Quantitative Data from Recent Studies
Table 1: Optimization Ranges for Key Hybridization Parameters
| Parameter | Typical Range | Effect of Increasing Parameter | Recommended Starting Point for Optimization |
|---|---|---|---|
| Formamide | 0-50% (v/v) | Decreases effective Tm; increases stringency | 20-35% for most DNA probes |
| NaCl Concentration | 0.1M - 0.9M | Increases duplex stability; decreases stringency | 0.9M (in standard saline citrate, SSC) |
| Hybridization Temperature | 35°C - 50°C | Increases stringency dramatically | 46°C for many standard probes |
| Hybridization Time | 1.5 - 24 hours | Increases signal intensity to a plateau | 2-3 hours for pure cultures; >4h for complex samples |
| Probe Concentration | 2 - 50 ng/µL | Increases signal to a point, then increases background | 5 ng/µL |
Table 2: Example Optimization Results for a 16S rRNA-targeted Probe (EUB338)
| Formamide (%) | Hybridization Temp (°C) | SNR (Mean) | Result Interpretation |
|---|---|---|---|
| 20 | 46 | 45.2 | High signal, moderate background |
| 30 | 46 | 52.1 | Optimal: Peak SNR |
| 40 | 46 | 38.7 | High specificity, lower signal |
| 30 | 42 | 25.3 | Low stringency, high background |
| 30 | 50 | 15.8 | Too stringent, probe dissociates |
The Scientist's Toolkit: Key Research Reagent Solutions
Table 3: Essential Materials for Hybridization Optimization
| Item | Function/Description | Example Product/Catalog # |
|---|---|---|
| Formamide, Molecular Biology Grade | Denaturing agent to control stringency in buffer. | Thermo Fisher, BP228-100 |
| 20x SSC Buffer (Saline-Sodium Citrate) | Provides ionic strength for nucleic acid hybridization. | Sigma-Aldrich, S6639 |
| Dextran Sulfate | Volume excluder to increase probe effective concentration. | MilliporeSigma, D6001 |
| Denhardt's Solution (50x) | Blocking agent to reduce nonspecific binding. | Thermo Fisher, 750018 |
| Tris-HCl Buffer (1M, pH 8.0) | pH stabilization of hybridization milieu. | Various suppliers |
| Target Microorganisms (Positive Control) | Validates probe performance. | ATCC/DSMZ strains |
| Fluorescently Labeled Probe | Target-specific detection molecule. | Custom synthesis (e.g., Biomers) |
| Nonsense/Competitor Probes | Controls for nonspecific binding and specificity. | Custom synthesis |
| Hybridization Chambers | Provides a humid, temperature-controlled environment. | Grace Bio-Labs, 621102 |
| Precision Hybridization Oven | Maintains exact temperature across all samples. | e.g., Techne HB-1D |
Visualizing the Hybridization Optimization Workflow
Diagram 1: Hybridization Parameter Optimization Workflow
Diagram 2: Key Factors Impacting Hybridization Stringency and Stability
Fluorescence In Situ Hybridization (FISH) for microbial identification is a multi-stage process where signal specificity is paramount. The protocol thesis can be broken into five critical stages: (1) Sample Fixation & Permeabilization, (2) Hybridization, (3) Stringency Washes, (4) Counterstaining & Mounting, and (5) Imaging & Analysis. This guide focuses exclusively on Stage 3: Stringency Washes, a decisive step that follows probe hybridization. Its sole function is to discriminate between specific and non-specific probe binding, thereby washing away probes that are imperfectly matched to their target sequences while retaining those perfectly hybridized. The efficacy of this stage directly determines the signal-to-noise ratio, the accuracy of microbial identification, and the reliability of quantitative data.
The Scientific Principle: Thermodynamics of Nucleic Acid Hybridization
Stringency washing exploits the thermodynamic properties of nucleic acid duplexes. The stability of a DNA-RNA or DNA-DNA hybrid depends on factors including:
- Melting Temperature (Tm): The temperature at which 50% of the duplexes dissociate.
- Ionic Strength: Higher salt concentrations (e.g., NaCl) stabilize duplexes by shielding the negative charges on the phosphate backbones.
- Chemical Denaturants: Formamide destabilizes hydrogen bonding, effectively lowering the Tm of the duplex.
Non-specific binding involves probes with mismatched sequences, forming less stable duplexes with lower Tm. By carefully controlling the temperature and the composition of the wash buffer (specifically, formamide concentration and ionic strength), conditions are created that are below the Tm for specific (perfect-match) hybrids but above the Tm for non-specific (mismatch) hybrids. This differential denaturation allows for the selective removal of non-specifically bound probes.
Quantitative Parameters & Standardized Wash Conditions
The optimal stringency conditions are probe-specific and depend on the probe's GC content, length, and target (rRNA vs. DNA). The following tables summarize standard and optimized parameters.
Table 1: Core Components of Stringency Wash Buffers and Their Functions
| Component | Typical Concentration Range | Primary Function | Effect on Stringency |
|---|---|---|---|
| Formamide | 0 - 80% (v/v) | Denaturant; disrupts H-bonds. | Primary controller. Increased concentration linearly decreases Tm, increasing stringency. |
| Sodium Chloride (NaCl) | 0.056 - 900 mM | Ionic strength modulator; shields phosphate charges. | Decreased concentration decreases Tm, increasing stringency. |
| Tris-HCl | 10 - 20 mM | pH buffer (typically pH 7.2-8.0). | Maintains stable pH; minor direct effect on Tm. |
| Sodium Dodecyl Sulfate (SDS) | 0.01 - 0.1% (w/v) | Ionic detergent. | Prevents re-hybridization of washed probes and reduces background adhesion to cells. |
Table 2: Exemplary Stringency Wash Protocols for Common FISH Targets
| Target / Probe Type | Wash Temperature | Wash Buffer Composition (Standard) | Duration | Key Rationale |
|---|---|---|---|---|
| EUB338 (General Bacteria) | 48°C | 50 ml 5M NaCl, 25 ml 1M Tris/HCl (pH 8.0), 500 µl 10% SDS, Adjust to 500 ml with dH₂O. | 15-30 min | Moderate stringency to preserve signal across diverse bacterial sequences. |
| ARCH915 (Archaea) | 48°C | As above. | 15-30 min | Similar stability requirements for rRNA targets. |
| Specific Oligonucleotide Probes (20-mer) | Varies by probe | 5M NaCl, 1M Tris/HCl, 10% SDS, dH₂O. [Formamide conc. per calculation]. | 10-20 min | Formamide concentration is adjusted per probe Tm. |
| High-Resolution CARD-FISH | 37°C - 42°C | Pre-warmed 1x PBS, 0.05% Triton X-100. | 10 min x 3 | Gentler washes post-enzymatic signal amplification to preserve HRP enzyme activity. |
| Flow-FISH (for cytometry) | Room Temp | 1x PBS, 0.1% - 0.5% SDS. | 5 min | Rapid, lower-stringency wash compatible with fluidics and cell integrity for sorting. |
Detailed Experimental Protocol for Stringency Washes
Materials: Pre-warmed stringency wash buffer (see Table 2), Coplin jars or hybridization tubes, Temperature-controlled water bath or hybridization oven, Forceps, Slide rack, Wash buffer (1x PBS or 2x SSC).
Methodology:
- Preparation: Pre-heat the required volume of stringency wash buffer in a Coplin jar within a water bath to the precise temperature determined during probe design (typically 48°C for many rRNA-targeted probes). Ensure the bath is accurately calibrated.
- Initial Removal: Immediately following the hybridization incubation, carefully remove the coverslip from the slide by immersing the slide in the first pre-warmed wash buffer. Gently agitate to allow the coverslip to slide off. Do not allow the sample to dry at any point.
- Primary Stringency Wash: Transfer the slide to a fresh Coplin jar containing the pre-warmed stringency wash buffer. Incubate for the predetermined time (e.g., 15-30 minutes).
- Secondary Wash: Briefly rinse the slide by transferring it to a second Coplin jar containing a less stringent, room-temperature buffer (e.g., 1x PBS or a low-salt 2x SSC buffer) for 1-2 minutes. This step removes residual stringency buffer and SDS.
- Drying: Gently blot excess liquid from the edges of the slide onto a paper towel. Air-dry the slide in the dark for ~5 minutes. Proceed immediately to counterstaining (Stage 4) or store slides in the dark at -20°C.
Critical Controls: Always include a negative control (e.g., a NON-EUB probe or a sample without the target organism) processed identically to assess non-specific binding post-washes.
The Scientist's Toolkit: Key Research Reagent Solutions
Table 3: Essential Materials for Effective Stringency Washes
| Item / Reagent | Function & Importance | Key Considerations for Selection |
|---|---|---|
| Molecular Biology Grade Formamide | Primary denaturant for precise Tm control. | Use high-purity, deionized formamide to prevent ionic and pH artifacts. Aliquot and store at -20°C. |
| 20x or 5x SSC Buffer | Provides consistent ionic strength (Na⁺, Citrate). Standardized base for wash buffers. | Prefer commercial, nuclease-free solutions for reproducibility in quantitative studies. |
| SDS (10% Solution) | Ionic detergent to prevent probe re-binding and reduce hydrophobic adhesion to cells. | Filter through a 0.2 µm filter to remove particulates that can cause spotting background. |
| Temperature-Calibrated Water Bath | Provides the exact thermal energy required for differential denaturation. | Accuracy (±0.5°C) and stability are critical. Regular calibration with a NIST-traceable thermometer is mandatory. |
| Hybridization Oven with Rotisserie | Alternative to water baths; provides constant agitation for even washing in tube-based FISH (e.g., for flow-FISH). | Ensures uniform buffer exchange around the sample, improving wash consistency. |
| Fluorescence-Compatible Mounting Medium with DAPI | Applied after washing. DAPI counterstains all nucleic acids, allowing for total cell count and signal normalization. | Choose an anti-fade medium to preserve fluorophore intensity during microscopy. |
Visualizing the Role of Stringency Washes in the FISH Workflow
Diagram 1: FISH Protocol Thesis: Stage 3 in Context
Diagram 2: Thermodynamic Decision Logic of a Stringency Wash
Within the systematic workflow of Fluorescence In Situ Hybridization (FISH) for microbial identification, the post-hybridization steps are critical for data visualization and interpretation. Following stringent hybridization and washing (Stages 3 & 4), Stage 5—Counterstaining and Mounting—serves to provide spatial context, preserve the specimen, and facilitate high-resolution fluorescence microscopy. Proper execution of this stage directly impacts signal-to-noise ratio, photostability, and the accuracy of microbial identification in complex environmental or clinical samples.
Core Principles and Objectives
The primary objectives of this stage are twofold:
- Counterstaining: To apply a general nucleic acid stain that delineates all microbial and/or host cell nuclei, providing a fiduciary map against which specific FISH signals (from oligonucleotide probes) can be localized and enumerated.
- Mounting: To embed the sample in a medium that reduces photobleaching, provides optimal optical properties for microscopy, and physically secures the specimen under a coverslip.
Failure to optimize this stage can lead to obscured FISH signals, excessive background fluorescence, or rapid signal degradation during microscopy.
Detailed Methodology
A. Counterstaining with DAPI and Alternatives
DAPI (4',6-diamidino-2-phenylindole) remains the gold standard counterstain for microbial FISH due to its high affinity for AT-rich regions in dsDNA, low background, and compatibility with standard FITC, Cy3, and Cy5 filter sets.
Protocol: DAPI Counterstaining
- Reagent Preparation: Prepare a working solution of DAPI (e.g., 1 µg/mL to 10 µg/mL) in the appropriate buffer (e.g., PBS, nuclease-free water, or the mounting medium itself). Note: DAPI is a potential mutagen; handle with appropriate PPE.
- Application: After the final post-hybridization wash, gently drain excess wash buffer from the slide. Apply 20-50 µL of DAPI working solution to completely cover the sample area.
- Incubation: Incubate at room temperature for 5-10 minutes in the dark (e.g., in a covered slide box).
- Rinsing: Briefly rinse the slide with the same buffer used in the DAPI solution or with the mounting medium to remove excess, unbound stain. Gently blot edges.
Alternative Counterstains: For multiplex experiments where DAPI emission may bleed into other channels, or for specific applications, alternatives are available (see Table 1).
B. Mounting for Fluorescence Preservation
The choice of mounting medium is crucial for signal longevity. Most modern media contain antifading agents like p-phenylenediamine (PPD) or 1,4-diazabicyclo[2.2.2]octane (DABCO).
Protocol: Antifade Mounting
- Slide Preparation: After counterstaining and rinsing, carefully remove excess liquid from around the sample area. Do not let the sample dry completely.
- Medium Application: Apply 10-20 µL of an antifade mounting medium (e.g., Vectashield, ProLong, SlowFade) directly onto the sample.
- Coverslipping: Gently lower a clean, #1.5 thickness coverslip onto the medium, avoiding bubble formation. If necessary, gently press to spread the medium evenly.
- Sealing: For long-term storage (>1 week), seal the edges of the coverslip with clear nail polish or a commercial sealant. Store slides flat at 4°C or -20°C in the dark.
Quantitative Data and Reagent Comparison
Table 1: Common Counterstains for Microbial FISH
| Counterstain | Target | Excitation/Emission Max (nm) | Common Concentration | Key Function & Notes |
|---|---|---|---|---|
| DAPI | dsDNA (AT-rich) | 358 / 461 | 1 - 10 µg/mL | General cell delineation. Standard, cost-effective. |
| SYTOX Green | dsDNA | 504 / 523 | 50 - 500 nM | Nucleic acid stain for permeabilized cells. Bright, less AT-selective. |
| Propidium Iodide (PI) | dsDNA/RNA | 535 / 617 | 0.5 - 5 µg/mL | stains all nucleic acids. Requires RNase for DNA specificity. |
| Hoechst 33342 | dsDNA (AT-rich) | 350 / 461 | 0.5 - 5 µg/mL | Live-cell permeable. Useful for viability assays combined with FISH. |
Table 2: Comparison of Commercial Antifade Mounting Media
| Mounting Medium | Key Component | Curing | Recommended Storage | Signal Longevity (Est.) |
|---|---|---|---|---|
| Vectashield | PPD-based | Non-curing | 4°C | Several months |
| ProLong Diamond | Patented polymer | Hardens (~24 hrs) | RT, post-cure | >1 year |
| SlowFade Glass | DABCO-based, no PPD | Non-curing | 4°C | Several weeks |
| Mowiol/DABCO | Glycerol, DABCO | Hardens slowly | 4°C | Weeks to months |
Experimental Workflow and Logical Pathway
Title: Stage 5 Counterstaining and Mounting Workflow
The Scientist's Toolkit: Essential Research Reagent Solutions
| Item | Function/Explanation |
|---|---|
| DAPI (Powder/Solution) | General DNA counterstain. Binds minor groove of AT-rich DNA. Stock solutions (e.g., 1 mg/mL in water) are stable at -20°C for years. |
| Antifade Mounting Medium | Preserves fluorescence by reducing photobleaching (via free radical scavenging). Provides correct refractive index (~1.518). |
| #1.5 Precision Coverslips | (0.17 mm thickness) Essential for optimal resolution with high-NA oil immersion objectives. |
| Microscope Slide Sealant | (e.g., clear nail polish, VALAP) Seals coverslip edges to prevent medium evaporation and sample oxidation. |
| Nuclease-Free Water/Buffer | Used for preparing stains and rinsing to prevent degradation of nucleic acid targets or probes. |
| Fluorescence-Compatible Slides | Slides with a charged or silanized surface to maximize adhesion of microbial cells through hybridization steps. |
Within the sequential thesis on Fluorescence In Situ Hybridization (FISH) for microbial identification, Stage 6 is critical for data acquisition and validation. The choice of imaging modality directly impacts resolution, signal-to-noise ratio (SNR), and the potential for three-dimensional analysis. This guide provides an in-depth technical comparison of epifluorescence and confocal microscopy, detailing their application in post-hybridization analysis of microbial communities.
Technical Principles & Comparison
Epifluorescence Microscopy (Widefield)
Epifluorescence microscopy illuminates the entire specimen with a specific wavelength of light, exciting all fluorophores within the illumination path. Emitted fluorescence is collected through the objective. While simple and fast, it suffers from out-of-focus blur, as fluorescence from above and below the focal plane contributes to the image, reducing contrast.
Confocal Laser Scanning Microscopy (CLSM)
Confocal microscopy uses a point source of laser light and a pinhole aperture in front of the detector to eliminate out-of-focus light. By scanning the specimen point-by-point, it constructs high-contrast images with superior axial resolution, enabling optical sectioning and 3D reconstruction.
Quantitative Comparison
The following table summarizes the key technical and performance differences relevant to FISH-based microbial studies.
Table 1: Core Comparison of Epifluorescence and Confocal Microscopy
| Parameter | Epifluorescence (Widefield) | Confocal (Laser Scanning) |
|---|---|---|
| Illumination | Full field (mercury/xenon arc lamp or LED) | Point scanning (lasers) |
| Out-of-Focus Light | Collected, reduces contrast | Rejected by pinhole |
| Axial (Z) Resolution | ~0.8 - 1.5 µm | ~0.5 - 0.7 µm |
| Lateral (XY) Resolution | ~0.2 - 0.3 µm | ~0.15 - 0.2 µm |
| Image Acquisition Speed | Fast (full frame) | Slower (serial point scanning) |
| Photobleaching & Phototoxicity | Moderate (whole sample illuminated) | Higher (intense point illumination) |
| Optical Sectioning | No | Yes (3D reconstruction possible) |
| Signal-to-Noise Ratio (SNR) | Lower (due to out-of-focus blur) | Higher |
| Typical Cost | Lower | Substantially Higher |
| Best For (FISH Context) | Rapid enumeration of sparse or surface-attached cells, routine checks. | Dense, thick samples (biofilms), 3D spatial mapping, co-localization studies. |
Table 2: Impact on FISH Protocol Outcomes
| FISH Analysis Goal | Recommended Modality | Rationale |
|---|---|---|
| Quantitative cell counting in filtered samples | Epifluorescence | Speed and simplicity are paramount for high-throughput counts. |
| Mapping microbial architecture in a biofilm | Confocal | Optical sectioning is required to resolve individual cells in 3D space. |
| Co-localization of multiple taxonomic probes | Confocal | Superior Z-resolution prevents false co-localization from overlapping signals. |
| Viability assessment (e.g., with viability FISH) | Epifluorescence | Minimizes light stress during rapid assessment of large populations. |
| Detection of low-abundance target cells | Confocal | Higher SNR can improve detection sensitivity in complex backgrounds. |
Detailed Imaging Protocols for FISH Samples
Protocol 1: Epifluorescence Imaging for Microbial Enumeration
This protocol is designed for quantifying hybridized cells on membrane filters or glass slides.
Materials: Hybridized sample on filter/slide, immersion oil, microscope slides/coverslips, antifade mounting medium.
Procedure:
- Mounting: If using a filter, place it on a glass slide with a drop of appropriate antifade mounting medium (e.g., Citifluor, Vectashield). Gently place a coverslip, avoiding bubbles. For slides, apply antifade and add a coverslip.
- Microscope Setup: Power on the mercury arc lamp or LED light source. Allow 15-30 minutes for lamp stabilization.
- Filter Cube Selection: Choose the filter cube matching your fluorophore (e.g., DAPI, FITC, Cy3, Cy5). Standard filter sets: DAPI (Ex: 350/50, Em: 460/50), FITC (Ex: 480/40, Em: 535/50), Cy3 (Ex: 545/30, Em: 610/75).
- Image Capture: Using a 60x or 100x oil immersion objective (NA ≥1.4), bring the sample into focus. For enumeration, capture 10-20 random fields of view. Use a CCD or sCMOS camera. Keep exposure times consistent (typically 100-800 ms) to allow comparison.
- Analysis: Use image analysis software (e.g., ImageJ, CellProfiler) to apply consistent thresholding and particle counting algorithms.
Protocol 2: Confocal Imaging for 3D Biofilm Analysis
This protocol is for acquiring Z-stacks of complex, thick FISH samples like biofilms.
Materials: Hybridized sample, #1.5 high-performance coverslip (0.17 mm thick), objective-appropriate immersion oil, antifade mounting medium.
Procedure:
- Sample Preparation: Mount the sample firmly using a spacer (e.g., Secure-Seal imaging spacer) to avoid compression. Use an antifade reagent to minimize bleaching during scanning.
- Microscope Initialization: Turn on lasers, computer, and detectors (typically photomultiplier tubes - PMTs). Allow lasers to warm up for 10-15 minutes.
- Parameter Optimization:
- Pinhole Diameter: Set to 1 Airy Unit (AU) for optimal balance of sectioning and signal intensity.
- Z-Stack Definition: Set the top and bottom of the region of interest. Use a step size (Z-interval) of 0.2 - 0.3 µm, which is ~½ the axial resolution, to satisfy the Nyquist sampling criterion.
- Scanning Mode: Use sequential line scanning for multi-color FISH to prevent bleed-through. Set scan speed (e.g., 400 Hz) and frame averaging (2-4x) to improve SNR.
- Spectral Detection: Set detection windows precisely to match the emission spectra of your fluorophores (e.g., Cy5: 660-720 nm; Cy3: 560-620 nm; FITC: 500-550 nm).
- Image Acquisition: Acquire the Z-stack. Ensure laser power is minimized to reduce photobleaching.
- Post-Processing: Use confocal manufacturer software or open-source tools (e.g., FIJI/ImageJ with Bio-Formats) for 3D rendering, volume calculation, and co-localization analysis.
The Scientist's Toolkit: Key Reagents & Materials
Table 3: Essential Research Reagent Solutions for FISH Imaging
| Item | Function in FISH Imaging | Example Products/Formulations |
|---|---|---|
| Antifade Mounting Medium | Slows photobleaching by reducing oxidation; critical for preserving signal during imaging. | Citifluor, Vectashield with DAPI, ProLong Diamond, SlowFade. |
| High-Resolution Immersion Oil | Matches the refractive index of glass objectives to maximize NA and light collection. | Type F or Type LDF (Low Autofluorescence) immersion oils. |
| #1.5 High-Performance Coverslips | Optimal thickness (0.17 mm) for high-NA objectives; low autofluorescence is essential. | Schott Nexterion, Marienfeld Superior, Corning Microcover. |
| Microscope Slide Adhesives/Spacers | Secures sample and creates a chamber for mounting medium, preventing crush artifacts. | Secure-Seal Spacers, GeneFrames, nail polish. |
| Immersion Oil Cleaner | Removes oil from objectives and sample without damaging lenses or coatings. | Lens cleaning solution and lint-free wipes. |
| Multi-Fluorophore Calibration Slides | Validates and aligns detection channels for accurate co-localization in confocal microscopy. | TetraSpeck microspheres, FocalCheck slides. |
Visualization of Workflow & Logical Relationships
Diagram Title: FISH Imaging Modality Decision & Workflow Logic
Diagram Title: Epifluorescence Microscope Optical Path
Diagram Title: Confocal Microscope Optical Sectioning Principle
Selecting between epifluorescence and confocal microscopy for Stage 6 of the FISH protocol is a strategic decision based on sample complexity and analytical goals. Epifluorescence offers speed and simplicity for quantitative enumeration, while confocal microscopy provides the optical sectioning and high SNR necessary for resolving the three-dimensional architecture of complex microbiomes. Proper execution of the associated protocols and use of specialized reagents are essential for generating reliable, publication-quality data in microbial identification and drug development research.
Fluorescence in situ hybridization (FISH) remains a cornerstone technique for the spatial identification and quantification of microorganisms within complex samples. This whitepaper provides a technical deep dive into its application for three critical areas: structured oral biofilms, heterogeneous gut microbiota, and clinical pathogen detection. The content is framed within the overarching thesis that a meticulously optimized, multi-step FISH protocol—encompassing probe design, sample fixation, hybridization, and imaging—is fundamental to achieving high specificity, sensitivity, and reproducibility in modern microbial ecology and diagnostics research.
Table 1: Common FISH Probes and Targets in Featured Applications
| Probe Name (Example) | Target Sequence (16S/23S rRNA) | Primary Application | Typical Reported Detection Sensitivity* |
|---|---|---|---|
| EUB338 (Mix I, II, III) | Most Bacteria | General community structure (Gut, Oral) | >75% of known bacteria |
| NON338 | Antisense to EUB338 | Negative control | N/A |
| ALF968, BET42a, GAM42a | Alpha-, Beta-, Gamma-proteobacteria | Gut microbiota profiling | Group-dependent |
| SRB385 | Sulfate-reducing bacteria | Oral biofilm / dysbiosis studies | Species-complex dependent |
| HGC69A | Actinobacteria (high GC) | Oral plaque & gut (e.g., Bifidobacteria) | Group-dependent |
| ENT183 | Enterobacteriaceae | Pathogen detection in infections | ~10³ cells/mL in clinical samples |
| STAPHY | Staphylococcus spp. | Pathogen detection in infections | Single-cell level in biofilms |
*Sensitivity is highly dependent on protocol optimization, sample type, and rRNA content of target cells.
Table 2: Key Protocol Variable Ranges by Sample Type
| Protocol Step | Oral Biofilm | Gut Microbiota (Fecal) | Clinical Pathogen (Sputum/Blood) |
|---|---|---|---|
| Fixation | 4% PFA, 2-4h, 4°C | 4% PFA, 3-5h, 4°C | 4% PFA, 1-2h OR ethanol fixation |
| Permeabilization | Lysozyme (10 mg/mL, 37°C, 60 min) often required | Lysozyme (5-10 mg/mL, 37°C, 30-60 min) | Lysozyme and/or proteinase K based on gram-stain |
| Hybridization Temp | 46°C ± 4°C | 46°C ± 4°C | 50°C ± 4°C (for increased stringency) |
| Formamide in Buffer | 20-40% (v/v) | 30-35% (v/v) | 35-60% (v/v) (probe-dependent) |
| Hybridization Time | 1.5 - 3 hours | 2 - 4 hours | 1.5 - 2 hours |
Detailed Experimental Protocols
Core FISH Protocol for Microbial Identification
A. Sample Preparation & Fixation
- Oral Biofilm: Collect using curette or sterile paper point. Suspend in 1x PBS. Vortex gently. Fix with 4% paraformaldehyde (PFA) (v/v) at 4°C for 2-4 hours.
- Gut Microbiota: Homogenize ~100 mg fecal sample in 1x PBS. Filter through 100µm mesh. Centrifuge (1000 x g, 5 min). Resuspend pellet in 4% PFA at 4°C for 3-5 hours.
- Clinical Pathogens (e.g., Sputum): Liquefy sample with dithiothreitol (DTT). Dilute in PBS, centrifuge. Fix pellet with 4% PFA (1-2h) or 50% ethanol (15 min, RT) for faster processing. For all: After fixation, pellet cells, wash 2x with 1x PBS, and store in 1:1 PBS:ethanol at -20°C.
B. Permeabilization (Critical for Gram-positive cells)
- Spot fixed sample onto charged microscope slides, air dry.
- Dehydrate in 50%, 80%, 96% ethanol series (3 min each).
- Apply permeabilization agent (e.g., Lysozyme solution: 10 mg/mL in 0.05 M EDTA, 0.1 M Tris-HCl, pH 8.0). Incubate at 37°C for 30-60 min in a humid chamber.
- Rinse slide thoroughly with nuclease-free water. Dehydrate again through ethanol series.
C. Hybridization
- Prepare Hybridization Buffer: 0.9 M NaCl, 20 mM Tris-HCl (pH 7.2), 0.01% SDS, and a defined concentration of formamide (see Table 2). Pre-warm buffer to hybridization temperature.
- Probe Mixture: Add fluorescently labeled oligonucleotide probe (final conc. 2-10 ng/µL) to hybridization buffer.
- Apply 20-50 µL of probe/buffer mix to sample area, cover with a coverslip.
- Incubate in a pre-heated, dark, humidified hybridization oven at precise temperature (e.g., 46°C) for 1.5-4 hours.
D. Stringency Wash & Imaging
- Remove coverslip gently by rinsing with pre-warmed Wash Buffer (varies with formamide concentration; e.g., 20 mM Tris-HCl, 5 mM EDTA, 0.01% SDS, 80-900 mM NaCl).
- Incubate slide in wash buffer at hybridization temperature for 15-20 min.
- Rinse briefly with ice-cold dH₂O, air dry in dark.
- Mount with antifading mounting medium containing DAPI (1 µg/mL).
- Image using epifluorescence or confocal microscopy with appropriate filter sets.
Visualizations
Diagram 1: Core FISH Protocol Workflow
Diagram 2: FISH Probe Specificity & Signal Generation Logic
The Scientist's Toolkit: Research Reagent Solutions
Table 3: Essential Materials for FISH Experiments
| Item | Function & Rationale |
|---|---|
| Fluorescent Oligonucleotide Probes (e.g., Cy3, FITC, Cy5-labeled) | Binds specifically to target rRNA sequences; fluorophore choice depends on microscope filters and multiplexing needs. |
| Paraformaldehyde (PFA), 4% Solution | Cross-linking fixative that preserves cellular morphology and immobilizes nucleic acids while maintaining probe accessibility. |
| Formamide (Molecular Biology Grade) | Denaturant used in hybridization buffer; its concentration critically determines stringency and must be optimized per probe. |
| Lysozyme (from chicken egg white) | Enzyme that digests peptidoglycan in cell walls, crucial for permeabilizing Gram-positive bacteria to allow probe entry. |
| Stringent Wash Buffer Salts (NaCl, Tris, EDTA, SDS) | Removes non-specifically bound probe; NaCl concentration is precisely calculated based on formamide % to maintain stringency. |
| Antifade Mounting Medium with DAPI | Preserves fluorescence and reduces photobleaching; DAPI stains all DNA, allowing total cell counting and spatial context. |
| Hybridization Oven/Chamber | Provides precise, consistent temperature control and a humidified environment to prevent buffer evaporation during hybridization. |
| Confocal/Epifluorescence Microscope | Equipped with appropriate filter sets for chosen fluorophores and DAPI; confocal is preferred for thick biofilm samples. |
Solving Common FISH Problems: Signal, Background, and Protocol Optimization
Weak or absent fluorescent in situ hybridization (FISH) signals represent a critical failure point in microbial identification research, directly impacting data reliability and project timelines. Within the broader thesis on optimizing FISH protocols for robust microbial identification, this guide systematically addresses the causes and solutions for signal deficiencies, providing researchers and drug development professionals with actionable, technical remediation strategies.
Primary Causes and Corresponding Fixes
The failure of FISH signal generation is multifactorial, originating from issues in probe design, sample integrity, hybridization efficiency, and detection. The following table categorizes the primary causes and their evidence-based fixes.
Table 1: Quantitative Summary of Signal Issues, Causes, and Effective Fixes
| Problem Category | Specific Cause | Evidence/Quantitative Impact | Recommended Fix (with Protocol Detail) |
|---|---|---|---|
| Probe & Labeling | Low labeling efficiency (dye molecules/probe) | < 4 dyes/probe yields weak signal; optimal is 6-10. | Use HPLC or gel filtration purification post-labeling. Validate with spectrophotometry (A260, A492 for FITC, etc.). |
| Poor probe permeability | >50% signal loss in Gram-positive vs. Gram-negative cells. | Add lysozyme (10 mg/mL, 37°C, 15 min) or proteinase K (1 µg/mL) pretreatment step. | |
| Sample Integrity | Low cellular ribosome content | Dormant cells: rRNA copies can be <10³/cell vs. ~10⁵ in active cells. | Use metabolic activators (e.g., nutrients) pre-fixation or switch to signal-amplifying techniques (CARD-FISH). |
| Over-fixation | Signal decreases >70% with >4 hr formaldehyde fixation. | Optimize fixation: 3% formaldehyde, 1-3 hours at 4°C, then ethanol dehydration. | |
| Hybridization | Suboptimal stringency | 5% mismatch can reduce hybridization efficiency by 30-60%. | Adjust formamide concentration in hybridization buffer (e.g., 0-50% v/v) or salt (NaCl) to fine-tune Tm. Calculate via: Tm = 81.5 + 16.6(logM) + 0.41(%GC) – 0.72(%F) – 600/L where M=[Na+], F=formamide %, L=probe length. |
| Inadequate permeabilization | No signal in >90% of target cells. | For tough cell walls, optimize with different enzymes (lysozyme, achromopeptidase) and vary incubation time/temp. | |
| Detection & Imaging | Photobleaching | Signal half-life can be <10 sec under intense illumination. | Use antifade mounting media (e.g., Vectashield with DAPI). Reduce exposure time; use high-sensitivity cameras (EMCCD/sCMOS). |
| Inappropriate filter sets | Bleed-through or >80% signal loss if bandwidth mismatch. | Match filter sets to fluorophore: Check excitation/emission spectra. Use multiband filters for multiplex FISH. |
Detailed Experimental Protocols for Key Fixes
Protocol 1: Lysozyme Pretreatment for Gram-Positive Bacteria
- After standard fixation and spotting onto slides, air-dry samples.
- Apply 100 µL of lysozyme solution (10 mg/mL in 0.1M Tris-HCl, 0.05M EDTA, pH 8.0) to the sample area.
- Incubate at 37°C for 15-30 minutes in a humidified chamber.
- Rinse gently with distilled water and dehydrate through an ethanol series (50%, 80%, 96%; 3 min each).
- Air-dry completely before proceeding with standard hybridization.
Protocol 2: Formamide Stringency Optimization
- Prepare a series of hybridization buffers with formamide concentrations varying in 10% increments (e.g., 0%, 10%, 20%, 30%, 40%).
- Hybridize identical samples from a pure culture with a known specific probe using each buffer.
- Perform standard washing and imaging under identical conditions.
- Quantify mean fluorescence intensity per cell. The optimal formamide concentration provides the highest specific signal with the lowest background.
- Use this optimized concentration for subsequent experiments with that specific probe-target pair.
Visualizing the Troubleshooting Workflow
The logical pathway for diagnosing and resolving weak FISH signals is presented in the following decision-tree diagram.
Diagram Title: FISH Signal Failure Diagnosis Decision Tree
The Scientist's Toolkit: Key Research Reagent Solutions
Table 2: Essential Materials for Troubleshooting FISH Signals
| Reagent/Material | Function & Role in Troubleshooting |
|---|---|
| High-Purity Formamide | Primary agent for controlling hybridization stringency. Critical for reducing non-specific binding and optimizing signal-to-noise ratio. |
| Lysozyme (from chicken egg white) | Enzymatic permeabilization agent essential for degrading peptidoglycan in Gram-positive bacterial cell walls, allowing probe entry. |
| Protease (e.g., Proteinase K) | Digests proteins in cell membranes/hybridization barriers, used for tough samples or tissue-embedded microbes. |
| Antifade Mounting Medium (e.g., with DAPI) | Preserves fluorophore signal during microscopy by reducing photobleaching. Often contains DAPI for universal nucleic acid counterstaining. |
| HPLC-Purified FISH Probe | Ensures high labeling efficiency and removes unincorporated dyes, which are a primary cause of high background and weak specific signal. |
| Stringency Wash Buffer (SSC-based) | Saline-sodium citrate buffer used post-hybridization to wash away mismatched or weakly bound probes under defined temperature conditions. |
| Ethanol Series (50%, 80%, 96%) | Used for dehydration of fixed samples on slides prior to hybridization, critical for maintaining cell morphology and adhesion. |
| Positive Control Probe (e.g., EUB338) | Universal bacterial probe used to validate entire protocol. Failure indicates a systemic issue, not probe-specific. |
| Negative Control Probe (e.g., NON338) | Non-sense probe used to establish and quantify levels of non-specific binding and background fluorescence. |
Reducing High Background Fluorescence and Non-Specific Binding
Thesis Context: As part of a comprehensive thesis on optimizing Fluorescence In Situ Hybridization (FISH) protocols for precise microbial identification in complex samples, this guide addresses the critical challenge of signal-to-noise ratio. High background and non-specific binding compromise the accuracy and sensitivity of FISH, leading to false positives and obscured target signals. Effective mitigation is paramount for reliable research and drug development applications.
Background fluorescence in FISH arises from multiple sources:
- Autofluorescence: Intrinsic fluorescence of sample components (e.g., microbial cell walls, organics, substrate materials).
- Non-Specific Probe Binding: Hybridization of probes to non-target nucleic acid sequences with partial complementarity.
- Hydrophobic Adsorption: Non-ionic binding of fluorescently labeled probes to cellular or surface components.
- Incomplete Wash Stringency: Residual unbound or weakly bound probes post-hybridization.
Quantitative Impact of Common Mitigation Strategies
The following table summarizes the efficacy of various approaches, as reported in recent literature.
Table 1: Efficacy of Background Reduction Strategies in Microbial FISH
| Strategy Category | Specific Method | Typical Reduction in Background Fluorescence | Key Consideration / Trade-off |
|---|---|---|---|
| Sample Pre-treatment | Hydrogen Peroxide (H₂O₂) treatment | 40-60% | Can damage fragile cell morphology. |
| Sudan Black B staining | 50-70% | Quenches autofluorescence; may require extra wash steps. | |
| Enzymatic digestion (Lysozyme, Proteinase K) | 30-50% | Enhances probe penetration but can lyse cells if overdone. | |
| Probe Design & Chemistry | Use of Nucleic Acid Analogues (e.g., LNA) | 20-40% | Increases specificity and Tm, allowing higher stringency. |
| Increased probe length & specificity check | 25-45% | Requires careful in silico design against genomic databases. | |
| Hybridization & Wash Optimization | Increased Formamide concentration | 35-55% | Lowers effective Tm, enabling more stringent washes. |
| Increased Wash Temperature (above calculated Tm) | 40-65% | Most effective method; risk of stripping target signal if excessive. | |
| Use of Blocking Agents (e.g., competitor DNA) | 20-35% | Competes for non-specific binding sites. | |
| Chemical Quenching | Post-hybridization rinses with NaCl-Ethanol | 30-50% | Reduces hydrophobic adsorption effectively. |
Detailed Experimental Protocols
Protocol 1: Combined Chemical Quenching for Environmental Samples
This method effectively reduces autofluorescence from soil or sediment matrices.
Materials:
- Sample on glass slide (fixed and permeabilized)
- Sudan Black B working solution (0.1% in 70% ethanol)
- Sodium borohydride (NaBH₄) solution (1 mg/mL in PBS)
- Phosphate-Buffered Saline (PBS)
- Moist hybridization chamber.
Methodology:
- After sample fixation and permeabilization, immerse the slide in Sudan Black B solution for 10 minutes in the dark.
- Rinse gently with 70% ethanol, then twice with PBS.
- Incubate the slide in NaBH₄ solution for 10 minutes. This step reduces aldehyde-induced fluorescence from fixation.
- Wash thoroughly with PBS (3 x 2 minutes).
- Proceed immediately to standard FISH hybridization protocol.
Protocol 2: Stringent Wash Optimization Using Formamide
A core protocol for eliminating non-specific probe binding.
Materials:
- Pre-hybridized slide (post-incubation).
- Stringent Wash Buffer: Pre-warmed to desired temperature. Composition: XX mM NaCl, XX mM Tris-HCl (pH 8.0), 0.1% SDS. The NaCl concentration is calculated based on the formamide concentration used in hybridization ([NaCl] = 0.147M - 0.0076M × %formamide).
- Water bath or thermal cycler with slide adapter, pre-heated to target wash temperature (e.g., 48-62°C).
Methodology:
- Prepare Wash Buffer and pre-warm the required volume (typically 50-100 mL per slide) in a Coplin jar within the water bath. Allow 30 min for temperature equilibration.
- Immediately after hybridization, remove the coverslip by immersing the slide in room-temperature Wash Buffer.
- Transfer the slide to the pre-warmed stringent Wash Buffer. Incubate for 15-20 minutes.
- Briefly rinse the slide in a second jar containing ice-cold Wash Buffer for a few seconds to halt the stringent process.
- Rinse with Milli-Q water, air dry in the dark, and mount for microscopy.
- Critical: The wash temperature should be empirically optimized for each probe, starting 2-3°C below its calculated dissociation temperature (Td).
Visualizing the Optimization Workflow
FISH Background Reduction Optimization Workflow
The Scientist's Toolkit: Key Reagent Solutions
Table 2: Essential Reagents for Reducing FISH Background
| Reagent / Material | Function in Noise Reduction | Typical Concentration / Note |
|---|---|---|
| Formamide | Denaturant that lowers melting temperature (Tm), enabling higher stringency washes without probe detachment. | 0-50% in hybridization buffer. Concentration is probe-specific. |
| Sodium Dodecyl Sulfate (SDS) | Ionic detergent that reduces hydrophobic adsorption of probes to cells and surfaces. | 0.01-0.1% in wash buffers. |
| Sudan Black B | A lipophilic dye that binds to and quenches autofluorescent lipids in cell membranes. | 0.1% in 70% ethanol. |
| Competitor DNA | Unlabeled nucleic acids (e.g., salmon sperm DNA) that block non-specific probe binding sites. | 1-10 µg/mL in hybridization buffer. |
| Blocking Reagents | Proteins like Bovine Serum Albumin (BSA) or skim milk that coat non-specific protein binding sites. | 1-3% in pre-hybridization or wash buffers. |
| Dextran Sulfate | Crowding agent that increases effective probe concentration, allowing faster hybridization. | 10% in hybridization buffer. Reduces required hybridization time. |
| NaBH₄ (Sodium Borohydride) | Reduces aldehyde groups from fixatives (like paraformaldehyde) that cause autofluorescence. | 1 mg/mL in PBS or 100mM glycine buffer. |
| TWEEN 20 | Non-ionic surfactant that minimizes non-specific adsorption in wash steps. | 0.05-0.1% in wash buffers. |
Optimizing Permeabilization and Hybridization for Difficult Samples
Within the broader thesis on FISH protocol steps for microbial identification research, optimizing permeabilization and hybridization is critical for challenging samples. Difficult samples—such as those with thick cell walls (e.g., Gram-positive bacteria, spores, biofilms), complex matrices (e.g., soil, feces, tissue), or low-ribosomal-content cells—routinely cause high background, low signal intensity, and false negatives. This guide details technical strategies to overcome these barriers, ensuring reliable fluorescence in situ hybridization (FISH) results for research and drug development.
The Permeabilization Challenge: Mechanisms and Quantitative Analysis
Permeabilization must compromise the cellular envelope to allow probe entry without destroying cell morphology or target accessibility. Efficacy varies dramatically by sample type.
Table 1: Quantitative Efficacy of Common Permeabilization Agents on Difficult Microbial Samples
| Permeabilization Agent | Concentration Range | Incubation Time & Temp. | Target Sample Type | Reported Efficiency Increase (vs. Standard Protocol) | Key Trade-off / Risk |
|---|---|---|---|---|---|
| Lysozyme | 1-10 mg/mL | 15-60 min, 37°C | Gram-positive bacteria | 40-60% signal increase for Firmicutes | Over-digestion can lyse cells |
| Mutanolysin | 100-500 U/mL | 30-120 min, 37°C | Gram-positive bacteria with complex peptidoglycan | Up to 70% increase for Actinobacteria | Expensive; activity buffer-specific |
| Proteinase K | 0.1-1 µg/mL | 5-15 min, 20-25°C | Biofilms, fixed tissue-embedded cells | Can double detection rates in thick biofilms | Critical concentration window; destroys proteins |
| SDS (Sodium Dodecyl Sulfate) | 0.01-0.1% (w/v) | 5-15 min, 20-25°C | Mycolic-acid-containing bacteria (e.g., Mycobacteria) | Essential for detection; 80%+ failure without it | Can cause cell distortion at >0.1% |
| Ethanol (with HCl) | 50-80% (v/v) with 0.1M HCl | 10-30 min, 20-25°C | Environmental samples, spores | Improves permeabilization of dormant cells by 50% | Can increase autofluorescence |
Hybridization Optimization: Key Parameters
Hybridization stringency, controlled by formamide concentration and temperature, must be precisely tuned for difficult samples to maximize probe binding and minimize non-specific attachment.
Table 2: Optimization of Hybridization Conditions for High-Background Samples
| Parameter | Standard Range | Optimization for Difficult Samples | Rationale & Impact |
|---|---|---|---|
| Formamide Concentration | 0-50% (v/v) in buffer | Increase incrementally (35-60%) for high-G+C targets or complex matrices | Increases stringency, reduces non-specific binding to debris or non-target cells. |
| Hybridization Temperature | 46°C (standard) | Gradient testing recommended (35-50°C) | Too high: signal loss; Too low: high background. Optimal temp is probe-specific. |
| Hybridization Time | 1.5-3 hours | Extend to 4-8 hours (or overnight) for low-activity cells | Increases probe diffusion and target access in hard-to-penetrate cells. |
| NaCl Concentration | Varies with formamide | Decrease [NaCl] to increase stringency concomitantly with formamide | Fine-tunes dissociation temperature; critical for matching probe Tm. |
| Denaturant/Competitors | Not always used | Add unlabeled oligonucleotide competitors (e.g., PNA) | Blocks non-specific binding sites in complex samples (e.g., humic substances). |
Detailed Experimental Protocols
Protocol A: Sequential Permeabilization for Gram-Positive Bacteria and Biofilms
This method combines enzymatic and chemical treatments for robust cell wall disruption.
Materials: Phosphate-buffered saline (PBS, pH 7.4), 4% paraformaldehyde (PFA) fixative, Lysozyme solution (10 mg/mL in 10mM Tris-HCl, 5mM EDTA, pH 8.0), Proteinase K working solution (0.5 µg/mL in PBS), Hybridization buffer (0.9 M NaCl, 20 mM Tris-HCl, 0.01% SDS, % formamide as required), Ethanol series (50%, 80%, 96%).
Method:
- Fixation: Fix sample in 4% PFA for 2-4 hours at 4°C. Wash 2x with PBS.
- Enzymatic Permeabilization: Resuspend pellet in Lysozyme solution. Incubate for 30 minutes at 37°C. Centrifuge gently (5000 x g, 5 min), wash with PBS.
- Chemical Permeabilization: Resuspend in Proteinase K working solution. Incubate for 10 minutes at room temperature. Immediately centrifuge and wash with PBS.
- Dehydration: Subject sample to an ethanol series (50%, 80%, 96%) for 3 minutes each. Air dry.
- Proceed to Hybridization (see Protocol C).
Protocol B: Hybridization with Enhanced Stringency for Environmental Samples
Designed to reduce background in samples with high non-specific fluorescence.
Materials: Hybridization buffer (see Protocol A), Wash buffer (varying NaCl concentration based on formamide used), Probe solution (50 ng/µL FISH probe in hybridization buffer), DAPI counterstain (1 µg/mL).
Method:
- Buffer Preparation: Prepare hybridization buffer with formamide concentration optimized for the probe's Tm (typically 35-60%). Prepare a corresponding wash buffer with NaCl concentration adjusted for equivalent stringency.
- Hybridization: Apply 20-50 µL of probe solution to dried sample. Incubate in a pre-heated, humidified chamber at 46°C for 4 hours (or overnight at 37°C for sensitive cells).
- Stringent Wash: Remove coverslip and immediately immerse slide in pre-warmed wash buffer (48°C) for 15-20 minutes.
- Rinsing & Counterstaining: Rinse briefly with ice-cold distilled water. Air dry in dark. Apply DAPI stain for 5 min, rinse, air dry, and mount with anti-fade mounting medium.
Visualization of Protocols and Pathways
Title: Workflow for Optimized FISH on Difficult Samples
Title: Hybridization Stringency Parameter Relationships
The Scientist's Toolkit: Key Research Reagent Solutions
Table 3: Essential Materials for Optimized Permeabilization and Hybridization
| Item / Reagent | Function in Protocol | Key Consideration for Difficult Samples |
|---|---|---|
| Lysozyme (from chicken egg white) | Hydrolyzes β-1,4-glycosidic bonds in peptidoglycan. | Must be prepared fresh; EDTA in buffer chelates cations, weakening cell wall. |
| Mutanolysin (from Streptomyces globisporus) | Cleaves the β-1,4 bond between N-acetylmuramic acid and N-acetylglucosamine. | Specific for certain Gram-positive groups; effective against Actinobacteria. |
| Proteinase K (recombinant, PCR grade) | Broad-spectrum serine protease digests proteins in extracellular matrices. | Concentration is critical; over-digestion destroys cell integrity. |
| Formamide (Molecular Biology Grade, >99.5%) | Denaturant in hybridization buffer; lowers probe Tm for lower temp hybridization. | Purity is essential to prevent fluorescent artifacts. Store aliquots. |
| CARD-FISH Kit (with HRP-labeled probes and Tyramide) | Signal amplification for low-ribosomal-content cells. | Requires careful optimization of permeabilization to allow HRP entry. |
| PNA (Peptide Nucleic Acid) FISH Probes | Uncharged backbone provides higher affinity and faster hybridization. | Excellent for penetrating difficult cell walls; resistant to nucleases. |
| Humic Acid Competitor (e.g., unlabeled DNA) | Blocks non-specific probe binding to organic matter in environmental samples. | Reduces background significantly in soil and sediment FISH. |
| SlowFade or ProLong Antifade Mountant | Preserves fluorescence signal during microscopy. | Critical for weak signals; prevents photobleaching during prolonged imaging. |
Managing Autofluorescence in Environmental and Clinical Specimens
Autofluorescence (AF) presents a significant challenge in fluorescence in situ hybridization (FISH) for microbial identification, obscuring specific signals and reducing the signal-to-noise ratio. This guide details current strategies to manage AF within the FISH workflow, ensuring accurate and reliable results in complex environmental and clinical samples.
Autofluorescence arises from the natural emission of light by endogenous biomolecules upon excitation by common fluorescence microscope lamps. Key sources relevant to microbial FISH include:
- NADH & Flavins (Flavoproteins): Primary contributors in metabolically active microbial cells.
- Lipofuscins: Found in aging eukaryotic cells within clinical specimens.
- Collagen & Elastin: Prevalent in tissue sections.
- Plant & Soil Matter: Lignin, humic acids, and other polymers in environmental samples.
Quantitative impact on FISH is summarized below:
Table 1: Common Autofluorescent Compounds and Their Spectral Properties
| Compound/Source | Primary Excitation (nm) | Primary Emission (nm) | Common Sample Type |
|---|---|---|---|
| NADH | ~340-360 | ~450-470 | All live cells, clinical tissues |
| FAD/Flavins | ~450-480 | ~500-550 | All live cells, clinical tissues |
| Lipofuscin | Broad: 340-500 | Broad: 500-700 | Aged tissues, eukaryotic cells |
| Collagen | ~270-370 | ~300-450 | Connective tissue, biofilms |
| Lignin/Humics | UV to ~500 | Broad: 400-600 | Environmental specimens (soil, water) |
| Chlorophyll | ~440, ~670 | ~650-750 | Environmental specimens (water, plants) |
Integrated Experimental Protocols for AF Reduction
AF management must be integrated into the FISH protocol. The following methodologies are critical.
Protocol 1: Chemical Reduction with Ammonium Ethanol and Borohydride
Principle: Selectively reduces Schiff-base double bonds in fluorophores. Procedure:
- After fixation and permeabilization of samples (e.g., tissue section, biofilm smear), wash with PBS.
- For ammonium ethanol treatment: Incubate specimen in 1% w/v ammonium chloride in 70% ethanol for 30-60 minutes at room temperature (RT), protected from light. Wash with PBS.
- For borohydride treatment (stronger): Prepare a fresh 1 mg/mL solution of sodium borohydride (NaBH4) in PBS. Incubate specimen for 10-30 minutes at 4°C. Wash thoroughly with PBS (3x 5 min).
- Proceed with standard FISH hybridization steps.
Protocol 2: Photobleaching
Principle: Uses high-intensity light to permanently bleach AF molecules prior to FISH. Procedure:
- Prepare and mount the specimen on a slide.
- Apply an anti-fading mounting medium (e.g., without DAPI).
- Place the slide on a widefield fluorescence microscope.
- Expose the entire sample area to broad-spectrum mercury or LED light (e.g., full UV/Vis spectrum) for 15-60 minutes. Time must be empirically determined to avoid destroying target.
- After bleaching, carefully remove coverslip, perform the FISH protocol, and then re-mount.
Protocol 3: Spectral Unmixing via Linear Unmixing
Principle: A computational method, requires capturing spectral signatures. Procedure:
- Characterize AF Signature: Image an unstained/unhybridized but otherwise identically prepared sample using a spectral confocal microscope or a microscope with tunable emission filters. Capture the full emission spectrum across your experimental wavelengths.
- Perform FISH: Hybridize your sample with fluorophore-conjugated probes.
- Capture Experimental Data: Image the hybridized sample, collecting a lambda stack (emission spectrum at each pixel).
- Software Unmixing: Use microscope software (e.g., Zeiss ZEN, Leica LAS X) to perform linear unmixing. Input the reference spectrum of the AF and each specific FISH fluorophore. The algorithm will mathematically separate the contributions at each pixel.
Protocol 4: Probe Design and Fluorophore Selection for AF Avoidance
Principle: Shift detection to spectral regions with lower inherent AF. Procedure:
- Measure Sample AF: Perform an initial AF scan of your sample type.
- Choose "AF-Quiet" Windows: Identify emission regions with minimal intrinsic AF (common windows: 600-750 nm, far-red).
- Select Probes: Design FISH probes conjugated to fluorophores emitting in these windows (e.g., Cy5, Cy5.5, Alexa Fluor 647, 750).
- Combine with Quenchers: For added specificity, use probes with internal quenchers (e.g., Black Hole Quenchers) that suppress reporter emission until hybridization occurs, further improving contrast.
Visualizing the Integrated Workflow
The following diagram illustrates the logical decision pathway for integrating AF management into a FISH protocol.
Diagram 1: Decision workflow for managing autofluorescence in FISH.
The Scientist's Toolkit: Key Research Reagent Solutions
Table 2: Essential Materials for Autofluorescence Management in FISH
| Item | Function & Role in AF Management |
|---|---|
| Sodium Borohydride (NaBH4) | Reduces autofluorescence from aldehyde fixation by breaking down Schiff bases. Critical for post-fixation treatment of tissues. |
| Ammonium Chloride/Ethanol | Milder chemical treatment for reducing general background fluorescence. |
| TrueBlack Lipofuscin Autofluorescence Quencher | Commercial reagent specifically formulated to quench lipofuscin and general AF in tissue sections. |
| Anti-fading Mounting Media (e.g., Vectashield, ProLong Diamond) | Preserves fluorescence signal from probes and retards photobleaching during imaging. Some contain AF reducers. |
| Spectral Confocal Microscope | Essential instrument for capturing lambda stacks required for spectral unmixing experiments. |
| Fluorophores in "AF-Quiet" Windows (e.g., Cy5, Alexa Fluor 647, 750) | Probes conjugated to far-red emitting dyes minimize overlap with common AF spectra (300-600 nm). |
| Black Hole Quencher (BHQ) | Used in dark probe designs; quenches reporter fluorophore emission until the probe hybridizes, improving target-specific contrast. |
| Formamide (in Hybridization Buffer) | Standard component of FISH buffer; its concentration can be optimized to increase stringency and reduce non-specific binding, lowering background. |
Fluorescence in situ hybridization (FISH) is a cornerstone technique for the direct visualization and identification of microorganisms in complex samples. The reliability of FISH is intrinsically linked to the stability and performance of its core components: nucleic acid probes and their conjugated fluorophores. This guide details best practices for maintaining probe and fluorophore integrity, framed within the critical steps of a microbial FISH protocol, to ensure reproducible, high-signal, low-background results essential for research and drug development.
Fundamental Stability Factors
The degradation of probes and fluorophores leads to diminished signal intensity, increased background, and false-negative results. Key destabilizing factors include:
- Light: Primary cause of fluorophore photobleaching.
- Temperature: Elevated temperatures accelerate hydrolysis and chemical degradation.
- Nucleases: DNase/RNase contamination degrades nucleic acid probes.
- pH: Extreme pH can hydrolyze probe bonds or alter fluorophore structure.
- Oxidation & Free Radicals: Degrade many organic dye molecules.
- Repeated Freeze-Thaw Cycles: Cause physical shearing and promote condensation.
Quantitative Stability Data of Common Fluorophores
The following table summarizes key stability metrics for fluorophores frequently used in microbial FISH assays.
Table 1: Stability Characteristics of Common FISH Fluorophores
| Fluorophore | Excitation (nm) | Emission (nm) | Relative Photostability | Primary Degradation Factor | Recommended Long-Term Storage |
|---|---|---|---|---|---|
| FITC | 495 | 519 | Low | pH (<6), Light, Oxidation | ≤ -20°C, lyophilized or in buffer (pH >8), dessicated |
| Cy3 | 550 | 570 | Moderate-High | Light, Oxidizing agents | ≤ -20°C, dry or in TE buffer (pH 8.0), avoid light |
| Cy5 | 649 | 670 | High | Light, Free radicals | ≤ -20°C, dry or in TE buffer (pH 8.0), aliquot, avoid light |
| ATTO 488 | 501 | 523 | Very High | Light | ≤ -20°C, dry or in neutral buffer |
| Texas Red | 589 | 615 | Moderate | Light, Moisture | ≤ -20°C, dry, dessicated |
| DAPI | 358 | 461 | Moderate | Light | 2-8°C in aqueous solution, ≤ -20°C for long-term |
Best Practices for Storage and Handling
A. Upon Receipt and Reconstitution
- Centrifuge: Briefly spin lyophilized probe vials before opening to collect contents.
- Reconstitution Buffer: Use nuclease-free TE buffer (10 mM Tris-HCl, 1 mM EDTA, pH 8.0) or manufacturer-recommended buffer. EDTA chelates Mg²⁺, inhibiting nucleases.
- Master Aliquot Strategy: Immediately upon reconstitution, aliquot the probe stock into single-use, low-adhesion microcentrifuge tubes to minimize freeze-thaw cycles and contact.
- Concentration: Prepare a concentrated stock (e.g., 100 µM).
B. Long-Term Storage Protocols
- Primary Storage: Store aliquots at ≤ -20°C or ≤ -80°C for extended storage (years). Ensure freezers are non-frost-free to prevent temperature cycling.
- Desiccation: Include desiccant beads in storage containers.
- Light Protection: Use amber tubes or wrap aliquots in aluminum foil.
- Working Solution: A diluted working solution (e.g., 50 ng/µL) can be stored at 4°C in the dark for up to 4 weeks if sterile and nuclease-free.
Experimental Protocol: Validating Probe/Fluorophore Integrity
This control experiment should be performed periodically on stored stocks, especially if assay performance declines.
Title: Protocol for Probe Integrity Assessment via Agarose Gel Electrophoresis
Methodology:
- Sample Preparation: Dilute 1 µL of stored probe solution (from test aliquot) with 9 µL of nuclease-free water. Include a freshly reconstituted probe aliquot as a positive control.
- Gel Preparation: Prepare a 3-4% high-resolution agarose gel (e.g., Metaphor) in 1x TBE buffer with an intercalating dye (e.g., SYBR Safe).
- Electrophoresis: Load 10 µL of each sample. Run at 5-8 V/cm for 60-90 minutes.
- Visualization: Image the gel using a UV transilluminator with the appropriate filter for the probe's fluorophore (e.g., Cy3 filter set). CAUTION: Do not use ethidium bromide if you plan to recover/hybridize the probe, as it can interfere.
- Analysis: A single, sharp band at the expected molecular weight indicates intact probe. Smearing or lower molecular weight bands indicate degradation. Diminished fluorescence intensity compared to the control suggests fluorophore decay.
FISH Workflow with Stability Control Points
Title: FISH Workflow with Critical Stability Control Points
The Scientist's Toolkit: Essential Research Reagent Solutions
Table 2: Key Reagents for Probe Stability and FISH Assays
| Item | Function & Rationale |
|---|---|
| Nuclease-Free Water | Reconstitution and dilution of probes to prevent enzymatic degradation. |
| TE Buffer (pH 8.0) | Standard reconstitution/storage buffer; Tris stabilizes pH, EDTA chelates divalent cations to inhibit nucleases. |
| Formamide (Molecular Biology Grade) | Used in hybridization buffer to lower melting temperature; must be high-purity to prevent chemical degradation of probes. |
| Saline-Sodium Citrate (SSC) Buffer | Provides ionic strength for stringency control during washing; pH stability is critical. |
| Antifading Mounting Medium (e.g., with p-phenylenediamine or commercial agents) | Preserves fluorescence signal during microscopy by reducing photobleaching. |
| Molecular Grade Albumin (BSA) or Skim Milk | Used as blocking agents in hybridization buffer to reduce non-specific probe binding. |
| Dessicant Beads (e.g., silica gel) | Maintain a low-humidity environment in storage containers. |
| Low-Adhesion/Non-Stick Microcentrifuge Tubes | Minimize probe loss due to adhesion to tube walls during pipetting. |
| Light-Tight/Amber Storage Tubes & Boxes | Provide physical protection from light-induced fluorophore decay. |
1. Introduction & Thesis Context
Within the comprehensive framework of a thesis on Fluorescence In Situ Hybridization (FISH) protocol steps for microbial identification research, achieving high sensitivity in complex environmental or host-associated samples remains a paramount challenge. Standard FISH, limited by the number of fluorophores per cell and autofluorescence, often fails to detect microbes with low ribosomal RNA content. This technical guide details the advanced integration of two powerful optimization strategies: Catalyzed Reporter Deposition FISH (CARD-FISH) for signal amplification and the strategic use of Helper Probes to increase target accessibility. Together, they form a critical methodological pillar for pushing the detection limits in microbial ecology, diagnostics, and drug development research.
2. Core Principles: Helper Probes & CARD-FISH
2.1 Helper Probes: These are unlabeled oligonucleotides designed to bind adjacent to the primary, labeled probe's target site on the 16S or 23S rRNA. They function by opening the complex secondary structure of the rRNA, thereby facilitating the binding of the primary detection probe and increasing the hybridization efficiency and signal intensity.
2.2 CARD-FISH (Tyramide Signal Amplification): This method replaces the direct fluorophore label on the oligonucleotide probe with an enzyme, typically horseradish peroxidase (HRP). After hybridization, multiple labeled tyramide substrates are activated by the HRP and deposited covalently at the site of hybridization, resulting in an immense amplification of the fluorescent signal per target molecule.
3. Experimental Protocols
3.1 Combined Helper Probe & CARD-FISH Protocol
- Step 1: Sample Fixation and Permeabilization. Fix cells (e.g., with 3% paraformaldehyde). For Gram-positive bacteria, additional lysozyme treatment (10 mg/mL, 37°C, 60 min) is critical. For CARD-FISH, endogenous peroxidases must be quenched (with 0.15% H2O2 in methanol, 30 min).
- Step 2: Hybridization. Prepare hybridization buffer (0.9 M NaCl, 20 mM Tris/HCl, 0.01% SDS, Formamide concentration optimized for probe stringency). Add the HRP-labeled primary probe and unlabeled helper probes (typical concentration: 2-5 ng/µL each). Hybridize at 46°C for 2-3 hours in a humid chamber.
- Step 3: Washing. Wash in pre-warmed buffer (based on hybridization buffer salinity) at 48°C for 10-15 minutes to remove unbound probes.
- Step 4: Signal Amplification. Incubate samples in amplification buffer (containing H2O2>) with fluorochrome-labeled tyramide (e.g., Alexa Fluor 488-tyramide) for 15-30 minutes at 46°C in the dark. The HRP catalyzes the deposition of multiple tyramide molecules.
- Step 5: Counterstaining and Microscopy. Counterstain with DAPI (for total cells) and mount slides. Analyze via epifluorescence or confocal microscopy.
3.2 Key Control Experiments
- Negative Control: Use a nonsense HRP-labeled probe (non-targeting) alongside the full helper probe set.
- Helper Probe Efficacy Test: Perform parallel hybridizations with and without helper probes using a standard fluorophore-labeled (not HRP) probe to quantify intensity gain.
- CARD Specificity Control: Perform amplification step without the HRP-probe to check for non-specific tyramide deposition.
4. Data Presentation: Quantitative Impact
Table 1: Comparative Signal Intensity and Detection Limit of FISH Methods
| Method | Avg. Fluorophores per Cell | Effective Detection Limit (rRNA copies/cell) | Typical Signal Gain vs. FISH | Key Limitation |
|---|---|---|---|---|
| Standard FISH | 1-5 (directly labeled) | > 103 | 1x (baseline) | Low signal, autofluorescence |
| FISH + Helpers | 3-10 | ~5 x 10² | 2-5x | Limited by fluorophore count |
| CARD-FISH | > 103 (tyramide deposits) | ~102 | 10-40x | Peroxide sensitivity, cell size inflation |
| CARD-FISH + Helpers | > 103 | < 102 | 20-100x | Complex protocol optimization |
Table 2: Essential Research Reagent Solutions (The Scientist's Toolkit)
| Item | Function in Protocol | Example/Note |
|---|---|---|
| HRP-Labeled Oligonucleotide Probe | Target-specific enzyme delivery for CARD. | Custom-synthesized, 5'- or 3'-labeled with horseradish peroxidase. |
| Unlabeled Helper Oligonucleotides | Increase rRNA target site accessibility. | 2-4 probes, ~15-20 nt, targeting sequences flanking primary probe site. |
| Fluorochrome-Labeled Tyramide | Amplifiable substrate for HRP. | e.g., Alexa Fluor 488-tyramide; stored as concentrated stock in DMSO. |
| Permeabilization Enzymes (Lysozyme, Proteinase K) | Enable probe entry, especially in Gram-positive cells. | Concentration and time are taxon-specific and require optimization. |
| Formamide | Denaturant used to control hybridization stringency. | Percentage in buffer dictates probe specificity; must be optimized. |
| Hydrogen Peroxide (Low Concentration) | Substrate for HRP in the tyramide amplification reaction. | Typically 0.0015% in amplification buffer; critical for reaction kinetics. |
| Blocking Reagent (e.g., Skim Milk) | Reduces non-specific adsorption of tyramide. | Used in amplification buffer (e.g., 0.5% w/v). |
5. Visualizing Workflows and Relationships
Title: Combined Helper Probe and CARD-FISH Mechanism
Title: Optimized CARD-FISH with Helper Probes Workflow
Validating FISH Results: Comparing to PCR, NGS, and Culture Methods
Fluorescence in situ hybridization (FISH) is a cornerstone technique for the direct identification, localization, and quantification of specific microbial taxa in complex samples. Within a comprehensive thesis on FISH protocols for microbial identification, the validation of assay performance is a critical chapter. This guide details the essential controls and standards required to rigorously determine the specificity and sensitivity of a FISH assay, ensuring the reliability and interpretability of research data for drug development and microbial ecology.
Defining Specificity and Sensitivity in Microbial FISH
- Specificity: The ability of the FISH probe to bind exclusively to its target nucleic acid sequence within the intended organism(s), without binding to non-targets. It is quantified as the proportion of true negatives correctly identified.
- Sensitivity: The ability of the assay to detect the target organism when it is present. It is often expressed as the minimal number of ribosomes (and therefore cells) required for detection or the percentage of target cells correctly identified in a mixed population.
Core Controls for Validation
A robust validation strategy employs a panel of controls.
Table 1: Essential FISH Controls for Validation
| Control Type | Purpose | Experimental Implementation | Interpretation of Result |
|---|---|---|---|
| Positive Control | Confirm protocol functionality. | Use a well-characterized probe (e.g., EUB338 for most Bacteria) on a known positive sample (e.g., E. coli pure culture). | Expected: Strong fluorescence. Failure indicates protocol issues. |
| Negative Control (No Probe) | Detect autofluorescence & nonspecific dye binding. | Perform hybridization without any probe added to the sample. | Expected: No signal. Any signal indicates background interference. |
| Negative Control (NON338 Probe) | Standard for nonspecific probe binding. | Use a nonsense probe (e.g., NON338, complementary to no known sequence) on the test sample. | Expected: No signal. Signal indicates nonspecific probe binding. |
| Specificity Control (Competitor) | Validate probe specificity. | Perform hybridization with unlabeled competitor oligonucleotide (identical to probe sequence) added in excess. | Expected: Drastic signal reduction. Confirms sequence-specific binding. |
| Specificity Control (Mismatch) | Test probe discrimination ability. | Use a probe with 1-2 central mismatches to the target sequence. | Expected: Significant signal reduction vs. perfect match. Validates stringency. |
| Organism-Specific Negative | Confirm no cross-hybridization. | Hybridize target probe to a pure culture of a phylogenetically close, non-target organism. | Expected: No signal. Validates probe design in silico. |
Standards for Quantifying Sensitivity
Sensitivity is assessed using defined reference standards.
Table 2: Standards for Sensitivity Determination
| Standard Type | Preparation Protocol | Application in Sensitivity Assessment |
|---|---|---|
| Spiked Environmental Samples | 1. Serially dilute a pure culture of the target organism.2. Spike known cell counts into a sterilized or non-target environmental matrix (e.g., soil, saliva).3. Fix and process alongside natural samples. | Determines limit of detection (LOD) and quantifies recovery efficiency in a complex background. |
| Artificial Cell Mixtures | 1. Grow pure cultures of target and non-target organisms.2. Mix in defined ratios (e.g., 1:10, 1:100, 1:1000 target:non-target).3. Fix, apply to slides, and perform FISH. | Measures assay specificity and sensitivity in a controlled, defined community. |
| Fluorescent Microsphere Standards | 1. Use beads with defined fluorescence intensity (e.g., TetraSpeck beads).2. Add beads to the sample during mounting. | Provides an internal reference for microscope and camera performance, allowing cross-experiment signal comparison. |
Protocol: Determining Limit of Detection (LOD) via Spiking
- Sample Preparation: Create a 10-fold serial dilution of a target microbe with known cell density (e.g., from 10⁸ to 10¹ cells/mL). Fix each dilution with 4% paraformaldehyde.
- Hybridization: Apply fixed cells from each dilution to multi-well slides. Perform standard FISH protocol with the target-specific probe and relevant controls.
- Imaging & Analysis: Image multiple, random fields per dilution using consistent microscope settings. Count fluorescent cells.
- Calculation: The LOD is the lowest cell density where the signal-to-noise ratio is >3 and target cells are unambiguously distinguishable from background.
The Scientist's Toolkit: Key Research Reagent Solutions
Table 3: Essential Materials for FISH Validation Experiments
| Item / Reagent | Function in Validation |
|---|---|
| Fluorophore-labeled Oligonucleotide Probes | Core detection reagent. Must be HPLC-purified. Different dyes (e.g., Cy3, Cy5, FITC) allow multiplexing. |
| Formamide (Molecular Biology Grade) | Key component of hybridization buffer. Controls stringency; concentration is probe-specific and must be optimized. |
| Paraformaldehyde (PFA, 16-32% solutions) | Primary fixative for most microbes. Preserves cell morphology and permeability while immobilizing nucleic acids. |
| Ethanol (Molecular Biology Grade, 50%, 80%, 96%) | Used for dehydration after fixation and as a wash solution. Critical for cell adherence to slides. |
| Hybridization Buffer (with formamide, salts, detergent) | Creates optimal chemical environment for specific probe binding to target rRNA. |
| Wash Buffer (with EDTA, salts, SDS) | Removes unbound and nonspecifically bound probe after hybridization. Stringency is controlled by salt concentration and temperature. |
| Antifading Mounting Medium (with DAPI) | Preserves fluorescence during microscopy. DAPI serves as a general counterstain for total cells, enabling calculation of relative abundance. |
| Positive Control Probe (e.g., EUB338) | Universal bacterial probe to verify overall FISH protocol performance on any bacterial sample. |
| Negative Control Probe (e.g., NON338) | Nonsense probe to establish background fluorescence levels for a given sample. |
| Certified Reference Material (CRM) Microbial Strains | Genomically sequenced, pure cultures from repositories (e.g., ATCC, DSMZ) essential for probe testing and creating spiked standards. |
Visualizing Validation Workflows
Title: FISH Validation Workflow & Key Controls
Title: FISH Signal & Noise Path to Specificity
This whitepaper serves as a core technical chapter within a broader thesis investigating optimized Fluorescence In Situ Hybridization (FISH) protocol steps for direct, cultivation-independent microbial identification in complex samples. The thesis posits that while FISH provides unparalleled spatial context and rapid visual confirmation, its quantitative capabilities are inherently limited. This necessitates a critical comparison with polymerase chain reaction (PCR) and quantitative PCR (qPCR) methods, which offer superior quantification and sensitivity but lack morphological and spatial data. The integration of both approaches is often key to comprehensive microbial research and drug development.
Core Technology Comparison: Principles and Data
Foundational Principles
FISH (Fluorescence In Situ Hybridization): Utilizes fluorescently labeled oligonucleotide probes that target specific ribosomal RNA (rRNA) sequences within intact, fixed cells. Hybridization is visualized via fluorescence microscopy, allowing for the direct enumeration and spatial localization of microbial taxa within an environmental or host context.
PCR (Polymerase Chain Reaction): Amplifies specific DNA sequences in vitro through thermal cycling (denaturation, annealing, extension) using sequence-specific primers. End-point analysis confirms presence/absence.
qPCR (Quantitative PCR): A refinement of PCR that monitors the amplification of DNA in real-time using fluorescent reporters (e.g., SYBR Green or TaqMan probes). The cycle threshold (Ct) value correlates directly with the initial target copy number, enabling precise quantification.
Table 1: Comparative Technical Specifications of FISH, PCR, and qPCR
| Parameter | FISH | PCR (End-point) | qPCR (Quantitative) |
|---|---|---|---|
| Primary Output | Spatial localization & visual cell count | Amplified DNA product (presence/absence) | Quantitative copy number (Ct value) |
| Quantification | Semi-quantitative (cells per field/volume) | Non-quantitative (end-point) | Highly quantitative (over 7-8 log range) |
| Typical Sensitivity | ~10³ - 10⁴ cells/mL (depends on probe) | 1-10 target gene copies | 1-10 target gene copies |
| Turnaround Time | ~3-8 hours (post-sample fixation) | ~2-4 hours | ~1-3 hours |
| Throughput | Low to medium (microscopy-limited) | High | Very High |
| Live/Dead Discrimination | Possible with viability markers | No (amplifies DNA from live and dead) | No (amplifies DNA from live and dead) |
| Spatial Context | YES – Critical advantage | NO – Sample homogenized | NO – Sample homogenized |
| Requires Cultivation? | NO – Key advantage | NO | NO |
| Risk of Amplification Bias | None | High (chimera formation, primer bias) | Medium (but controlled with standards) |
Detailed Methodological Protocols
Detailed FISH Protocol (From Thesis Core)
Objective: To detect and visualize a specific microbial genus in a sputum sample.
Key Research Reagent Solutions:
- Fixative (4% Paraformaldehyde (PFA)): Cross-links and preserves cellular morphology and rRNA targets.
- Hybridization Buffer (0.9M NaCl, 20mM Tris/HCl, 0.01% SDS, Formamide [concentration probe-specific]): Creates stringent conditions for probe binding.
- Cy3-labeled oligonucleotide probe (e.g., 5'-XXX-3'): A 15-25bp DNA probe complementary to target 16S rRNA, labeled with cyanine dye (Cy3).
- Washing Buffer (varying NaCl concentration): Removes non-specifically bound probe post-hybridization.
- Counterstain (DAPI or SYBR Green): Stains all DNA, providing total cell count and morphological context.
- Antifading Mountant (e.g., Vectashield): Preserves fluorescence signal during microscopy.
Workflow:
- Sample Fixation: Mix fresh sample with 4% PFA (1:3 v/v). Incubate at 4°C for 4-12 hours. Pellet cells, wash with PBS, and resuspend in PBS:EtOH (1:1). Store at -20°C.
- Slide Preparation: Apply fixed sample to welled slide. Air dry and dehydrate through an ethanol series (50%, 80%, 96% for 3 min each).
- Hybridization: Apply 10-20µL of hybridization buffer containing the probe (5-50 ng/µL) to each well. Incubate in a humidified chamber at 46°C for 90-120 minutes.
- Stringent Wash: Immerse slide in pre-warmed washing buffer (48°C) for 10-15 minutes. Rinse briefly with ice-cold dH₂O and air dry in darkness.
- Counterstaining & Mounting: Apply DAPI (1µg/mL) for 5 min. Rinse, dry, and add antifading mountant. Apply coverslip.
- Microscopy & Analysis: Visualize using an epifluorescence microscope with appropriate filter sets. Count target (Cy3-positive) and total (DAPI-positive) cells.
Diagram Title: Step-by-Step FISH Protocol Workflow
Detailed qPCR Protocol for Microbial Quantification
Objective: To quantify the absolute abundance of a specific bacterial gene in a soil DNA extract.
Key Research Reagent Solutions:
- DNA Extraction Kit (e.g., MoBio PowerSoil): Standardized for efficient lysis and inhibitor removal.
- qPCR Master Mix (2x Concentration): Contains DNA polymerase, dNTPs, Mg²⁺, and reaction buffer. Use SYBR Green or probe-based.
- Sequence-Specific Primers (Forward & Reverse): Designed for target gene (e.g., 16S rRNA variable region).
- Fluorogenic Probe (if using TaqMan): Oligonucleotide with 5' reporter dye (FAM) and 3' quencher.
- Quantification Standards: Serial dilutions of a plasmid containing the cloned target amplicon of known concentration.
Workflow:
- Nucleic Acid Extraction: Extract total genomic DNA from sample using commercial kit. Quantify DNA via spectrophotometry.
- Standard Curve Preparation: Perform 10-fold serial dilutions (e.g., 10⁷ to 10¹ copies/µL) of the plasmid standard.
- Reaction Plate Setup: In each well of a 96-well plate, mix: 10µL 2x Master Mix, 1µL forward primer (10µM), 1µL reverse primer (10µM), 2µL template (sample DNA or standard), and 6µL nuclease-free water (total 20µL). Run standards and samples in triplicate.
- Real-Time Cycling: Run plate on real-time cycler. Typical program: Initial denaturation (95°C, 5 min); 40 cycles of: Denaturation (95°C, 15 sec), Annealing/Extension (60°C, 60 sec, with fluorescence acquisition).
- Data Analysis: Software generates a standard curve (Ct vs. log₁₀ starting quantity). Interpolate sample Ct values against the curve to determine absolute target copy number in the original sample.
Diagram Title: qPCR Quantification Workflow
The Scientist's Toolkit: Essential Research Reagents
Table 2: Key Reagents for Integrated FISH and qPCR Studies
| Reagent/Material | Primary Function | Associated Technique |
|---|---|---|
| Paraformaldehyde (PFA) | Chemical fixative; preserves cell structure and intracellular rRNA for probe access. | FISH |
| Formamide | Component of hybridization buffer; controls stringency by lowering melting temperature. | FISH |
| Fluorescent Oligo Probe | Target-specific, dye-labeled molecule that binds rRNA for detection. | FISH |
| DAPI Stain | Counterstain that binds DNA, allowing visualization of all nuclei/cells. | FISH |
| DNA Polymerase (Taq) | Enzyme that synthesizes new DNA strands from a template during thermal cycling. | PCR/qPCR |
| SYBR Green I Dye | Intercalating dye that fluoresces when bound to double-stranded DNA. | qPCR |
| TaqMan Probe | Hydrolysis probe with reporter/quencher; increases specificity via an extra sequence. | qPCR |
| Plasmid DNA Standard | Cloned target sequence of known concentration; essential for generating a standard curve. | qPCR |
Within the thesis framework of advancing FISH protocols, the comparison with PCR/qPCR is not to declare a winner but to delineate complementary roles. FISH provides the where and how many in a morphologically intact context—a crucial insight for studying biofilms, host-microbe interactions, or microbial consortia. Conversely, qPCR provides the definitive how much with high sensitivity and throughput, ideal for tracking population dynamics or low-abundance targets. The most robust microbial identification and quantification strategies often employ qPCR for initial quantitative screening, followed by FISH for spatial-validation and visualization, leveraging the culturing-independent speed and contextual depth of both.
The precise identification and spatial localization of microorganisms are critical in environmental microbiology, clinical diagnostics, and drug development. This whitepaper, framed within a broader thesis on the optimization of Fluorescence In Situ Hybridization (FISH) protocol steps, contrasts this established, targeted visualization technique with the untargeted, high-throughput discovery power of Next-Generation Sequencing (NGS). While FISH provides definitive, visual proof of identity and morphology in a native context, NGS enables comprehensive, sequence-based microbial community profiling without prior knowledge of targets. The choice between them is not binary but strategic, dictated by the research question: "Where is a specific microbe?" versus "What microbes are present?"
Core Technology Comparison
FluorescenceIn SituHybridization (FISH): Targeted Visualization
FISH is a cytogenetic technique that uses fluorescently labeled oligonucleotide probes to bind to complementary ribosomal RNA (rRNA) sequences within fixed, permeabilized cells, allowing for their visualization under a fluorescence microscope.
Detailed FISH Protocol for Microbial Identification:
Sample Fixation & Permeabilization:
- Method: Immerse sample (biofilm, tissue section, cell smear) in a 4% paraformaldehyde solution (in 1x PBS) for 2-4 hours at 4°C. For Gram-positive bacteria, an additional permeabilization step using 50-100% ethanol or lysozyme treatment (10 mg/mL, 37°C, 10-60 min) may be required.
- Purpose: Preserves cellular morphology and makes the thick cell wall permeable to nucleic acid probes.
Hybridization:
- Prepare a hybridization buffer (e.g., 0.9 M NaCl, 20 mM Tris-HCl pH 7.2, 0.01% SDS, Formamide concentration probe-specific).
- Add fluorescently labeled probe (e.g., Cy3-labeled EUB338 for most Bacteria) to the buffer.
- Apply mix to fixed sample on a slide and incubate in a dark, humidified chamber. Conditions are probe-specific: Typically 46°C for 2-4 hours. Formamide concentration in the buffer is adjusted to fine-tune the hybridization stringency.
Stringency Wash:
- Immerse slide in pre-warmed wash buffer (e.g., 20 mM Tris-HCl pH 7.2, 5 mM EDTA, 0.01% SDS, NaCl concentration matched to formamide used) at 48°C for 15-30 minutes.
- Purpose: Removes unbound and non-specifically bound probes to reduce background fluorescence.
Counterstaining & Microscopy:
- Rinse slide with cold distilled water and air dry.
- Apply mounting medium containing DAPI (4',6-diamidino-2-phenylindole) to stain all nucleic acids.
- Visualize using epifluorescence or confocal laser scanning microscopy. Positive identification is confirmed by co-localization of probe-derived fluorescence with DAPI-stained cell morphology.
Next-Generation Sequencing (NGS): Metagenomic Discovery
Metagenomic NGS involves the direct extraction, amplification (for 16S/18S/ITS amplicon sequencing), or direct sequencing (for shotgun metagenomics) of total DNA from an environmental or clinical sample, followed by massive parallel sequencing to profile the entire microbial community.
Detailed 16S rRNA Amplicon Sequencing Protocol:
DNA Extraction & Quantification:
- Use a commercial kit (e.g., Qiagen DNeasy PowerSoil) optimized for diverse cell lysis and inhibitor removal.
- Quantify DNA yield using a fluorometric assay (e.g., Qubit).
Library Preparation (PCR Amplification):
- Amplify the hypervariable regions (e.g., V3-V4) of the bacterial 16S rRNA gene using universal primer sets (e.g., 341F/806R).
- Attach platform-specific sequencing adapters and sample-specific barcodes via a second limited-cycle PCR.
- Purify the final amplicon library using magnetic beads.
Sequencing & Bioinformatic Analysis:
- Pool libraries and sequence on an Illumina MiSeq or NovaSeq platform (2x250 bp or 2x300 bp paired-end reads).
- Bioinformatics Workflow: Quality filtering (DADA2, QIIME2) → Denoising & Amplicon Sequence Variant (ASV) generation → Taxonomic classification against databases (SILVA, Greengenes) → Ecological and statistical analysis.
Quantitative Comparison & Data Tables
Table 1: Technical Specifications and Performance Metrics
| Parameter | Fluorescence In Situ Hybridization (FISH) | Next-Generation Sequencing (NGS - 16S Amplicon) |
|---|---|---|
| Primary Output | Microscopic image; spatial localization | Digital sequence data; taxonomic list & relative abundance |
| Sensitivity | ~10³ - 10⁴ cells/mL (with catalyzed reporter deposition) | Can detect rare taxa (<0.1% relative abundance) |
| Throughput | Low (manual microscopy) to medium (automated imaging) | Very High (10⁵ - 10⁸ sequences per run) |
| Turnaround Time | 1-2 days (from sample to image) | 2-5 days (from sample to analyzed data) |
| Quantification | Semi-quantitative (cell counts, biovolume) | Relative abundance; potential for absolute with spike-ins |
| Spatial Context | Preserved and visualized (single-cell resolution) | Destroyed (homogenized sample) |
| Prior Knowledge Required | Yes (for probe design targeting specific taxa) | No (universal primers enable discovery) |
| Key Limitation | Probe bias; limited multiplexing (~5-10 probes/sample) | PCR bias; does not distinguish live/dead; no innate spatial data |
Table 2: Typical Cost and Resource Analysis (Per Sample Estimate)
| Cost/Resource Category | FISH | NGS (16S Amplicon) |
|---|---|---|
| Reagent Cost | $20 - $100 (probe, buffers, stains) | $50 - $150 (extraction, library prep, sequencing) |
| Capital Equipment | High-end fluorescence microscope ($50k - $500k) | NGS sequencer ($100k - $1M) + compute cluster |
| Expertise Required | Microbiology, microscopy, image analysis | Molecular biology, bioinformatics, statistics |
| Data Storage | Low (MB - GB of images) | High (GB - TB of sequence files) |
Visualizing Workflows and Relationships
FISH Protocol Core Workflow
NGS Metagenomic Analysis Pipeline
Strategic Choice Between FISH and NGS
The Scientist's Toolkit: Essential Research Reagents & Materials
Table 3: Key Reagent Solutions for Microbial Identification Studies
| Item | Primary Function | Typical Example/Kit |
|---|---|---|
| FISH: Cy3-labeled Oligonucleotide Probe | Binds to complementary rRNA sequence inside target cell, providing fluorescent signal for detection. | EUB338 (5'-GCTGCCTCCCGTAGGAGT-3') for most Bacteria. |
| FISH: Hybridization Buffer with Formamide | Creates chemical environment for specific probe binding; formamide concentration controls stringency. | 0.9M NaCl, 20mM Tris/HCl pH 7.2, 0.01% SDS, 0-50% Formamide. |
| FISH: DAPI Counterstain | Fluorescent stain that binds to AT-rich regions in DNA, labeling all nuclei/cells for total cell count and morphology. | 4',6-diamidino-2-phenylindole, dihydrochloride. |
| NGS: DNA Extraction Kit | Lyzes diverse microbial cells, purifies genomic DNA, and removes humic acids, salts, and other PCR inhibitors. | Qiagen DNeasy PowerSoil Pro Kit, MP Biomedicals FastDNA SPIN Kit. |
| NGS: Universal 16S rRNA Primers | Amplify conserved regions of the 16S gene from a wide range of bacteria, enabling broad profiling. | 341F (CCTACGGGNGGCWGCAG) / 806R (GGACTACHVGGGTWTCTAAT). |
| NGS: High-Fidelity DNA Polymerase | Enzyme for PCR amplification with low error rate, critical for accurate sequence representation. | Phusion High-Fidelity DNA Polymerase, KAPA HiFi HotStart ReadyMix. |
| NGS: Size-Selective Magnetic Beads | Purify and size-select DNA fragments (e.g., amplicons) and normalize library concentrations. | SPRIselect (Beckman Coulter), AMPure XP beads. |
Within the thesis of advancing FISH protocols for microbial identification, NGS emerges not as a replacement but as a complementary discovery engine. The future lies in integrated approaches: using NGS to comprehensively catalog microbial community members and identify key taxa, followed by the design of specific FISH probes to visualize their spatial distribution, interactions, and abundance in the original sample matrix. This synergy between metagenomic discovery and targeted visualization offers the most powerful toolkit for researchers and drug developers seeking to understand and manipulate complex microbiomes.
Fluorescence In Situ Hybridization (FISH) has emerged as a critical tool for detecting and identifying Viable But Non-Culturable (VBNC) microorganisms. VBNC organisms represent a metabolically active but non-culturable state adopted by many bacteria in response to environmental stress, posing significant challenges for public health, food safety, and drug development. Traditional culture-based methods systematically fail to detect these organisms, leading to false negatives in pathogen screening, underestimated microbial loads, and incomplete risk assessments. This whitepaper details the technical advantages of FISH protocols within microbial identification research, providing a comparative analysis, detailed methodologies, and essential resources for researchers.
The VBNC State: A Diagnostic Blind Spot
The VBNC state is a survival strategy employed by diverse bacterial genera (e.g., Escherichia coli, Vibrio cholerae, Legionella pneumophila). In this state, cells maintain metabolic activity and virulence potential but cease division, rendering them invisible to culture on standard media. This has profound implications for antibiotic efficacy testing, sterility assurance, and environmental monitoring.
Table 1: Comparison of Detection Capabilities for VBNC Pathogens
| Method | Principle | Detects VBNC? | Time to Result | Approximate Sensitivity (Cells/sample) | Key Limitation for VBNC |
|---|---|---|---|---|---|
| Traditional Plate Culture | Growth on nutrient media | No | 24-72 hours | 10-100 CFU | Relies on cellular division; VBNC cells do not divide. |
| PCR (Standard) | Amplification of DNA targets | No* (DNA persists in dead cells) | 2-6 hours | 1-10 gene copies | Cannot differentiate between live/VBNC and dead cells. |
| Flow Cytometry with Vital Stains | Uptake of fluorescent dyes (e.g., CTC, SYTO) | Yes, but indirect | 30-60 min | 10^3-10^4 cells | Staining can be inconsistent; metabolic activity may be low. |
| FISH with rRNA-targeted probes | Hybridization to ribosomal RNA | Yes | 3-8 hours | 1-10 cells per field | Direct, visual confirmation of viable cells with intact ribosomes. |
Note: Viability PCR (e.g., with PMAxx) can mitigate this but adds cost and complexity.
Core FISH Protocol for VBNC Detection
The following protocol is optimized for the detection of VBNC bacteria in complex samples (e.g., water, biofilms, clinical specimens).
Sample Fixation and Permeabilization
Objective: To preserve cellular morphology and permeabilize cell walls for probe entry without degrading target rRNA.
- Fixation: Concentrate cells via filtration (0.22 µm polycarbonate filter) or centrifugation. Immerse filter or pellet in 4% paraformaldehyde (in 1X PBS, pH 7.4) for 2-4 hours at 4°C.
- Washing: Rinse twice with 1X PBS.
- Permeabilization (Gram-negative): Apply 50-80% ethanol for 10 minutes at room temperature. For Gram-positive species, additional enzymatic treatment (e.g., lysozyme) may be required.
- Storage: Samples can be stored in a 1:1 PBS:ethanol mixture at -20°C for months.
Probe Design and Hybridization
Objective: To use oligonucleotide probes labeled with fluorophores that specifically bind to complementary rRNA sequences.
- Probe Selection: Use domain-, genus-, or species-specific 16S or 23S rRNA probes (e.g., EUB338 for most Bacteria, NON338 as negative control). Commercially available probe databases (e.g., probeBase) are essential.
- Hybridization Buffer: 0.9 M NaCl, 20 mM Tris/HCl (pH 7.4), 0.01% SDS, and formamide. The formamide concentration (% v/v) is probe-specific and determines stringency.
- Procedure: Apply hybridization buffer containing 2-10 ng/µL of probe to fixed samples on a glass slide. Incubate in a dark, humidified chamber at 46°C for 1.5-3 hours.
Stringency Wash and Detection
Objective: To remove unbound and non-specifically bound probe.
- Wash Buffer: Pre-warm to 48°C. Composition: 20 mM Tris/HCl (pH 7.4), 5 mM EDTA, 0.01% SDS, and NaCl. The NaCl concentration is calculated based on the formamide concentration used in hybridization.
- Wash: Immerse slide in wash buffer for 15-20 minutes at 48°C.
- Rinse & Dry: Briefly rinse with ice-cold deionized water and air-dry in the dark.
- Mounting: Apply antifading mounting medium (e.g., containing DABCO or Vectashield) and a coverslip.
- Visualization: Analyze using epifluorescence or confocal microscopy with appropriate filter sets.
Advanced FISH Methodologies for VBNC Research
CARD-FISH (Catalyzed Reporter Deposition FISH): Uses horseradish peroxidase (HRP)-labeled probes and tyramide signal amplification, dramatically increasing sensitivity for cells with low rRNA content. Double Hybridization: Combining a general phylogenetic probe with a species-specific probe or a probe targeting a functional gene (mRNA) to confirm identity and activity. VITAL-FISH: Combines fluorescent vital staining (for membrane integrity or enzymatic activity) with FISH for a multi-parameter assessment of viability.
Figure 1: Core FISH Protocol Workflow for VBNC Detection
Figure 2: Diagnostic Pathway: Culture vs. FISH for VBNC
The Scientist's Toolkit: Essential Research Reagent Solutions
Table 2: Key Reagents and Materials for VBNC-FISH
| Item | Function / Purpose | Example Product / Specification |
|---|---|---|
| Fluorescently-Labeled Oligonucleotide Probes | Specific binding to target 16S/23S rRNA sequences. | Cy3-, Cy5-, or FLUOS-labeled; HPLC purified. |
| Paraformaldehyde (PFA) | Cross-linking fixative to preserve cell structure and rRNA. | Molecular biology grade, 4% solution in PBS, pH 7.4. |
| Formamide | Denaturing agent in hybridization buffer to control stringency. | Deionized, >99.5% purity. |
| Antifading Mounting Medium | Preserves fluorescence signal during microscopy. | Containing DABCO, p-phenylenediamine, or commercial mixes (e.g., Vectashield). |
| Polycarbonate Membrane Filters | For sample concentration and use as a support during hybridization. | 0.22 µm pore size, 25 mm diameter, black for fluorescence. |
| Hybridization Oven/Chamber | Provides precise, consistent temperature and humidity during hybridization. | Capable of maintaining 46°C ± 1°C. |
| Epifluorescence/Confocal Microscope | Visualization and imaging of fluorescently-labeled cells. | Equipped with appropriate filter sets for probe fluorophores (e.g., DAPI, FITC, Cy3, Cy5). |
| Positive Control Probes | Verify protocol functionality. | EUB338 (targets most Bacteria). |
| Negative Control Probes | Assess non-specific binding. | NON338 (complementary to EUB338). |
FISH represents a paradigm shift in microbial detection, directly addressing the critical limitation of culture-based methods posed by the VBNC state. Its ability to provide rapid, specific, and visual confirmation of viable cells—regardless of culturability—makes it indispensable for advanced research in environmental microbiology, infectious disease diagnostics, and antimicrobial drug development. Integrating FISH into standard identification protocols ensures a more accurate and comprehensive understanding of microbial communities and risks.
Quantitative FISH (qFISH) and Digital Image Analysis for Robust Data
Fluorescence In Situ Hybridization (FISH) is a cornerstone technique for microbial identification, phylogeny, and quantification in complex samples. Within the broader thesis on FISH protocol optimization for environmental and clinical microbiology, this document focuses on the critical transition from qualitative, visual assessment to quantitative FISH (qFISH) coupled with digital image analysis. This integration is essential for generating statistically robust, reproducible, and high-throughput data, moving beyond "presence/absence" to precise cellular abundance, fluorescence intensity measurements, and morphological analysis.
Core Principles of qFISH Quantification
qFISH transforms fluorescent signals into numerical data. The key measurable parameters include:
- Target Copy Number: Estimation of ribosomal RNA (rRNA) gene content or specific mRNA transcripts per cell.
- Relative Microbial Abundance: Percentage of a target population within a total community (DAPI-stained cells).
- Cellular Morphometrics: Cell area, length, and volume derived from segmented fluorescence.
- Signal-to-Noise Ratio (SNR): A critical metric for probe performance and hybridization efficiency.
Table 1: Core Quantifiable Parameters in qFISH for Microbial Research
| Parameter | Description | Typical Application in Microbial ID |
|---|---|---|
| Fluorescence Intensity (FI) | Pixel intensity sum/mean within a segmented cell. | Proportional to target rRNA content; species activity/ growth rate estimation. |
| Area-Integrated Intensity | FI multiplied by cell area. | Better correlate for biomolecule copy number. |
| % Target Population | (Target cells / DAPI cells) * 100. | Community structure analysis (e.g., % Archaea in digester sludge). |
| Signal-to-Noise Ratio | (Mean Target Signal - Mean Background) / SD_Background. | Objective evaluation of probe specificity and hybridization quality. |
| Morphometric Data | Cell area, perimeter, aspect ratio. | Linking phylogeny (probe signal) with cell shape/size. |
Detailed qFISH Protocol with Quantification Focus
This protocol assumes standard FISH steps (fixation, permeabilization, hybridization) are performed. The following emphasizes steps critical for quantitative analysis.
Sample Preparation & Hybridization for Quantification
- Fixation Control: Use a consistent fixative (e.g., 4% paraformaldehyde for bacteria) and fixation time (2-24h at 4°C) across all samples to minimize variance in target accessibility and autofluorescence.
- Reference Standard Inclusion: Hybridize a control sample containing cells with a known, consistent copy number of the target (e.g., a pure culture with known rRNA content) on the same slide to normalize inter-experiment intensity.
- Probe Concentration & Stringency: Precisely optimize and document formamide concentration, hybridization temperature (e.g., 46°C), and salt concentration in wash buffers. These must be identical for comparative studies.
Image Acquisition for Quantitative Analysis
- Microscope Calibration: Use a fluorescence reference slide (e.g., TetraSpeck beads) to align channels and correct for chromatic aberration.
- Detector Settings:
- Use a scientific-grade CCD or sCMOS camera with high dynamic range and linear response.
- Critical: Set exposure time within the camera's linear range. Avoid pixel saturation.
- Fixed Settings: For a given experiment, keep gain, offset, and exposure time constant for all images of the same channel.
- Z-stacking: Acquire images as Z-stacks (e.g., 0.2 µm steps) to capture entire cell volume. Maximum intensity projection is typically used for 2D analysis.
- Field Selection: Acquire ≥20 random, non-overlapping fields per sample to ensure statistical power. Use DAPI or autofluorescence to identify fields, not the probe channel, to avoid bias.
Digital Image Analysis Workflow
The core analytical pipeline involves pre-processing, segmentation, measurement, and data validation.
Diagram Title: Digital Image Analysis Workflow for qFISH
Detailed Steps:
- Pre-processing: Apply background subtraction (rolling ball/paraboloid) to remove uneven illumination. Apply flat-field correction using a reference image. Align channels if needed.
- Segmentation: The most critical step for accurate quantification.
- Primary Mask Creation: Use a high-SNR channel (e.g., DAPI for total cells, a general bacterial probe like EUB338) to identify all cellular objects.
- Method: Use intensity thresholding (Otsu, Li) followed by a watershed algorithm to separate touching cells. Advanced pipelines employ machine learning classifiers (e.g., ilastik, Cellpose) trained on microbial shapes.
- Mask Application: The binary mask from segmentation defines Regions of Interest (ROIs) for measurement.
- Measurement & Classification: For each ROI, measure:
- Morphology: Area, perimeter, circularity.
- Intensity: Mean, maximum, and integrated density for each fluorescence channel.
- Classification: Apply an intensity threshold in the probe channel (determined from negative controls) to classify each ROI as "target-positive" or "target-negative."
- Data Validation: Manually review a subset of segmented images to correct for over-/under-segmentation. Filter out artifacts by size or intensity.
The Scientist's Toolkit: Research Reagent Solutions
Table 2: Essential Materials for Robust qFISH Experiments
| Item | Function & Rationale |
|---|---|
| High-Purity, HPLC-Graded Formamide | Maintains stringent hybridization conditions. Batch-to-batch variability can affect stringency, impacting quantification. |
| Buffered Paraformaldehyde (4%, pH 7.2-7.4) | Consistent cross-linking fixative. Unbuffered or old PFA increases autofluorescence, harming SNR. |
| Probes with High Photostability | Cy3, Cy5, or Alexa Fluor dyes are preferred over FITC for quantitation due to higher brightness and resistance to photobleaching during acquisition. |
| ANTIFADE Mounting Media | Contains reagents (e.g., DABCO, Vectashield) to retard photobleaching, preserving signal integrity during multi-field acquisition. |
| Microscope Slide Calibration Beads | Fluorescent beads (TetraSpeck, PS-Speck) for aligning emission channels and verifying microscope resolution/pixel size. |
| Positive & Negative Control Strains | Isogenic cultures with/without target sequence are mandatory for setting probe specificity thresholds and validating protocol performance. |
| Image Analysis Software | Open-source: Fiji/ImageJ (with plugins), CellProfiler, ilastik. Commercial: MetaMorph, Bitplane Imaris, Arivis Vision4D. |
| Standardized Reference Sample | A stable, homogeneous sample (e.g., fixed culture pellet) hybridized in every experiment to normalize for day-to-day instrumental variance. |
Data Normalization and Reporting
Raw intensity values are not comparable across experiments. Essential normalization strategies include:
Table 3: Common Normalization Methods in qFISH
| Method | Procedure | Purpose |
|---|---|---|
| Background Subtraction | Subtract mean intensity of cell-free region from cellular intensity. | Removes non-specific background and camera offset. |
| Reference Standard Normalization | Divide all intensities by the mean intensity of the reference standard on the same slide. | Compensates for variations in lamp intensity, probe concentration, etc. |
| Internal Control Probe | Use a second probe targeting a conserved region (e.g., EUB338 for all bacteria) as an internal standard per cell. | Controls for variations in cell permeability and ribosome content. |
| % Target Abundance | Express counts as (Target-positive cells / DAPI-positive cells) * 100. | Normalizes for differences in total biomass or sampling density. |
Advanced Applications: Multiplex qFISH and Topological Analysis
- Multiplexing (>3 targets): Combinatorial labeling with multiple fluorophores (e.g., CLASI-FISH) requires spectral unmixing algorithms to deconvolve overlapping emission spectra before quantification.
- Spatial Analysis: After segmentation and classification, spatial statistics (e.g., nearest-neighbor distance, Ripley's K-function) can quantify microbial consortia organization.
Diagram Title: Workflow for Multiplex qFISH & Spatial Analysis
Integrating qFISH with rigorous digital image analysis transforms FISH from a descriptive tool into a powerful, quantitative platform for microbial ecology, diagnostics, and drug development. The key to robust data lies in standardized protocols, careful image acquisition, meticulous segmentation, and appropriate normalization. By adhering to the principles outlined in this guide, researchers can generate reliable, statistically significant data that accurately reflects microbial community structure and function.
Within the broader methodological thesis on Fluorescence In Situ Hybridization (FISH) for microbial identification, the protocol's core limitation is its inability to link phylogenetic identity with in situ metabolic function. While FISH excels at visualizing and quantifying specific microbial groups, it remains a phenotypic marker. MAR-FISH elegantly bridges this gap by combining radioactive substrate uptake (Microautoradiography) with phylogenetic identification (FISH). This integration is pivotal for research in microbial ecology, environmental bioremediation, and drug development, where understanding functional activity at the single-cell level is paramount.
Core Principle of MAR-FISH
MAR-FISH allows for the simultaneous detection of substrate uptake and phylogenetic identity of individual microbial cells in a mixed community. Cells are incubated with a radiolabeled (typically with ³H or ¹⁴C) substrate. Upon uptake and incorporation, the radioactive decay emissions expose a silver halide emulsion layered over the cells. Subsequent development creates silver grains (microautoradiographic signals) directly above metabolically active cells. This is followed by FISH, which fluorescently labels the same cells with oligonucleotide probes targeting rRNA, providing phylogenetic identification.
Detailed MAR-FISH Protocol
Phase 1: Sample Incubation with Radioactive Substrate
- Sample Preparation: Environmental or clinical samples are homogenized. Cell integrity is preserved; avoid harsh fixation initially.
- Radioactive Incubation: Incubate samples with a tritium (³H)- or carbon-14 (¹⁴C)-labeled substrate (e.g., ³H-glucose, ³H-leucine, ¹⁴C-acetate) at in situ concentrations. Typical incubation times range from 4 to 24 hours, in the dark, under conditions mimicking the original habitat.
- Controls: Include killed controls (e.g., formaldehyde-fixed before incubation) to account for abiotic absorption.
- Fixation and Washing: Terminate incubation with buffered formaldehyde (final conc. 2-4%), fix for 1-3 hours at 4°C. Centrifuge and wash repeatedly with sterile buffer or PBS to remove unincorporated radiolabel.
Phase 2: Microautoradiography
- Slide Preparation: Apply fixed sample onto gelatin-coated microscope slides, air dry, and dehydrate through an ethanol series (50%, 80%, 96%).
- Emulsion Application: In a darkroom under safe light, melt photographic emulsion (e.g., Ilford K.5) at 45°C and dilute 1:1 with distilled water. Dip slides into the emulsion, drain vertically, and dry horizontally in the dark for 2-3 hours.
- Exposure: Store slides in a light-tight box with desiccant at 4°C. Exposure times vary from several days to weeks, depending on isotope activity and substrate uptake rates.
- Development: Under safe light, develop slides in developer (e.g., Kodak D-19, 5 min), stop in 1% acetic acid (30 sec), and fix in photographic fixer (e.g., Kodak, 5 min). Rinse gently in distilled water.
Phase 3: Fluorescence In Situ Hybridization
- Permeabilization (if needed): For Gram-positive bacteria, treat with lysozyme (10 mg/mL in 0.1 M Tris/HCl, 0.05 M EDTA; 37°C, 10-60 min).
- Hybridization: Apply FISH hybridization buffer containing the desired horseradish peroxidase (HRP)-labeled oligonucleotide probe. Hybridize in a humid chamber at 46°C for 2-3 hours.
- Stringency Washes: Wash slides in pre-warmed washing buffer at 48°C for 10-15 minutes.
- Signal Amplification (if using CARD-FISH): For HRP probes, incubate with fluorescently labeled tyramide (e.g., Alexa Fluor 488-tyramide) and H₂O₂ to deposit multiple fluorophores per probe.
- Counterstaining and Mounting: Counterstain with DAPI (1 µg/mL), air dry, and mount with an anti-fading mounting medium.
Phase 4: Microscopy and Analysis
- Visualization: Analyze using an epifluorescence microscope equipped with appropriate filter sets for the fluorophore(s) used and DAPI.
- Signal Discrimination: Active cells display both fluorescent signal (FISH) and clustered silver grains (MAR) in the brightfield or phase-contrast channel.
Key Quantitative Data & Performance Metrics
Table 1: Comparison of Radioisotopes Used in MAR-FISH
| Isotope | Half-Life | Emission Type (Energy) | Resolution (µm) | Typical Substrates | Exposure Duration |
|---|---|---|---|---|---|
| Tritium (³H) | 12.3 years | Beta⁻ (18.6 keV) | ~0.5 | Amino acids, nucleotides, fatty acids | Days to weeks |
| Carbon-14 (¹⁴C) | 5730 years | Beta⁻ (156 keV) | ~5-10 | Organic acids, CO₂, specific compounds | Weeks to months |
Table 2: Critical Protocol Parameters and Their Impact
| Parameter | Typical Range | Impact on Results | Optimization Consideration |
|---|---|---|---|
| Substrate Concentration | nM to µM (near in situ) | High conc. may cause false positives; low conc. may miss activity. | Use tracer-level concentrations (<1% of natural pool). |
| Incubation Time | 4 - 24 hours | Short times may miss slow growers; long times may lead to secondary uptake. | Match to generation times of target organisms. |
| Exposure Time | 3 days - 4 weeks | Under-exposure: weak MAR signal. Over-exposure: high background. | Perform test slides with active/killed controls. |
| FISH Probe Stringency | 20-60% formamide | Low stringency: non-specific binding. High stringency: weak target signal. | Determine experimentally for each probe. |
The Scientist's Toolkit: MAR-FISH Research Reagent Solutions
| Item | Function in MAR-FISH |
|---|---|
| ³H- or ¹⁴C-labeled Substrates | Tracer molecules to track specific metabolic pathways (e.g., uptake of carbon, nitrogen). |
| Photographic Emulsion (Ilford K.5, Kodak NTB) | Silver halide layer that captures radioactive decay particles, forming the latent image. |
| HRP-labeled oligonucleotide Probes | Enable catalyzed reporter deposition (CARD-FISH), providing high fluorescence signal intensity, crucial for penetrating the emulsion layer. |
| Fluorescently Labeled Tyramide | Substrate for HRP; deposits numerous fluorophores at the probe site, amplifying signal. |
| Lysozyme or Proteinase K | Enzymes for cell wall permeabilization, ensuring FISH probe access to rRNA in recalcitrant cells. |
| DAPI (4',6-diamidino-2-phenylindole) | Counterstain for total cell visualization, regardless of phylogenetic identity or activity. |
Visualizing the MAR-FISH Workflow and Data Interpretation
Diagram 1: MAR-FISH Integrated Experimental Workflow
Diagram 2: Microautoradiography Signal Generation
Conclusion
The FISH protocol remains an indispensable, versatile tool for the direct, visual identification and localization of microorganisms within complex samples. For researchers and drug developers, mastering its steps—from foundational probe design to advanced troubleshooting and validation—enables precise investigation of microbial communities in health, disease, and drug response environments. While FISH provides unparalleled spatial context, its future lies in integration with omics technologies like NGS and metabolomics, creating powerful multimodal platforms. Emerging trends, such as high-throughput automated FISH and expanded multiplexing capabilities, promise to further revolutionize its role in personalized medicine, microbiome research, and the development of targeted antimicrobial therapies, solidifying its place in the modern microbial analysis toolkit.