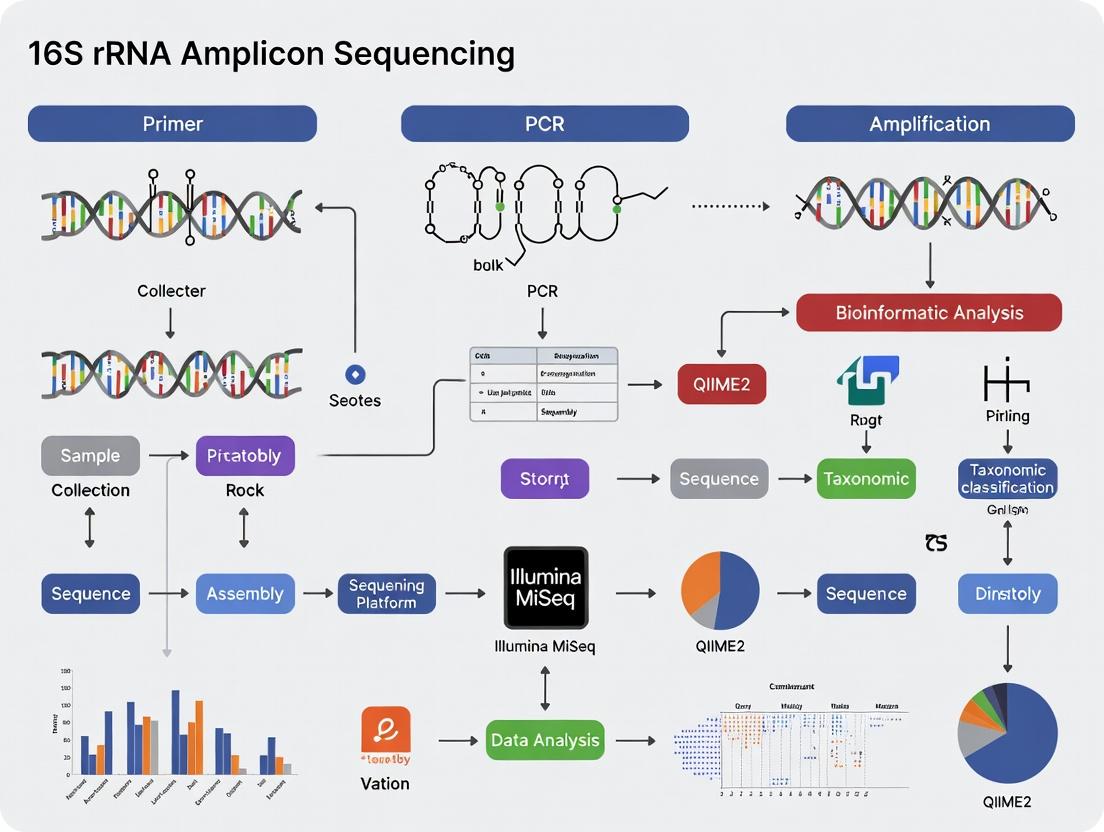
From Sample to Insight: Your Complete 16S rRNA Amplicon Sequencing Guide for Biomedical Researchers
This comprehensive guide provides biomedical researchers, scientists, and drug development professionals with a clear roadmap to 16S rRNA amplicon sequencing.
From Sample to Insight: Your Complete 16S rRNA Amplicon Sequencing Guide for Biomedical Researchers
Abstract
This comprehensive guide provides biomedical researchers, scientists, and drug development professionals with a clear roadmap to 16S rRNA amplicon sequencing. We begin by exploring the foundational principles of 16S sequencing and its revolutionary role in profiling microbial communities. Next, we detail the step-by-step methodological workflow, from experimental design and library preparation to bioinformatic analysis. The guide then addresses common pitfalls and optimization strategies for robust, reproducible results. Finally, we cover critical validation techniques and compare 16S sequencing to other methods like shotgun metagenomics. By demystifying the entire process, this article empowers researchers to effectively apply this powerful tool to advance studies in microbiome-related health, disease, and therapeutic development.
What is 16S rRNA Sequencing? Unlocking the Microbial Universe for Biomedical Discovery
For researchers embarking on a 16S rRNA amplicon sequencing beginner guide, understanding the foundational rationale for targeting this specific gene is paramount. This whitepaper elucidates the core technical and biological principles that cement the 16S ribosomal RNA (rRNA) gene as the universal barcode for identifying and classifying Bacteria and Archaea. Its selection is not arbitrary but is rooted in a confluence of evolutionary, structural, and practical factors that make it uniquely suited for microbial community profiling, a critical tool in ecology, biotechnology, and drug development.
Fundamental Properties of the 16S rRNA Gene
Universal Presence and Functional Constancy
The 16S rRNA gene is a component of the small subunit (SSU) of the prokaryotic ribosome, the essential machinery for protein synthesis. Its function is so critical and ancient that it is present in every known bacterium and archaeon, with no known horizontal gene transfer events for the core gene. This universal presence allows for the design of broad-range primers capable of amplifying the gene from virtually any prokaryote in a sample.
Mutually Exclusive Characteristics: Conserved and Variable Regions
The gene's structure provides the ideal balance for phylogenetic analysis:
- Conserved Regions: Sequences that are nearly identical across vast taxonomic distances. These enable primer binding and alignment of sequences from diverse organisms.
- Variable Regions (V1-V9): Nine hypervariable segments interspersed between conserved areas. These regions accumulate mutations at a higher rate, providing the sequence diversity necessary to distinguish between genera and species.
Table 1: Characteristics of the 16S rRNA Gene Variable Regions
| Variable Region | Approximate Position (E. coli numbering) | Evolutionary Rate | Suitability for Short-Read Sequencing | Notes for Primer Design |
|---|---|---|---|---|
| V1-V2 | 69-239 | High | Good | Often used for very fine differentiation, but can be challenging for some taxa. |
| V3-V4 | 341-806 | Moderate | Excellent | The most commonly targeted region (e.g., Illumina MiSeq); offers a strong balance of resolution and read length. |
| V4 | 515-806 | Moderate | Excellent | Highly recommended for environmental studies; robust across diverse communities. |
| V4-V5 | 515-926 | Moderate | Good | Provides slightly longer amplicons with good resolution. |
| V6-V8 | 986-1406 | Lower | Moderate | Less commonly used; may offer complementary data. |
| V9 | 1242-1611 | Low | Good | Often the shortest region; useful for highly degraded samples. |
Sufficient Length and Database Richness
At approximately 1,550 base pairs, the full-length gene contains enough information for robust phylogenetic inference. Decades of research have resulted in massive, curated public databases (e.g., SILVA, Greengenes, RDP) containing hundreds of thousands of reference 16S rRNA sequences. This extensive reference library is essential for accurate taxonomic assignment of newly generated amplicon sequences.
Comparative Analysis with Alternative Markers
While other marker genes (e.g., rpoB, gyrB, cpn60) are used for specific applications, the 16S rRNA gene remains the primary universal barcode due to a superior combination of factors.
Table 2: Quantitative Comparison of Common Prokaryotic Barcode Genes
| Gene | Function | Approx. Length (bp) | Evolutionary Rate vs. 16S | Primary Advantage | Primary Limitation |
|---|---|---|---|---|---|
| 16S rRNA | Ribosomal small subunit | ~1,550 | Baseline | Universal; vast reference DBs; standardized protocols. | Cannot reliably differentiate some closely related species. |
| 23S rRNA | Ribosomal large subunit | ~2,900 | Similar | More informative sites; longer length. | Less universal primer sets; larger DBs but less curated. |
| rpoB | RNA polymerase β-subunit | ~4,200 | Higher | Better species/strain-level resolution. | Not universal; requires degenerate primers; smaller DBs. |
| gyrB | DNA gyrase subunit B | ~2,400 | Higher | Excellent for differentiating closely related species. | Limited universality; database size limited. |
| cpn60 | Chaperonin | ~1,650 | Higher | High resolution; universal target. | Database smaller than 16S; less historical data. |
Detailed Experimental Protocol: Library Preparation for 16S Amplicon Sequencing
The following protocol outlines a standard, high-fidelity workflow for preparing 16S rRNA gene amplicon libraries for Illumina sequencing.
Protocol: Two-Step PCR Amplification with Dual Indexing
Principle: This method minimizes primer artifacts and allows for high multiplexing. Step 1 amplifies the target region with gene-specific primers containing partial adapter sequences. Step 2 adds full Illumina adapters and unique dual indices (barcodes) to each sample.
Materials & Reagents: See "The Scientist's Toolkit" below.
Procedure:
- Genomic DNA Extraction: Isolate high-quality, inhibitor-free genomic DNA from your sample (e.g., using a bead-beating kit for microbial communities). Quantify using a fluorometric method (e.g., Qubit).
- First-Stage PCR (Target Amplification):
- Reaction Setup (25µL):
- 12.5 µL High-Fidelity PCR Master Mix (2X)
- 2.5 µL Primer Mix (10µM forward + reverse primers with overhangs)
- 1-10 ng Genomic DNA Template
- Nuclease-free water to 25 µL.
- Thermocycling Conditions:
- 98°C for 30 sec (initial denaturation)
- 25 Cycles:
- 98°C for 10 sec (denaturation)
- 50-55°C (Tm-specific) for 30 sec (annealing)
- 72°C for 30 sec/kb (extension)
- 72°C for 5 min (final extension)
- 4°C hold.
- Reaction Setup (25µL):
- Amplicon Purification: Clean up the first-stage PCR products using magnetic bead-based purification (e.g., AMPure XP beads) to remove primers, dNTPs, and enzyme. Elute in Tris buffer.
- Second-Stage PCR (Indexing):
- Reaction Setup (50µL):
- 25 µL High-Fidelity PCR Master Mix (2X)
- 5 µL Primer Mix (Nextera XT Index Primers, i5 + i7, unique per sample)
- 5 µL Purified First-Stage PCR Product
- 15 µL Nuclease-free water.
- Thermocycling Conditions:
- 98°C for 30 sec
- 8-10 Cycles: (Keep cycles low to limit chimera formation)
- 98°C for 10 sec
- 55°C for 30 sec
- 72°C for 30 sec
- 72°C for 5 min
- 4°C hold.
- Reaction Setup (50µL):
- Indexed Library Purification: Perform a double-sided size selection with magnetic beads to remove primer dimers and fragments outside the desired size range (~550-650bp for V3-V4).
- Library Quantification & Normalization: Quantify the final library using qPCR (e.g., KAPA Library Quant Kit) for accurate molarity. Pool libraries at equimolar concentrations.
- Sequencing: Load the pooled library onto an Illumina sequencer (e.g., MiSeq with 2x300bp v3 chemistry for V3-V4 amplicons).
Title: 16S rRNA Amplicon Library Prep Workflow
The Scientist's Toolkit: Essential Research Reagent Solutions
Table 3: Key Reagents for 16S rRNA Amplicon Sequencing Experiments
| Item | Function & Rationale | Example Product(s) |
|---|---|---|
| High-Fidelity DNA Polymerase | PCR amplification with minimal error rates is critical to avoid sequencing artifacts that distort true diversity. | KAPA HiFi HotStart, Q5 High-Fidelity DNA Polymerase. |
| 16S rRNA Gene-Specific Primers | Designed against conserved regions to amplify the desired hypervariable segment from a broad range of taxa. | 341F/806R (V3-V4), 515F/926R (V4-V5). Must include Illumina adapter overhangs. |
| Dual Indexing Primer Kit | Allows unique combinatorial barcoding of each sample, enabling multiplexing of hundreds of samples in one run. | Illumina Nextera XT Index Kit v2, IDT for Illumina UD Indexes. |
| Magnetic Bead Purification Kit | For clean-up and size-selection of PCR products; removes primers, salts, and small fragments. | AMPure XP Beads, SPRISelect. |
| Fluorometric DNA Quant Kit | Accurate quantification of low-concentration DNA and final libraries is essential for pooling equimolarly. | Qubit dsDNA HS Assay, KAPA Library Quantification Kit (qPCR). |
| Standardized Mock Community | A defined mix of genomic DNA from known bacterial strains. Serves as a positive control and for benchmarking bioinformatic pipelines. | ZymoBIOMICS Microbial Community Standard. |
Title: 16S rRNA Gene Structure and Primer Binding
Limitations and the Path Forward
While the 16S rRNA gene is the universal barcode, its limitations must be acknowledged: 1) Lack of species/strain resolution due to high sequence similarity among some pathogens, 2) Multiple copy numbers (up to 15) can bias abundance estimates, and 3) PCR amplification biases. These challenges are driving the field toward complementary techniques such as shotgun metagenomics for functional insight and long-read sequencing (e.g., PacBio, Oxford Nanopore) for full-length 16S analysis, which provides superior taxonomic resolution. Nevertheless, the 16S rRNA gene remains the indispensable, robust, and standardized cornerstone of microbial ecology and diversity studies.
The evolution of DNA sequencing technology forms the cornerstone of modern microbial ecology and genomics, particularly within the context of 16S rRNA amplicon sequencing. This guide traces the technical progression from foundational methods to contemporary high-throughput platforms, providing the methodological backbone for researchers embarking on 16S rRNA amplicon studies.
The Sanger Sequencing Era
The chain-termination method, developed by Frederick Sanger in 1977, became the gold standard for decades. It relies on the selective incorporation of dideoxynucleotides (ddNTPs) during in vitro DNA replication, generating fragments of varying lengths that terminate at specific bases.
Key Experimental Protocol: Sanger Sequencing
- Template Preparation: Purify plasmid or PCR-amplified DNA.
- Sequencing Reaction: Set up four separate reactions, each containing:
- DNA template (100-500 ng)
- Primer (3.2 pmol)
- DNA polymerase (e.g., Sequenase)
- dNTP mix
- A single type of ddNTP (ddATP, ddTTP, ddCTP, or ddGTP) in a limiting concentration.
- Capillary Electrophoresis: Post-reaction, fragments are separated by size via capillary electrophoresis with a polymer matrix.
- Detection: Fluorescently labeled fragments are excited by a laser; the emitted wavelength identifies the terminal ddNTP, reconstructing the sequence.
The Next-Generation Sequencing (NGS) Revolution
The mid-2000s saw a paradigm shift with NGS platforms, enabling massive parallelization. Key innovations included in situ template amplification (bridge-PCR, emulsion PCR) and cyclic array sequencing (sequencing-by-synthesis or ligation).
Key NGS Platforms and Quantitative Comparison
| Platform (Generation) | Key Technology | Read Length (bp) | Output per Run (Gb) | Run Time | Primary Use in 16S Sequencing |
|---|---|---|---|---|---|
| Roche 454 (1st NGS) | Pyrosequencing | 700 | 0.7 | 24 hrs | Early 16S studies (long reads favored V1-V3). |
| Illumina MiSeq (2nd NGS) | Reversible dye-terminator SBS | 2x300 | 15 | 56 hrs | Current gold standard for 16S (V3-V4, V4). |
| Illumina NovaSeq (2nd NGS) | Patterned flow cell SBS | 2x150 | 10,000 | 44 hrs | Metagenomics, large-scale 16S population studies. |
| Ion Torrent PGM (2nd NGS) | Semiconductor pH detection | 400 | 2 | 4 hrs | Rapid 16S profiling (now largely supplanted). |
| PacBio SMRT (3rd Gen) | Real-time sequencing (ZMWs) | 10,000-60,000 | 20 | 4 hrs | Full-length 16S gene sequencing. |
| Oxford Nanopore (3rd Gen) | Nanopore electric signal | >10,000 | 50-100 | 1-72 hrs | Real-time, full-length 16S sequencing. |
Core NGS Protocol for 16S rRNA Amplicon Sequencing (Illumina)
- Primer Design: Design primers targeting hypervariable regions (e.g., V3-V4).
- Library Preparation:
- Perform PCR amplification of the target region from genomic DNA.
- Attach Illumina sequencing adapters and dual-index barcodes via a second, limited-cycle PCR.
- Clean up and normalize the amplified libraries.
- Cluster Generation: Denatured libraries are loaded onto a flow cell. Single-stranded fragments bind to complementary lawn primers and are amplified in situ via bridge-PCR to form clonal clusters.
- Sequencing-by-Synthesis:
- Fluorescently labeled, reversibly terminated nucleotides are added.
- A camera captures the fluorescence color of each cluster after each incorporation cycle.
- The terminator and fluorophore are cleaved, enabling the next cycle.
- Data Analysis: Base calling, demultiplexing by barcode, and generation of FASTQ files for downstream bioinformatic processing.
The Scientist's Toolkit: Key Reagent Solutions for 16S NGS
| Item | Function in 16S Amplicon Workflow |
|---|---|
| High-Fidelity DNA Polymerase | Accurate amplification of the 16S target region from complex community DNA with minimal bias. |
| Illumina-Compatible Indexed Adapters | Dual-index barcodes unique to each sample, enabling multiplexing and sample identification post-sequencing. |
| SPRI Beads | Solid-phase reversible immobilization beads for size-selective purification and cleanup of PCR products and final libraries. |
| PhiX Control Library | A well-characterized library spiked into runs (1-5%) to add diversity for Illumina's base calling calibration. |
| Qubit dsDNA HS Assay Kit | Fluorometric quantification of library DNA concentration, critical for accurate pooling and loading. |
| Bioanalyzer/TapeStation DNA Kits | Capillary electrophoresis for assessing library fragment size distribution and quality. |
| KAPA Library Quantification Kit | qPCR-based absolute quantification of "amplifiable" library molecules for precise flow cell loading. |
Logical Workflow: From Sample to Taxonomic Profile
Title: 16S Amplicon Sequencing Data Generation Workflow
Technical Comparison: Sequencing by Synthesis vs. Nanopore
Title: Core Sequencing Technology Comparison
The journey from Sanger's meticulous fragment analysis to today's massively parallelized, high-throughput platforms has fundamentally enabled the field of microbial ecology. For 16S rRNA amplicon sequencing, the Illumina platform's balance of high accuracy, throughput, and cost-effectiveness currently makes it the predominant choice, while third-generation long-read technologies are emerging for resolving full-length gene sequences. Understanding this technical evolution and the associated protocols is critical for designing robust, reproducible microbiome studies in drug development and clinical research.
Within the broader thesis of a 16S rRNA amplicon sequencing beginner guide, this whitepaper details how this foundational technique enables the discovery of links between the human microbiome and clinical phenotypes. 16S sequencing provides the taxonomic profile essential for generating hypotheses about microbial community dysbiosis, functional shifts, and their role in health, disease pathogenesis, and therapeutic outcomes.
Core Applications and Quantitative Insights
16S amplicon sequencing reveals correlations between microbial taxa and host conditions. The following tables summarize key findings.
Table 1: Microbial Taxa Associated with Human Disease States
| Disease/Condition | Associated Taxon (Genus/Species) | Relative Abundance Change vs. Healthy | Study Reference |
|---|---|---|---|
| Inflammatory Bowel Disease (IBD) | Faecalibacterium prausnitzii | Decrease (↓ ~5-10x) | (Sokol et al., 2008) |
| Type 2 Diabetes | Roseburia spp. | Decrease (↓ ~2-4x) | (Qin et al., 2012) |
| Colorectal Cancer | Fusobacterium nucleatum | Increase (↑ ~10-100x) | (Kostic et al., 2012) |
| Atopic Dermatitis | Staphylococcus aureus | Increase (↑ ~10-50x) | (Kong et al., 2012) |
| Clostridioides difficile Infection | Overall Diversity | Decrease (Shannon Index ↓ 2.0) | (Chang et al., 2008) |
Table 2: Microbiome Modulation by Pharmaceutical Agents
| Drug Class/Drug | Key Microbiome Impact | Potential Consequence for Drug Response | Study Reference |
|---|---|---|---|
| Proton Pump Inhibitors (e.g., Omeprazole) | Increase in oral/gastric microbes in gut | Altered bioavailability; side effects | (Imhann et al., 2016) |
| Metformin | Enrichment of Akkermansia muciniphila | May mediate therapeutic efficacy | (Wu et al., 2017) |
| Immune Checkpoint Inhibitors (Anti-PD-1) | High gut diversity & Akkermansia presence | Correlates with improved oncology outcomes | (Routy et al., 2018) |
| Antibiotics (Broad-spectrum) | Drastic reduction in diversity & keystone taxa | Risk of secondary infection (e.g., C. diff) | (Dethlefsen & Relman, 2011) |
Experimental Protocols for Key Applications
Protocol 1: Case-Control Dysbiosis Study
Objective: Identify taxa differentially abundant between disease and healthy cohorts.
- Sample Collection: Collect sterile fecal swabs or stool from matched case/control groups. Store immediately at -80°C.
- DNA Extraction: Use a bead-beating lysis kit (e.g., Qiagen PowerSoil) to ensure Gram-positive bacterial lysis. Include extraction controls.
- 16S rRNA Gene Amplification: Amplify the V3-V4 hypervariable region using primers 341F (5'-CCTAYGGGRBGCASCAG-3') and 806R (5'-GGACTACNNGGGTATCTAAT-3') with attached Illumina adapters. Use a proofreading polymerase.
- Library Preparation & Sequencing: Clean amplicons, attach dual indices, pool equimolarly, and sequence on Illumina MiSeq (2x300 bp).
- Bioinformatic Analysis: Process using QIIME 2 (2024.2). Demultiplex, denoise with DADA2, assign taxonomy via SILVA v138 classifier, and perform differential abundance analysis (e.g., ANCOM-BC, DESeq2 on ASV counts).
Protocol 2: Pharmacomicrobiomics Cohort Study
Objective: Assess pre-treatment microbiome as a biomarker for drug efficacy/toxicity.
- Baseline Sampling: Collect stool from patients prior to drug initiation (e.g., chemotherapy, immunotherapy).
- Longitudinal Sampling: Collect serial samples during treatment at defined time points.
- Sequencing & Core Analysis: Follow Protocol 1 steps for sequencing and taxonomic profiling.
- Correlative Analysis: Integrate clinical metadata (e.g., Response Evaluation Criteria in Solid Tumors (RECIST) scores, adverse events). Use multivariate statistics (PERMANOVA on UniFrac distances) to test for association between baseline microbiome clusters and outcomes. Build predictive models using Random Forest regression.
Visualization of Pathways and Workflows
Title: Drug-Microbiome-Host Interaction Pathway
Title: 16S Workflow for Biomarker Discovery
The Scientist's Toolkit: Research Reagent Solutions
Table 3: Essential Materials for 16S-Based Microbiome Studies
| Item | Function in Protocol | Example Product |
|---|---|---|
| Sterile Stool Collection Kit | Ensures standardized, stabilized, and anaerobic sample preservation for accurate community profiling. | OMNIgene•GUT (DNA Genotek) |
| Bead-Beating Lysis Kit | Mechanical and chemical disruption of tough microbial cell walls for unbiased DNA yield. | Qiagen DNeasy PowerSoil Pro Kit |
| PCR Inhibitor Removal Beads | Removes humic acids, bile salts from complex samples, improving PCR success. | Zymo Research OneStep PCR Inhibitor Removal Kit |
| High-Fidelity DNA Polymerase | Reduces PCR errors in amplicon generation, critical for accurate ASV inference. | KAPA HiFi HotStart ReadyMix |
| Mock Microbial Community (Control) | Validates entire workflow from extraction to bioinformatics for quality control. | ZymoBIOMICS Microbial Community Standard |
| Indexed Adapter Primers | Allows multiplexing of hundreds of samples in a single sequencing run. | Illumina Nextera XT Index Kit v2 |
| Quantitative DNA Standard | Enables precise library quantification for equimolar pooling, ensuring balanced sequencing depth. | KAPA Library Quantification Kit |
| Positive Control 16S Plasmid | Serves as a control for the amplification step, confirming primer functionality. | ATCC 16S rRNA Gene Standards |
Within the context of a beginner's guide to 16S rRNA amplicon sequencing research, mastering core terminology is fundamental. This technical guide details essential concepts that form the analytical backbone of microbial ecology studies, enabling researchers, scientists, and drug development professionals to interpret data, design robust experiments, and derive biologically meaningful insights.
Operational Taxonomic Units (OTUs) vs. Amplicon Sequence Variants (ASVs)
The fundamental step in 16S analysis is grouping sequencing reads into biologically relevant units. Historically, Operational Taxonomic Units (OTUs) were the standard, but Amplicon Sequence Variants (ASVs) represent a paradigm shift toward higher resolution.
OTUs: Clusters of sequences based on a user-defined percent similarity threshold (typically 97%), intended to approximate species-level groupings. Clustering is heuristic and can merge distinct biological sequences, introducing noise. ASVs: Exact, single-nucleotide resolution sequences inferred from reads via error-correction algorithms (e.g., DADA2, Deblur). ASVs are reproducible and can be tracked across studies without reliance on arbitrary thresholds.
| Feature | OTUs (97% Clustering) | ASVs |
|---|---|---|
| Definition Basis | Clustered by similarity (%) | Exact biological sequence |
| Resolution | Lower (within-cluster variation lost) | High (single-nucleotide) |
| Reproducibility | Low (varies with algorithm, database) | High (deterministic) |
| Computational Method | Heuristic clustering (e.g., VSEARCH, CD-HIT) | Error modeling & inference (e.g., DADA2, Deblur) |
| Downstream Impact | Inflated diversity; merged taxa | Precise diversity; enables strain-level tracking |
| Typical Abundance | ~10-50% of reads may be chimeric or erroneous | <1% estimated error rate post-correction |
Protocol: DADA2 Pipeline for ASV Inference (Key Steps)
- Filter & Trim: Remove low-quality bases and trim primers using
filterAndTrim(e.g., truncLen=c(240,160), maxN=0, maxEE=c(2,2)). - Learn Error Rates: Model sequencing error rates from data using
learnErrors. - Dereplicate: Collapse identical reads with
derepFastq. - Sample Inference: Core algorithm applies error model to infer true biological sequences (
dada). - Merge Paired Reads: Merge forward/reverse reads with
mergePairs. - Construct Sequence Table: Build ASV abundance table across samples.
- Remove Chimeras: Identify/remove PCR chimeras with
removeBimeraDenovo.
Taxa and Taxonomy Assignment
Following ASV/OTU generation, sequences are classified into a taxonomic hierarchy (e.g., Kingdom, Phylum, Class, Order, Family, Genus, Species). Assignment is performed by comparing sequences to curated reference databases.
| Common Reference Database | Primary Scope | Key Features |
|---|---|---|
| SILVA | Broad (Bacteria, Archaea, Eukarya) | Manually curated, regularly updated, includes aligned sequences. |
| Greengenes | 16S rRNA (Bacteria, Archaea) | Legacy, phylogenetically consistent but not updated since 2013. |
| RDP | 16S rRNA (Bacteria, Archaea) | High-quality, trained classifier; frequently used with Naïve Bayes method. |
| NCBI RefSeq | Comprehensive | Broad coverage, includes genomes; can be used for BLAST-based assignment. |
Protocol: Taxonomy Assignment with a Classifier
- Database Preparation: Download and format a reference database (e.g., SILVA release 138.1).
- Classifier Training (Optional): For RDP classifier, train on the database using
trainfunction. - Assignment: Assign taxonomy to ASV sequences using a tool like
assignTaxonomyin DADA2 (implements RDP classifier) oridTaxain DECIPHER. Typical parameters:minBoot=80(minimum bootstrap confidence). - Species-Level Assignment (Optional): Perform exact matching to curated species references using
addSpecies.
Alpha and Beta Diversity
Diversity metrics quantify microbial community structure.
Alpha Diversity: Measures richness (number of taxa) and evenness (relative abundance distribution) within a single sample. Beta Diversity: Measures the dissimilarity in community composition between samples.
| Metric Type | Name | Formula / Concept | Interpretation | ||||
|---|---|---|---|---|---|---|---|
| Alpha (Richness) | Observed ASVs | S = Count of distinct ASVs | Simple count of taxa. | ||||
| Chao1 | S_chao1 = S_obs + (F1²/(2F2))* | Estimates total richness, correcting for unseen rare taxa. | |||||
| Shannon (H') | H' = -Σ(p_i * ln(p_i)) | Combines richness and evenness. Higher = more diverse. | |||||
| Alpha (Evenness) | Pielou's Evenness | J' = H' / ln(S) | How evenly abundances are distributed (0 to 1). | ||||
| Beta Diversity | Jaccard | *1 - ( | A∩B | / | A∪B | )* | Presence/absence dissimilarity. |
| Bray-Curtis | 1 - (2Σmin(Ai, Bi) / (ΣAi + ΣBi))* | Abundance-weighted dissimilarity (0 to 1). Most common. | |||||
| UniFrac | Phylogenetic distance between communities | Weighted (accounts for abundance) vs. Unweighted (presence/absence). |
Experimental Protocol: Calculating Diversity Metrics with QIIME 2
- Rarefaction: Rarefy ASV table to even sequencing depth using
qiime feature-table rarefy. - Alpha Diversity: Calculate metrics:
qiime diversity alpha --i-table rarefied_table.qza --p-metric observed --p-metric shannon. - Beta Diversity: Calculate distance matrix:
qiime diversity beta --i-table rarefied_table.qza --p-metric braycurtis. - Visualization: Create Emperor PCoA plot:
qiime emperor plot --i-pcoa bray_curtis_pcoa_results.qza --m-metadata-file metadata.tsv.
Phylogeny and Phylogenetic Analysis
Phylogenetic analysis uses evolutionary relationships to inform diversity metrics and tree visualization.
Phylogenetic Tree Construction Protocol (FastTree)
- Multiple Sequence Alignment: Align ASV sequences using MAFFT or MUSCLE (
qiime alignment mafft). - Mask Hypervariable Regions: Remove highly variable positions to reduce noise (
qiime alignment mask). - Build Tree: Construct a phylogenetic tree using a maximum-likelihood method like FastTree (
qiime phylogeny fasttree). - Root the Tree: Root the tree at midpoint or using an outgroup (
qiime phylogeny midpoint-root). - Usage: The resulting tree is used to calculate phylogenetic diversity (Faith's PD) and phylogenetic beta-diversity metrics (UniFrac).
The Scientist's Toolkit: Key Research Reagent Solutions
| Item | Function in 16S Amplicon Sequencing |
|---|---|
| PCR Primers (e.g., 515F-806R) | Target hypervariable regions (V4) of the 16S rRNA gene for amplification. |
| High-Fidelity DNA Polymerase | Ensures accurate amplification with low error rates during PCR. |
| Dual-Index Barcodes & Adapters | Unique nucleotide sequences added to amplicons for sample multiplexing and NGS platform compatibility. |
| SPRI Beads | Magnetic beads for size selection and purification of amplicon libraries. |
| Quant-iT PicoGreen dsDNA Assay | Fluorometric method for precise quantification of library DNA concentration. |
| PhiX Control v3 | Spiked into runs on Illumina platforms for error rate monitoring and base calling calibration. |
| ZymoBIOMICS Microbial Community Standard | Defined mock community used as a positive control to assess sequencing and bioinformatics accuracy. |
Visualizations
Title: 16S rRNA Amplicon Data Analysis Core Workflow
Title: Conceptual Relationship of Alpha and Beta Diversity
Within the context of a comprehensive 16S rRNA amplicon sequencing beginner guide, this whitepaper addresses a pivotal question: what are the boundaries of inference for this ubiquitous technique? While often the first tool deployed in microbiome research, 16S sequencing is not a panacea. A clear understanding of its inherent capabilities and constraints is essential for researchers, scientists, and drug development professionals to design robust studies and interpret data accurately.
Core Capabilities: The Analytical Strengths
16S rRNA gene sequencing is powerful for addressing specific, taxonomy-focused questions.
- Microbial Community Profiling: It provides a cost-effective census of bacterial and archaeal community membership.
- Relative Abundance Estimation: It quantifies the proportional composition of taxa within a sample.
- Alpha and Beta Diversity Analysis: It measures within-sample richness (alpha) and between-sample compositional differences (beta).
- Differential Abundance Testing: It identifies taxa that significantly differ in abundance between defined sample groups.
- Phylogenetic Inference: The conserved and variable regions allow for phylogenetic tree construction, informing evolutionary relationships.
Table 1: Quantitative Performance Metrics of Common 16S Sequencing Platforms (Current as of 2023-2024)
| Platform (Kit/Chemistry) | Read Length (bp) | Approx. Reads/Run | Key Strength | Best for Region(s) |
|---|---|---|---|---|
| Illumina MiSeq v3 (2x300) | 2 x 300 | ~25 million | High-quality, paired-end; gold standard | Full V3-V4, V4 |
| Illumina iSeq 100 | 2 x 150 | ~4 million | Low-cost, rapid turnaround | V4 |
| Illumina NovaSeq (16S kits) | 2 x 250 | Billions | Extreme multiplexing (1000s of samples) | Any single region |
| PacBio HiFi (Circular Consensus) | ~1,450 | 500k-1M | Full-length 16S gene; species-level resolution | Full-length (V1-V9) |
| Ion Torrent GeneStudio S5 | Up to 600 | 60-80 million | Fast run time | V2-V4, V4-V6 |
Inherent Limitations and Boundaries of Inference
Critical study design and interpretation hinge on recognizing what 16S data cannot reveal.
- Cannot Provide Species- or Strain-Level Resolution: The ~500 bp amplicon lacks sufficient discriminatory power for many closely related species or strains with critical functional differences (e.g., pathogenic vs. commensal E. coli).
- Does Not Measure Absolute Abundance: Data is compositional (relative percentages). A 50% decrease in Taxon A could mean it died or that Taxon B doubled.
- Cannot Directly Infer Functional Potential: While tools like PICRUSt2 predict function, they are inferences based on genomic databases, not measurements of expressed genes or proteins.
- Primer Bias Limits Detection: Universal primers are not truly universal; amplification efficiency varies across taxa, skewing observed abundances.
- Excludes Key Kingdoms: The 16S gene is absent in eukaryotes (fungi, protists) and viruses, providing an incomplete picture of the microbiome.
Table 2: Comparison of Microbiome Profiling Techniques
| Aspect | 16S rRNA Amplicon | Shotgun Metagenomics | Metatranscriptomics |
|---|---|---|---|
| Taxonomic Resolution | Genus, sometimes species | Species, strain-level possible | Species, strain-level possible |
| Functional Insight | Inferred only | Gene catalog & potential | Active gene expression |
| Absolute Quantification | No | With spike-in standards | With spike-in standards |
| Host DNA Reads | Minimal | High (often >90%) | High |
| Cost per Sample | $ | $$$ | $$$$ |
| Bioinformatic Complexity | Moderate | High | Very High |
Experimental Protocol: Standard 16S Amplicon Sequencing Workflow
Protocol: Library Preparation via 2-Step PCR (Illumina)
- Genomic DNA Extraction: Use a bead-beating mechanical lysis kit (e.g., DNeasy PowerSoil Pro) to ensure robust lysis of Gram-positive bacteria.
- Primary PCR (Amplification):
- Reagents: Template DNA, region-specific primers with overhang adapters (e.g., 341F/805R for V3-V4), high-fidelity polymerase (e.g., KAPA HiFi), dNTPs, buffer.
- Cycling: 95°C 3 min; 25-35 cycles of: 95°C 30s, 55°C 30s, 72°C 30s; final 72°C 5 min.
- Purpose: Amplify target 16S region; low cycle count minimizes chimera formation.
- PCR Clean-up: Use magnetic bead-based purification (e.g., AMPure XP).
- Index PCR (Barcoding):
- Reagents: Purified amplicon, Nextera XT index primers, polymerase.
- Cycling: 95°C 3 min; 8 cycles of: 95°C 30s, 55°C 30s, 72°C 30s; final 72°C 5 min.
- Purpose: Attach unique dual indices and full Illumina sequencing adapters.
- Second Clean-up & Normalization: Pool libraries using a fluorometric quantitation (e.g., PicoGreen) and bead-based normalization kit.
- Sequencing: Load pooled library on Illumina MiSeq or iSeq with appropriate PhiX spike-in (~10-20%) for low-diversity library calibration.
Diagram 1: 16S Amplicon Library Prep Workflow (76 chars)
The Scientist's Toolkit: Essential Research Reagents & Materials
Table 3: Key Research Reagent Solutions for 16S Sequencing
| Item | Example Product/Kit | Primary Function |
|---|---|---|
| Inhibitor-Removing DNA Extraction Kit | DNeasy PowerSoil Pro (Qiagen) | Mechanical/chemical lysis; removes humic acids, salts common in environmental/soil samples. |
| High-Fidelity DNA Polymerase | KAPA HiFi HotStart (Roche) | High-accuracy amplification with low error rates, critical for reducing sequencing artifacts. |
| 16S Primers with Overhangs | 341F/805R (Klindworth et al. 2013) | Target-specific amplification of the V3-V4 region while adding Illumina adapter overhangs. |
| Magnetic Bead Clean-up Kit | AMPure XP Beads (Beckman Coulter) | Size-selective purification of PCR products and final libraries, removing primers and dimers. |
| Library Quantitation Kit | Qubit dsDNA HS Assay (Thermo Fisher) | Fluorometric quantification specific to double-stranded DNA, more accurate than spectrophotometry. |
| Indexing Primers | Nextera XT Index Kit v2 (Illumina) | Provides unique dual indices (barcodes) for multiplexing samples on a single sequencing run. |
| Sequencing Control | PhiX Control v3 (Illumina) | Low-diversity spike-in control for base calling calibration and run quality monitoring. |
| Positive Control DNA | ZymoBIOMICS Microbial Community Standard (Zymo) | Defined mock community for validating entire wet-lab and bioinformatics pipeline accuracy. |
The Inference Pathway: From Sequence to Biological Claim
The journey from raw data to biological interpretation involves critical steps where limitations must be acknowledged.
Diagram 2: Inference Pathway and Key Caveats (78 chars)
16S rRNA amplicon sequencing is a powerful, accessible tool for microbial ecology and initial biomarker discovery. Its strengths lie in efficient, high-throughput taxonomic profiling. Its fundamental limitations—lack of absolute abundance, strain resolution, and direct functional data—define its role as a premier hypothesis-generating tool. In drug development and rigorous research, significant findings from 16S data typically require validation via complementary techniques (e.g., qPCR for absolute quantification, shotgun metagenomics, or culture-based assays) to move from correlation to causation and mechanistic insight. A beginner's guide must emphasize this balanced perspective to ensure scientifically sound applications of the technology.
The 16S rRNA Sequencing Workflow: A Step-by-Step Protocol from Lab to Analysis
In the landscape of 16S rRNA gene amplicon sequencing for microbiome research, meticulous planning in the initial pre-sequencing phase is paramount. This phase, often overlooked by beginners, dictates the biological relevance and statistical robustness of the entire study. Framed within a comprehensive beginner's guide, this technical whitepaper details the first critical step: formulating a testable hypothesis and designing a well-defined cohort. These foundational decisions directly determine the choice of sequencing platform, bioinformatic pipelines, and, ultimately, the validity of the conclusions drawn about microbial community structure and function.
Defining a Testable Microbial Hypothesis
A precise hypothesis moves the study from a fishing expedition to a targeted investigation. The hypothesis must be specific, measurable, and grounded in ecological or physiological theory.
Common Hypothesis Frameworks in 16S Studies:
- Differential Abundance: "The relative abundance of genus Bifidobacterium is significantly lower in stool samples from patients with active ulcerative colitis (UC) compared to healthy controls."
- Alpha Diversity Shift: "Antibiotic treatment reduces the within-sample microbial alpha diversity (Shannon Index) in the murine gut microbiome."
- Beta Diversity Dissimilarity: "The microbial community composition (beta diversity) of the skin microbiome is significantly different between psoriasis lesion and non-lesion sites."
- Taxonomic Covariance: "The abundance of Faecalibacterium prausnitzii is positively correlated with the abundance of Roseburia spp. in the healthy human gut."
Experimental Protocol: Hypothesis Scoping & Feasibility Assessment
- Literature Review: Conduct a systematic search using PubMed/MEDLINE with keywords combining your target condition (e.g., "Crohn's disease"), site ("ileal mucosa"), and "16S rRNA" or "microbiome." Use tools like Google Scholar's "Alerts" for recent publications.
- Public Data Mining: Explore existing 16S datasets in repositories like the NIH Human Microbiome Project (HMP), Qiita, or the European Nucleotide Archive (ENA) to gauge effect sizes and variability for power calculations.
- Hypothesis Statement Drafting: Using the PICO framework (Population, Intervention/Exposure, Comparison, Outcome), draft the hypothesis. Example: P (IBD patients), I (ileal resection), C (IBD patients without resection), O (microbial dysbiosis index).
- Consultation with Biostatistician: Before cohort design, discuss the hypothesis, potential confounding variables (age, BMI, diet), and expected outcome measures to inform sample size calculation.
Cohort Design & Sample Size Calculation
A well-defined cohort minimizes confounding and ensures results are attributable to the variable of interest.
Key Cohort Design Considerations:
| Consideration | Description | Example & Rationale |
|---|---|---|
| Inclusion/Exclusion Criteria | Explicit rules for participant selection. | Include: Diagnosis confirmed by colonoscopy. Exclude: Use of antibiotics within 8 weeks. (Controls for major confounders). |
| Case-Control vs. Longitudinal | Snapshot vs. time-series design. | Case-Control: Compare CRC patients vs. healthy controls. Longitudinal: Sample patients before, during, and after chemotherapy. |
| Confounding Variables | Factors that may independently affect the microbiome. | Primary: Age, Sex, BMI. Study-Specific: Dietary fiber intake, recent travel, medication (PPIs). Must be recorded and controlled for statistically. |
| Sample Size (Power) | Number of biological replicates per group. | Calculated based on expected effect size (e.g., difference in Shannon index) and variability from pilot/literature. |
| Sample Type & Collection | Matches hypothesis and standardizes pre-analytics. | Stool (total community), mucosal biopsy (mucosa-associated), saliva (oral). Use standardized kits (see Toolkit). |
Quantitative Data for Sample Size Estimation (Examples) Table 1: Example Effect Sizes from Published 16S Studies for Power Calculation
| Study Focus (Group1 vs. Group2) | Primary Outcome Metric | Observed Effect Size | Estimated SD (per group) | Recommended N/group (80% power, α=0.05)* |
|---|---|---|---|---|
| Obese vs. Lean Gut Microbiome | Shannon Index Difference | Δ = 0.5 | 0.4 | ~ 21 |
| Healthy vs. Periodontitis Oral | Unweighted UniFrac Distance | Δ = 0.15 | 0.05 | ~ 6 |
| Antibiotic-Treated vs. Control (Mouse) | Relative Abundance of a Taxon | 5% vs. 20% | 7% | ~ 17 |
*Calculations assume two-sided t-test; actual analysis often uses PERMANOVA for beta diversity, requiring simulation-based power analysis.
Experimental Protocol: Sample Size Calculation via Simulation (using R & vegan)
The Scientist's Toolkit: Essential Reagents & Materials
Table 2: Key Research Reagent Solutions for Pre-Sequencing Phase
| Item | Function & Importance | Example Product/Brand |
|---|---|---|
| Stabilization & Collection Kit | Preserves microbial genomic DNA at point of collection, inhibiting degradation and overgrowth. Critical for reproducibility. | OMNIgene•GUT (feces), Zymo DNA/RNA Shield (tissue), Norgen Stool Preservative |
| DNA Extraction Kit (with Bead Beating) | Robust cell lysis of Gram-positive bacteria and consistent inhibitor removal. Highest source of technical variability. | Qiagen DNeasy PowerSoil Pro Kit, MP Biomedicals FastDNA SPIN Kit, ZymoBIOMICS DNA Miniprep Kit |
| PCR Polymerase for 16S Amplicons | High-fidelity, low-bias polymerase to minimize chimera formation and amplify the hypervariable region (e.g., V4). | KAPA HiFi HotStart ReadyMix, Q5 High-Fidelity DNA Polymerase |
| Barcoded Primers & Indexing Kit | Attach unique sample barcodes during PCR for multiplexing. Dual indexing is now standard to reduce index hopping errors. | Illumina Nextera XT Index Kit v2, Integrated DNA Technologies (IDT) for Illumina 16S Panels |
| Quantification & QC Assay | Accurate quantification of low-concentration, inhibitor-free amplicon libraries. | Invitrogen Qubit dsDNA HS Assay, Agilent TapeStation HS D1000 ScreenTape |
| Positive Control (Mock Community) | Defined mix of known bacterial genomic DNA. Essential for validating entire wet-lab and bioinformatic pipeline. | ZymoBIOMICS Microbial Community Standard, ATCC Mock Microbial Communities |
Visualizing the Decision Workflow
Title: Pre-Sequencing Decision Workflow for 16S Studies
Title: Confounding Variables & Causal Inference in Cohort Design
Accurate 16S rRNA amplicon sequencing data is fundamentally dependent on the initial steps of sample collection and storage. The integrity of the microbial community structure—the very target of this beginner-level research method—can be irrevocably compromised by inappropriate handling prior to DNA extraction. This guide details the technical best practices to minimize bias and preserve the true microbial composition from the moment of collection.
Critical Pre-Collection Considerations
Prior to sampling, a detailed Standard Operating Procedure (SOP) must be established. Key considerations include:
- Sample Type: Practices differ vastly for fecal, skin, soil, water, or mucosal samples.
- Environmental Controls: Document temperature, pH, and exposure to oxygen at the collection site.
- Contaminant Avoidance: Plan to mitigate host DNA, human skin flora, and reagent contaminants (e.g., kitome).
Best Practices by Sample Matrix
Human Fecal Samples
The gold standard for gut microbiome research.
Detailed Protocol:
- Collection: Use a sterile collection container with no preservatives. A sterile fecal collection tube with a spoon attached to the lid is recommended.
- Homogenization: Gently mix the sample to ensure heterogeneity.
- Aliquoting: Immediately aliquot into multiple cryovials to avoid repeated freeze-thaw cycles.
- Preservation: Add a stabilizing solution (e.g., RNAlater, Zymo DNA/RNA Shield) if immediate freezing is not possible.
- Storage: Flash-freeze aliquots in liquid nitrogen or a dry ice/ethanol bath, then transfer to -80°C for long-term storage within 4 hours of collection.
Swab-Based Samples (Skin, Oral, Nasal)
Detailed Protocol:
- Swab Type: Use standardized, sterile, synthetic tip swabs (e.g., nylon-flocked). Avoid cotton swabs which can inhibit PCR.
- Collection: Use a consistent pressure and rotation technique. For skin, pre-moisten swab with a sterile saline or buffer solution.
- Transfer: Immediately place the swab head into a sterile tube containing a stabilization buffer. Vortex or vigorously shake to release biomass.
- Storage: Store tubes at -80°C. Short-term storage (≤24h) at -20°C may be acceptable.
Environmental Samples (Soil, Water)
Detailed Protocol for Soil:
- Collection: Use sterile corers or spatulas. Collect multiple sub-samples from a site for a composite sample.
- In-Situ Processing: Sieve (e.g., 2mm mesh) to remove rocks and debris. Homogenize thoroughly.
- Preservation: Subsample into pre-weighed tubes. For metabolically active profiling, flash freeze in liquid nitrogen. Alternatively, use silica gel or specialized preservation tubes (e.g., MoBio PowerSoil bead tubes).
- Storage: Store at -80°C.
Quantitative Impact of Storage Conditions on Microbial Integrity
The following table summarizes key findings from recent studies on storage conditions and their impact on 16S sequencing outcomes.
Table 1: Impact of Sample Storage Conditions on Microbial Community Analysis
| Sample Type | Storage Condition | Temp (°C) | Max Recommended Duration | Key Observed Bias (16S rRNA) | Supporting Study (Example) |
|---|---|---|---|---|---|
| Human Feces | Immediate Freeze | -80 | Long-term (years) | Minimal change in alpha/beta diversity. | Gorzelak et al., 2015 |
| Human Feces | Room Temp (No Buffer) | 25 | < 24 hours | Significant shifts; increase in Enterobacteriaceae. | Choo et al., 2015 |
| Human Feces | In Stabilization Buffer | 25 | 7-30 days | Preserves community structure effectively. | Vandeputte et al., 2017 |
| Skin Swab | Dry Swab at -20 | -20 | 2 weeks | Moderate increase in Actinobacteria. | Lauber et al., 2010 |
| Soil | Lyophilized | Ambient | Long-term | Stable for diversity, not for functional genes. | Rubin et al., 2013 |
| Sea Water | Filtration + -80 | -80 | Long-term | Preferred over chemical fixation. | Neaves et al., 2021 |
The Scientist's Toolkit: Research Reagent Solutions
Table 2: Essential Reagents for Sample Preservation
| Item | Primary Function | Key Considerations for 16S Studies |
|---|---|---|
| DNA/RNA Shield (e.g., Zymo) | Inactivates nucleases, stabilizes nucleic acids at room temp. | Prevents overgrowth and community shifts during shipping. Compatible with downstream DNA extraction kits. |
| RNAlater | Stabilization solution for RNA/DNA. | Can inhibit some DNA extraction enzymes; requires a washing step. May bias against certain Gram-positive bacteria. |
| MoBio PowerBead Tubes | Contains beads for mechanical lysis during extraction. | Allows soil/sludge samples to be stored in the lysis tube at -80°C post-collection. |
| Anaeropouch | Creates an anaerobic environment for collection. | Critical for obligate anaerobes (e.g., in gut samples) if processing is delayed >30 mins. |
| Cryoprotectants (e.g., Glycerol) | Prevents ice crystal formation during freezing. | Used for preserving live bacterial cultures; not typically for direct community DNA storage. |
Integrated Workflow for Optimal Preservation
The following diagram illustrates the critical decision points in a sample handling workflow designed to preserve microbial integrity for 16S sequencing.
Decision Workflow for Sample Preservation
Experimental Protocol: Validating Storage Conditions
For researchers establishing a new biobank, validating the chosen storage protocol is essential.
Title: Protocol for Assessing Storage-Induced Bias in Fecal Microbiome Samples.
Objective: To compare the effects of different short-term storage conditions on the fidelity of microbial community profiles obtained via 16S rRNA gene sequencing.
Methods:
- Sample Collection: Collect a fresh, homogeneous human fecal sample under an IRB-approved protocol.
- Experimental Aliquoting: Immediately aliquot the sample into 6 treatment groups (n=5 per group):
- Group 1 (Gold Standard): Flash frozen in liquid N₂, stored at -80°C.
- Group 2: Held at 4°C for 24h, then -80°C.
- Group 3: Held at room temperature (22°C) for 24h, then -80°C.
- Group 4: Placed in DNA/RNA Shield, held at 22°C for 7 days, then -80°C.
- Group 5: Placed in 25% glycerol, stored at -80°C.
- Group 6: Stored at -20°C for 1 week, then -80°C.
- DNA Extraction: After the storage period, extract DNA from all aliquots using the same standardized kit (e.g., QIAamp PowerFecal Pro DNA Kit). Include extraction blanks.
- 16S rRNA Gene Sequencing: Amplify the V4 region using 515F/806R primers with dual-index barcodes. Perform sequencing on an Illumina MiSeq platform (2x250 bp).
- Bioinformatic & Statistical Analysis:
- Process reads using QIIME 2 or DADA2 to generate Amplicon Sequence Variants (ASVs).
- Calculate alpha diversity metrics (Shannon, Faith's PD) and beta diversity (UniFrac distances).
- Perform PERMANOVA on beta diversity distances to test for significant clustering by storage group.
- Identify differentially abundant taxa between each group and the Gold Standard (Group 1) using tools like ANCOM-BC or DESeq2.
Expected Outcome: This protocol will quantify the degree of taxonomic bias introduced by suboptimal storage, providing empirical justification for the chosen SOP.
Within the context of a comprehensive guide to 16S rRNA amplicon sequencing, DNA extraction is the critical first step that predetermines the success or failure of the entire study. The choice of extraction method and its execution directly influence the observed microbial community composition, introducing bias through differential cell lysis efficiency and co-extraction of host or environmental contaminants. For researchers and drug development professionals, a strategic approach to nucleic acid isolation is essential for generating reliable, interpretable data.
Mechanisms of Bias and Contamination
Bias in 16S sequencing can originate during extraction from two primary mechanisms: 1) Differential Lysis: Bacterial cell wall structures vary significantly. Gram-positive bacteria, with thick peptidoglycan layers, often require more rigorous mechanical or chemical lysis than Gram-negative species. Kits or protocols optimized for one group may under-represent the other. 2) Host DNA Contamination: In host-associated samples (e.g., tissue, blood, biopsies), mammalian DNA can constitute >99% of the total extracted nucleic acid, drastically reducing sequencing depth for the target microbial DNA and increasing cost and analysis complexity.
Kit Selection: A Quantitative Comparison
The ideal kit maximizes microbial DNA yield, maintains community representativeness, and minimizes co-purification of inhibitors and host DNA. The table below summarizes key performance metrics for leading kits, as evaluated in recent comparative studies.
Table 1: Performance Comparison of Commercial DNA Extraction Kits for 16S rRNA Studies
| Kit Name | Primary Lysis Mechanism | Avg. Yield (ng DNA/g stool) | Host DNA Reduction | Inhibition Removal | Gram+ Lysis Efficiency | Best For |
|---|---|---|---|---|---|---|
| QIAamp PowerFecal Pro | Mechanical (Bead Beating) + Chemical | 450 ± 120 | Medium | High | High | Complex, diverse samples (soil, stool) |
| DNeasy PowerLyzer Powersoil | Intensive Mechanical Bead Beating | 520 ± 150 | Medium | Very High | Very High | Tough-to-lyse organisms (spores, Gram+) |
| MagMAX Microbiome Ultra | Bead Beating + Selective Binding | 400 ± 90 | Very High | High | High | Host-dominated samples (tissue, blood) |
| ZymoBIOMICS DNA Miniprep | Bead Beating + Inhibitor Removal | 380 ± 80 | Medium | Very High | High | Standardized microbiome profiling |
| MO BIO PowerSoil (DNeasy) | Bead Beating + Silica Membrane | 480 ± 130 | Low | High | High | Environmental samples with humics |
Note: Yield data are approximate averages from published comparisons; actual performance is sample-dependent.
Detailed Protocol: Selective Depletion of Host DNA
For host-associated samples, a two-step protocol integrating selective lysis and enzymatic depletion is recommended.
Protocol: Sequential Lysis and Host DNA Depletion for Tissue Biopsies
- Soft Lysis (Microbial DNA Release): Homogenize 25 mg of tissue in 500 µL of gentle lysis buffer (e.g., 10mM Tris-HCl, 1mM EDTA, 1% Triton X-100, lysozyme 20 mg/mL). Incubate at 37°C for 30 minutes with gentle agitation. This preferentially lyses mammalian cells and some Gram-negative bacteria.
- Centrifugation and Supernatant Transfer: Centrifuge at 2,000 x g for 5 min at 4°C. Transfer the supernatant, containing released host DNA and microbial DNA, to a new tube.
- Bead Beating (Resistant Cell Lysis): To the pellet, add 300 µL of specialized, inhibitor-tolerant lysis buffer and a mixture of 0.1mm and 0.5mm silica/zirconia beads. Process in a bead beater for 3 cycles of 1 minute at high speed, with 1-minute rests on ice between cycles.
- Combine Lysates: Combine the supernatant from Step 2 with the lysate from Step 3.
- Enzymatic Host DNA Depletion: Add 2 µL of benzonase (25 U/µL) and 5 µL of plasmid-safe ATP-dependent DNase (10 U/µL) to the combined lysate. Incubate at 37°C for 60 minutes. These enzymes preferentially degrade linear (host) DNA while protecting circular or protected microbial DNA.
- Standard Column-Based Purification: Proceed with purification using the column-binding chemistry of your selected kit (e.g., MagMAX Microbiome Ultra), following the manufacturer's instructions, which will capture the remaining intact DNA.
The Scientist's Toolkit: Research Reagent Solutions
Table 2: Essential Reagents for Contamination-Controlled DNA Extraction
| Reagent / Material | Function in Protocol | Key Consideration |
|---|---|---|
| Silica/Zirconia Beads (0.1 & 0.5 mm mix) | Mechanical disruption of robust cell walls (Gram-positive, spores). | Bead size mixture increases lysis efficiency across diverse morphologies. |
| Inhibitor Removal Technology (IRT) Buffer | Binds and removes PCR inhibitors (humic acids, bile salts, heme). | Critical for downstream sequencing success; a core component of many kits. |
| Benzonase Nuclease | Degrades all forms of DNA and RNA (linear, circular, single/double-stranded). | Used in host depletion protocols to break down free host nucleic acids. |
| Plasmid-Safe ATP-Dependent DNase | Degrades linear dsDNA but not circular or protected DNA. | Selectively depletes sheared mammalian DNA while sparing intact bacterial chromosomes. |
| Carrier RNA | Improves binding of low-concentration DNA to silica membranes in kits. | Enhances recovery from low-biomass samples but must be RNase-free. |
| Process Control Spikes (e.g., Pseudomonas aeruginosa cells) | Added at lysis start to monitor extraction efficiency and detect batch effects. | Allows normalization for technical variation across sample batches. |
Visualization of Key Methodological Concepts
Title: Host DNA Depletion & Microbial DNA Extraction Workflow
Title: Major Sources of Bias in DNA Extraction for 16S
Within the broader thesis on a 16S rRNA amplicon sequencing beginner guide, the selection of primers to target specific hypervariable regions (HVRs) is the foundational step that dictates the success and biological relevance of the entire study. The 16S rRNA gene contains nine hypervariable regions (V1-V9), interspersed with conserved sequences. No single region provides universal discriminatory power across all bacterial taxa, making the choice a critical, goal-dependent decision. This guide provides an in-depth technical framework for selecting primers to target the full spectrum (V1-V9) or the commonly used V4-V5 region, aligning primer choice with specific research objectives in drug development and microbial ecology.
Comparative Analysis of Target Regions
Region-Specific Characteristics
The choice between broad (V1-V9) and focused (e.g., V4-V5) amplification has profound implications for resolution, throughput, and cost.
Table 1: Characteristics of Full-Length (V1-V9) vs. V4-V5 Amplicon Sequencing
| Feature | V1-V9 (Full-Length, ~1500 bp) | V4-V5 (~390 bp) |
|---|---|---|
| Platform | PacBio SMRT, Oxford Nanopore | Illumina MiSeq/NextSeq |
| Primary Goal | Highest taxonomic resolution (species/strain level), novel discovery | High-throughput community profiling (genus level), large cohort studies |
| Read Length | Long-read (>1400 bp) | Short-read (250x2 bp or 300x2 bp) |
| Error Rate | Higher raw error (~1%), corrected with circular consensus | Inherently low (~0.1%) |
| Throughput | Lower, more expensive per sample | Very high, cost-effective |
| Bioinformatic Complexity | High (requires specific long-read pipelines) | Low (many established pipelines) |
| Best for Drug Development | Identifying specific pathogenic strains, precise biomarker discovery | Microbiome biomarker screening in clinical trials, compound efficacy on community structure |
Discriminatory Power by Taxonomic Rank
Different regions offer varying levels of discrimination across bacterial taxa, a crucial consideration for hypothesis-driven research.
Table 2: Taxonomic Resolution of Commonly Targeted Hypervariable Regions
| Hypervariable Region | Approx. Length (bp) | Phylum-Level | Genus-Level | Species-Level | Notes |
|---|---|---|---|---|---|
| V1-V3 | ~500 | Excellent | Good (for some phyla) | Moderate to Poor | Good for Firmicutes, less for Bacteroidetes |
| V3-V4 | ~460 | Excellent | Very Good | Moderate | Most widely used, balanced choice |
| V4 | ~292 | Excellent | Good | Moderate | Highest short-read sequencing depth |
| V4-V5 | ~390 | Excellent | Very Good | Good | Excellent for Proteobacteria |
| V1-V9 (Full) | ~1500 | Excellent | Excellent | Excellent | Gold standard for resolution |
Experimental Protocols
Protocol A: Library Preparation for V4-V5 (Illumina Platform)
This is a detailed protocol for the high-throughput, dual-indexing approach.
Materials:
- Genomic DNA (10-20 ng/µL).
- Region-specific primers (e.g., 515F [Parada]: 5'-GTGYCAGCMGCCGCGGTAA-3', 806R [Apprill]: 5'-GGACTACNVGGGTWTCTAAT-3').
- High-fidelity DNA polymerase (e.g., Q5 Hot Start).
- PCR purification kit (bead-based).
- Indexing primers (Nextera XT Index Kit).
- Library quantification kit (Qubit dsDNA HS Assay).
Method:
- First-Stage PCR (Amplify Target Region):
- Prepare 25 µL reactions: 12.5 µL master mix, 1.0 µL forward primer (10 µM), 1.0 µL reverse primer (10 µM), 1.0 µL DNA template, 9.5 µL nuclease-free water.
- Thermocycler conditions: 98°C for 30s; 25-35 cycles of (98°C for 10s, 55°C for 30s, 72°C for 30s); final extension at 72°C for 2 min.
- Purification: Clean amplicons using a bead-based clean-up system (0.8x bead-to-sample ratio). Elute in 30 µL.
- Second-Stage PCR (Attach Indices):
- Use 5 µL of purified amplicon as template.
- Add unique dual index primer pairs (i5 and i7) from the indexing kit.
- Run for 8 cycles using the same thermocycling profile as step 1.
- Library Pooling & QC: Quantify each indexed library, pool equimolarly, and perform a final bead clean-up (1.0x ratio). Validate library size on a Bioanalyzer (expect ~550 bp for V4-V5 with adapters).
Protocol B: Library Preparation for Full-Length V1-V9 (PacBio Platform)
Protocol for generating circular consensus sequences (CCS) for high-accuracy long reads.
Materials:
- Genomic DNA (high molecular weight, >10 kb).
- Full-length primers (e.g., 27F: 5'-AGRGTTYGATYMTGGCTCAG-3', 1492R: 5'-RGYTACCTTGTTACGACTT-3').
- Platinum II Taq Hot-Start DNA Polymerase.
- SMRTbell Express Template Prep Kit 3.0.
- BluePippin Size Selection System (Sage Science).
Method:
- Amplification: Perform PCR in 50 µL reactions with ~20 ng genomic DNA. Use a low cycle count (20-25 cycles) to minimize chimeras. Extension time should be >90s to ensure full-length amplification.
- Purification & Damage Repair: Clean PCR product with AMPure PB beads. Incubate amplicons with repair mix to remove nicks and damage.
- SMRTbell Library Construction: Ligate hairpin adapters to the ends of the double-stranded amplicon to create a circularizable template.
- Size Selection: Use BluePippin to select the target size range (e.g., 1600-1800 bp) to remove primer dimers and non-specific products.
- Sequencing Primer Annealing & Polymerase Binding: Follow kit instructions to prepare the library for sequencing on the PacBio Sequel IIe system using CCS mode (minimum 10 subreads per CCS).
Visualized Workflows
Diagram 1: Primer Selection Decision Tree (100 chars)
Diagram 2: V4-V5 Illumina Library Prep Workflow (100 chars)
The Scientist's Toolkit
Table 3: Research Reagent Solutions for 16S rRNA Amplicon Sequencing
| Item | Function | Example Product(s) |
|---|---|---|
| High-Fidelity Polymerase | Reduces PCR errors and chimera formation during target amplification. | Q5 Hot Start (NEB), KAPA HiFi, Platinum II Taq. |
| Bead-Based Cleanup Kit | For size selection and purification of PCR products and final libraries. | AMPure XP (Beckman), SPRIselect. |
| Dual-Indexing Primer Kit | Allows multiplexing of hundreds of samples by attaching unique barcodes. | Nextera XT Index Kit (Illumina), 16S Metagenomic Library Prep. |
| dsDNA Quantitation Assay | Accurate quantification of library concentration for pooling. | Qubit dsDNA HS Assay (Thermo Fisher). |
| Fragment Analyzer | Quality control to verify amplicon/library size distribution. | Agilent Bioanalyzer, Fragment Analyzer. |
| SMRTbell Prep Kit | Specialized reagent suite for preparing circular consensus sequencing libraries. | SMRTbell Express Template Prep Kit (PacBio). |
| Size-Selective System | Precise gel-based isolation of target amplicon length. | BluePippin (Sage Science), PippinHT. |
Within the context of a beginner's guide to 16S rRNA amplicon sequencing research, selecting an appropriate sequencing platform is a critical decision that impacts data quality, cost, and experimental design. This guide provides an in-depth technical comparison of Illumina's MiSeq and HiSeq systems against other prominent platforms, focusing on their application in microbial community profiling.
Illumina Sequencing-by-Synthesis (SBS) Chemistry
The core technology behind MiSeq and HiSeq platforms is bridge amplification on a flow cell followed by reversible terminator-based sequencing. Key steps include:
- Adapter Ligation: Sample DNA is fragmented and ligated with platform-specific adapters containing sequencing primer binding sites and index sequences for multiplexing.
- Cluster Generation: Single-stranded adapter-ligated fragments are bound to the flow cell surface. Solid-phase bridge amplification creates clonal clusters, each representing a single template molecule.
- Sequencing: All four fluorescently labeled, reversibly terminated nucleotides are added simultaneously. Incorporation of a single nucleotide per cycle is imaged, followed by cleavage of the fluorophore and terminator to enable the next cycle.
- Data Analysis: Base calling is performed from the sequence of fluorescent images collected per cycle.
Other Prominent Platforms
- Ion Torrent (Thermo Fisher): Utilizes semiconductor technology. DNA polymerization releases a proton (H⁺), causing a pH change detected by an ion sensor. Key differentiator: no modified nucleotides or optical systems.
- PacBio SMRT (Single Molecule, Real-Time) Sequencing: Uses zero-mode waveguides (ZMWs) to observe continuous, real-time incorporation of fluorescently labeled nucleotides by a single polymerase enzyme. Delivers long reads but with higher per-base error rates (randomly distributed).
- Oxford Nanopore Technologies (ONT): Measures changes in electrical current as single DNA strands pass through a protein nanopore. Capable of ultra-long reads and real-time analysis.
Quantitative Platform Comparison for 16S rRNA Sequencing
Table 1: Key Specifications of Sequencing Platforms for 16S Amplicon Studies
| Platform (Model) | Max Output per Run | Read Length (Paired-end) | Run Time | Approx. Cost per Gb* | Key Strengths for 16S | Key Limitations for 16S |
|---|---|---|---|---|---|---|
| Illumina MiSeq | 15 Gb | 2 x 300 bp | 4-55 hours | $90-$130 | High accuracy, standardized 16S protocols, ideal for mid-plex studies. | Lower throughput limits sample multiplexing. |
| Illumina HiSeq 3000/4000 | 1500 Gb | 2 x 150 bp | 1-3.5 days | $15-$30 | Very high throughput for extensive multiplexing of 1000s of samples. | Longer run time, overkill for small studies. |
| Illumina NovaSeq 6000 | 6000 Gb | 2 x 150 bp | ~44 hours | $7-$15 | Highest throughput, lowest per-Gb cost for ultra-large projects. | High capital cost, excessive capacity for typical 16S studies. |
| Ion Torrent S5 | 15 Gb | Up to 600 bp (single) | 2.5-5 hours | $50-$80 | Fast run time, simple workflow. | Higher indel error rates in homopolymer regions. |
| PacBio Sequel II | 20-50 Gb | 10-25 kb (HiFi reads) | 0.5-30 hours | $15-$35 | Full-length 16S sequencing, high taxonomic resolution. | Higher per-sample cost, lower throughput. |
| Oxford Nanopore MinION | 10-50 Gb | Up to >1 Mb | Real-time up to 72h | Variable | Real-time, long reads for full-length 16S. | Highest per-base error rate (~5-15%). |
*Cost estimates are approximate and for reagent consumption only; vary by region and institution.
Detailed Experimental Protocols for 16S rRNA Amplicon Sequencing
Standard Illumina Library Preparation Protocol (MiSeq/HiSeq)
This protocol is based on the widely used "16S Metagenomic Sequencing Library Preparation" (Illumina, Part #15044223 Rev. B).
A. Primary PCR Amplification of 16S Gene Region
- Primer Design: Use primers targeting hypervariable regions (e.g., V3-V4). Primers must include Illumina overhang adapter sequences.
- Forward Overhang: 5' TCGTCGGCAGCGTCAGATGTGTATAAGAGACAG-[locus-specific sequence] 3'
- Reverse Overhang: 5' GTCTCGTGGGCTCGGAGATGTGTATAAGAGACAG-[locus-specific sequence] 3'
- Reaction Setup (25 µL):
- 12.5 µL 2x KAPA HiFi HotStart ReadyMix
- 5 µL each forward and reverse primer (1 µM)
- 2.5 µL genomic DNA (1-10 ng)
- Thermocycling Conditions:
- 95°C for 3 min.
- 25 cycles of: 95°C for 30 sec, 55°C for 30 sec, 72°C for 30 sec.
- 72°C for 5 min. Hold at 4°C.
- Clean-up: Purify PCR products using magnetic beads (e.g., AMPure XP) at a 0.8x bead-to-sample ratio to remove primer dimers and non-specific products.
B. Index PCR and Library Completion
- Attachment of Dual Indices and Sequencing Adapters:
- Use the Nextera XT Index Kit. Set up a second PCR reaction.
- Reaction Setup (50 µL):
- 25 µL 2x KAPA HiFi HotStart ReadyMix
- 5 µL each of a unique N7 and S5 index primer
- 5 µL purified PCR product from Step A.
- 10 µL PCR-grade water.
- Thermocycling Conditions:
- 95°C for 3 min.
- 8 cycles of: 95°C for 30 sec, 55°C for 30 sec, 72°C for 30 sec.
- 72°C for 5 min. Hold at 4°C.
- Final Library Clean-up & Normalization:
- Purify with AMPure XP beads (0.8x ratio).
- Quantify libraries using fluorometry (e.g., Qubit).
- Normalize all libraries to 4 nM.
- Pool equal volumes of normalized libraries.
- Denature the pooled library with NaOH and dilute to a final loading concentration (e.g., 8 pM for MiSeq).
Key Protocol Variations for Other Platforms
- Ion Torrent: Uses a single, emulsion PCR (emPCR) step for template amplification on beads, followed by loading onto a semiconductor chip. Library preparation involves ligation of Ion-specific adapters.
- PacBio: For full-length 16S sequencing, PCR amplicons are size-selected, SMRTbell adapters are ligated to form circular templates, and hairpin adapters allow continuous, circular consensus sequencing (CCS) to generate high-fidelity (HiFi) reads.
- Oxford Nanopore: Requires a rapid PCR barcoding kit (e.g., SQK-RPB004). After initial PCR with barcoded primers, amplicons are ligated with ONT-specific adapters that facilitate strand capture and movement through the nanopore by a motor protein.
Visualizing Platform Selection & Workflow
Decision Tree for 16S rRNA Sequencing Platform Selection
Standard Illumina 16S Amplicon Library Prep Workflow
The Scientist's Toolkit: Essential Research Reagents & Materials
Table 2: Key Reagent Solutions for 16S rRNA Amplicon Sequencing
| Item | Function | Example Product(s) |
|---|---|---|
| High-Fidelity DNA Polymerase | Ensures accurate amplification of the 16S target region with low error rates, critical for downstream sequence fidelity. | KAPA HiFi HotStart ReadyMix, Q5 High-Fidelity DNA Polymerase. |
| Tailored 16S PCR Primers | Primer sets targeting specific hypervariable regions (e.g., V4, V3-V4). Must include platform-specific overhang sequences for adapter ligation/indexing. | 515F/806R (Earth Microbiome Project), 341F/785R. Custom synthesized oligos. |
| Magnetic Bead Clean-up Kit | For size selection and purification of PCR products, removing primers, dimers, and contaminants. | AMPure XP Beads, SPRIselect Beads. |
| Indexing Kit | Provides unique dual-index primer sets to barcode individual samples during the second PCR, enabling multiplexing. | Illumina Nextera XT Index Kit V2, IDT for Illumina UD Indexes. |
| Library Quantification Kit | Accurate measurement of double-stranded DNA library concentration prior to pooling and loading. Critical for balanced sequencing. | Qubit dsDNA HS Assay Kit, Quant-iT PicoGreen. |
| Sequencing Kit | Platform-specific reagent cartridge containing enzymes, buffers, and nucleotides required for the sequencing run. | Illumina MiSeq Reagent Kit v3 (600-cycle), Ion 520/530 Kit, PacBio SMRTbell Enzymes. |
| PhiX Control Library | A well-characterized, clonal library spiked into runs (1-5%) to monitor sequencing quality, error rates, and cluster identification on Illumina platforms. | Illumina PhiX Control v3. |
| Positive Control DNA | Genomic DNA from a mock microbial community (e.g., ZymoBIOMICS Microbial Community Standard) used to assess the entire workflow's accuracy and bias. | ATCC Mock Microbial Community, ZymoBIOMICS D6300. |
This technical guide details the core bioinformatics pipeline for 16S rRNA amplicon sequencing, serving as a foundational chapter in a broader beginner's guide thesis. The systematic conversion of raw sequencing data into biologically interpretable results is critical for researchers, scientists, and drug development professionals exploring microbial communities in contexts ranging from human health to environmental monitoring.
The Core Pipeline: A Stepwise Breakdown
The standard pipeline comprises sequential stages of data processing, quality control, and analysis.
Diagram Title: 16S rRNA Amplicon Sequencing Core Workflow
Detailed Experimental Protocols
Protocol 1: Initial Quality Control & Trimming
- Tool:
FastQC(v0.12.1) for quality visualization, followed bycutadapt(v4.6) orDADA2's filterAndTrim function. - Method:
- Run
FastQCon raw FASTQ files to assess per-base sequence quality, adapter contamination, and sequence length distribution. - Trim sequencing adapters and primers (e.g., Illumina adapters, 16S V4 primers 515F/806R) using
cutadaptwith a minimum overlap of 3 bp and a maximum error rate of 0.1. - Quality filter reads using
DADA2'sfilterAndTrim(): truncate reads at the first instance of a quality score ≤ 2, discard reads with >2 expected errors, and remove chimeras in silico using theremoveBimeraDenovofunction with the "consensus" method.
- Run
Protocol 2: Denoising & Amplicon Sequence Variant (ASV) Generation
- Tool:
DADA2(v1.28.0) pipeline. - Method:
- Learn the error rates from a subset of data (e.g., 100 million reads) using the
learnErrorsfunction. - Dereplicate identical reads using
derepFastq. - Apply the core sample inference algorithm via the
dadafunction, which models and corrects Illumina-sequenced amplicon errors. - Merge paired-end reads with
mergePairs, requiring a minimum overlap of 12 bases. - Construct a sequence table (analogous to OTU table) where rows are samples, columns are ASVs, and values are read counts.
- Learn the error rates from a subset of data (e.g., 100 million reads) using the
Protocol 3: Taxonomic Classification & Database Assignment
- Tool:
q2-feature-classifierplugin for QIIME 2 or theassignTaxonomyfunction inDADA2. - Method:
- Train a classifier on a reference database (e.g., SILVA 138.1, Greengenes2 2022.10) specific to the primer region used.
- Classify representative sequences of each ASV using a Naive Bayes classifier with a minimum bootstrap confidence threshold of 80%.
- Assign taxonomy from species to phylum level.
Key Data Outputs and Quantitative Benchmarks
Table 1: Typical Quantitative Outputs and Benchmarks at Key Pipeline Stages
| Pipeline Stage | Key Metric | Typical Range/Expected Outcome | Tool/Output Example |
|---|---|---|---|
| Raw Reads | Total Reads per Sample | 50,000 - 100,000 (for shallow diversity) | FASTQ file (Read1, Read2, Index) |
| Post-QC/Trim | % Reads Retained | 70% - 90% | cutadapt/DADA2 summary log |
| Denoising (DADA2) | Non-Chimeric ASVs | 100 - 5,000 per sample | Feature Table (BIOM/TSV format) |
| Taxonomy | Unclassified Rate (Phylum) | < 5% (with current databases) | Taxonomic Assignment Table |
| Diversity | Good's Coverage | > 99% indicates sufficient sampling | Alpha Rarefaction Curve |
Table 2: Comparison of Primary Bioinformatics Tools for 16S Analysis
| Tool / Package | Primary Function | Key Algorithm/Strength | Commonly Used Version |
|---|---|---|---|
| QIIME 2 (2024.5) | End-to-end pipeline | Plugin ecosystem, reproducibility | Core distribution 2024.5 |
| DADA2 (1.28) | Denoising & ASV calling | Error model, resolves single-nucleotide differences | 1.28.0 |
| mothur (1.48) | End-to-end pipeline | Extensive SOP, OTU-based clustering | 1.48.0 |
| USEARCH/ VSEARCH | Clustering, chimera detection | High-speed, OTU clustering at 97% identity | VSEARCH 2.26.1 |
| PICRUSt2 | Functional prediction | Infers KEGG pathways from 16S data | 2.5.2 |
The Scientist's Toolkit: Research Reagent & Software Solutions
Table 3: Essential Materials and Reagents for a 16S rRNA Sequencing Study
| Item / Solution | Function / Purpose | Example / Specification |
|---|---|---|
| PCR Primers (V4 Region) | Amplify target hypervariable region of 16S gene. | 515F (5'-GTGYCAGCMGCCGCGGTAA-3') / 806R (5'-GGACTACNVGGGTWTCTAAT-3') |
| High-Fidelity DNA Polymerase | Accurate amplification with low error rate for downstream ASV analysis. | KAPA HiFi HotStart ReadyMix (Roche) or Q5 (NEB) |
| Dual-Indexed Adapter Kits | Attach sample-specific barcodes for multiplex sequencing. | Illumina Nextera XT Index Kit v2 |
| Quantification Kit | Accurately measure DNA concentration post-amplification for pooling. | Qubit dsDNA HS Assay Kit (Thermo Fisher) |
| Bioinformatics Cluster/Cloud | Computational resource for processing large sequencing datasets. | Minimum: 16 GB RAM, 8 cores; Recommended: Cloud (AWS, GCP) or HPC |
| Reference Database | For taxonomic classification of sequences. | SILVA 138.1, Greengenes2 2022.10, RDP |
Diagram Title: From Data to Insight: Diversity Analysis Flow
This guide constitutes a core chapter in a comprehensive beginner's guide to 16S rRNA amplicon sequencing research. Following bioinformatic processing (quality control, ASV/OTU picking, and taxonomic assignment), downstream analysis transforms raw sequence data into biological insights. This phase focuses on interpreting microbial community patterns through three pillars: alpha/beta diversity visualization, taxonomic composition analysis, and rigorous statistical testing to link community changes to experimental metadata.
Core Analytical Frameworks & Quantitative Data
Table 1: Key Alpha Diversity Metrics
| Metric | Formula/Description | Interpretation | Typical Range (Gut Microbiome Example) |
|---|---|---|---|
| Observed Features | Count of unique ASVs/OTUs per sample. | Simple richness estimate. | 100 - 500 |
| Shannon Index | H' = -Σ (pi * ln(pi)); p_i = proportion of species i. | Incorporates richness and evenness. Higher = more diverse. | 3.0 - 6.0 |
| Faith's Phylogenetic Diversity | Sum of branch lengths of phylogenetic tree spanning all ASVs in a sample. | Incorporates evolutionary history. | 15 - 50 |
| Pielou's Evenness | J' = H' / ln(Observed Features). | Measures how evenly abundances are distributed (0 to 1). | 0.6 - 0.9 |
Table 2: Common Beta Diversity Distance/Dissimilarity Measures
| Measure | Basis | Range | Notes |
|---|---|---|---|
| Bray-Curtis | Abundance | 0 (identical) to 1 (no shared species) | Weighted by abundance, robust. |
| Jaccard | Presence/Absence | 0 to 1 | Unweighted, sensitive to rare species. |
| Weighted UniFrac | Phylogeny + Abundance | 0 to 1 | Accounts for evolutionary distance & abundance. |
| Unweighted UniFrac | Phylogeny + Presence/Absence | 0 to 1 | Accounts for evolutionary distance only. |
Experimental Protocols for Key Analyses
Protocol 3.1: Core Workflow for Diversity & Statistical Analysis
- Input: BIOM table (feature counts per sample), phylogenetic tree (Newick format), sample metadata (CSV).
- Software: QIIME 2 (2024.5), R (v4.3+).
- Steps:
- Alpha Diversity Calculation: Use
q2-diversitycore-metrics-phylogenetic (rarefied to even sampling depth) or Rphyloseq::estimate_richness(). - Alpha Diversity Visualization: Generate boxplots (grouped by metadata factor) and statistically compare using Kruskal-Wallis (>=3 groups) or Wilcoxon rank-sum (2 groups).
- Beta Diversity Calculation: Compute distance matrix (e.g., Bray-Curtis, Weighted UniFrac) within the core-metrics step.
- Ordination: Perform Principal Coordinates Analysis (PCoA) on the distance matrix using
q2-diversity pcoaor Rape::pcoa(). - Statistical Testing: Apply Permutational Multivariate Analysis of Variance (PERMANOVA) using
q2-diversity adonisor Rvegan::adonis2()(999 permutations) to test for group differences. - Compositional Visualization: Generate stacked bar charts at the phylum/genus level using
q2-taxa barplotor Rphyloseq::plot_bar().
- Alpha Diversity Calculation: Use
Protocol 3.2: Differential Abundance Testing with ANCOM-BC
- Objective: Identify taxa whose absolute abundances differ significantly between groups while correcting for compositionality bias.
- Method:
- Preprocessing: Filter out low-prevalence taxa (e.g., present in <10% of samples).
- Model: Use Analysis of Composition of Microbiomes with Bias Correction (ANCOM-BC). The model is:
log(observed abundance) = β0 + β1*Group + θ + ε, where θ is the sample-specific sampling fraction bias. - Implementation: In R, use the
ANCOMBCpackage functionancombc2(). - Output: Data frame with log-fold changes, standard errors, p-values, and q-values (FDR-adjusted). Visualize results using volcano plots or heatmaps.
Mandatory Visualizations
Downstream Analysis Workflow from Processed Data
PERMANOVA Statistical Testing Logic
The Scientist's Toolkit: Research Reagent Solutions
Table 3: Essential Materials & Tools for Downstream Analysis
| Item | Function / Purpose | Example Product / Software |
|---|---|---|
| Analysis Pipeline | Integrated platform for end-to-end microbiome analysis. | QIIME 2, mothur |
| R Statistical Environment | Core programming language for custom statistical analysis and visualization. | R (v4.3+) with RStudio |
| Phyloseq R Package | Data structure and functions for handling and analyzing microbiome data. | phyloseq (v1.46+) |
| Vegan R Package | Comprehensive suite for ecological and community data analysis. | vegan (v2.6+) |
| ANCOM-BC R Package | Statistically rigorous method for differential abundance testing. | ANCOMBC (v2.2+) |
| Graphing/Plotting Library | Creates publication-quality visualizations (boxplots, PCoA, bar charts). | ggplot2 (v3.5+) |
| Normalization Reagent (In-silico) | Computational method to standardize sequence counts across samples for fair comparison. | "Rarefaction" or "CSS Normalization" (via metagenomeSeq) |
| High-Performance Computing (HPC) Access | Necessary for computationally intensive steps (e.g., PERMANOVA permutations, large phylogenies). | Local cluster or cloud computing (AWS, GCP) |
Solving Common 16S Sequencing Problems: A Troubleshooting Handbook for Reliable Data
Within the context of a 16S rRNA amplicon sequencing beginner's guide, the issue of contamination is paramount. Unlike whole-genome sequencing, amplicon-based methods are exquisitely sensitive to the introduction of exogenous DNA, as the PCR step can amplify trace contaminants alongside target sequences. This can lead to skewed community profiles, erroneous taxonomic assignments, and irreproducible results. This whitepaper provides an in-depth technical guide to identifying, quantifying, and mitigating contamination sources throughout the workflow, from reagent impurities to laboratory cross-contamination.
Contamination in 16S sequencing can originate from multiple points in the experimental pipeline. Quantitative data on common contamination sources is summarized below.
| Contamination Source | Typical Contaminant Taxa | Estimated Contribution to Final Library | Key Mitigation Strategy |
|---|---|---|---|
| Molecular Biology Grade Water | Pseudomonas, Bradyrhizobium | 0.1 - 1% of sequences (if untreated) | Use certified DNA-free water; UV-irradiate reagents. |
| PCR Polymerases & Master Mixes | Bacillus, Lactobacillus, E. coli | 0.01 - 0.5% of sequences | Use high-fidelity, ultrapure enzymes; include negative controls. |
| DNA Extraction Kits | Alistipes, Bacteroides, Propionibacterium | Highly variable; can dominate low-biomass samples | Use kits with contaminant profiling; include extraction blanks. |
| Laboratory Surfaces & Air | Human skin flora (Staphylococcus, Corynebacterium), Environmental spores | Situation-dependent; major risk for cross-contamination | Rigorous decontamination (e.g., 10% bleach, DNA-ExitusPlus), use of dedicated pre-PCR spaces. |
| Indexing Primers & Barcodes | Oligo synthesis impurities (diverse) | Can cause index hopping/cross-talk if not purified | HPLC or equivalent purification of oligonucleotides. |
Experimental Protocols for Contamination Assessment
Protocol 3.1: Comprehensive Negative Control Strategy
Purpose: To track contamination introduced at each stage of the 16S rRNA amplicon sequencing workflow. Methodology:
- Extraction Blank: Include at least 2-3 replicates of a "mock sample" containing only the lysis buffer or sterile water processed through the entire DNA extraction protocol.
- PCR Negative Control: For each PCR batch, include a reaction where template DNA is replaced with nuclease-free water.
- Library Negative Control: Carry the PCR negative control through the library purification and pooling steps.
- Sequencing & Analysis: Sequence all negative controls alongside experimental samples on the same flow cell. Bioinformatically, aggregate contaminant sequences from all negatives to create a "contamination catalogue." Use tools like
decontam(R package) in frequency-based or prevalence-based mode to subtract contaminants from experimental samples.
Protocol 3.2: Determination of the Limit of Detection (LoD) for Low-Biomass Samples
Purpose: To establish the lowest bacterial biomass that can be reliably distinguished from background contamination. Methodology:
- Mock Community Serial Dilution: Create a serial dilution (e.g., 10^6 to 10^1 copies/µL) of a well-characterized, even mock microbial community (e.g., ZymoBIOMICS) in a sterile, human DNA background (e.g., 10 ng/µL lambda DNA).
- Parallel Processing: Process each dilution point and a negative control (sterile water) through the standard extraction and 16S PCR protocol, using a high cycle count (e.g., 35-40 cycles).
- Quantitative Analysis: Plot the observed versus expected relative abundances of the mock community members. The LoD is defined as the point where the signal from the dilutions is no longer statistically distinguishable from the negative control profile using PERMANOVA or similar tests.
Visualization of Workflow and Contamination Pathways
Title: 16S Workflow with Contamination Ingress Points and Mitigation
Title: Bioinformatic Decontamination Decision Workflow
The Scientist's Toolkit: Key Research Reagent Solutions
Table 2: Essential Materials for Contamination Control in 16S Sequencing
| Item | Function & Rationale | Key Consideration |
|---|---|---|
| Certified DNA-Free Water | Serves as the diluent for all PCR and library prep reactions. Minimizes background bacterial DNA. | Look for "PCR Grade" or "0.1 µm filtered" certifications. Aliquot upon receipt. |
| UltraPure PCR Master Mix | Contains polymerase, dNTPs, and buffer optimized for 16S amplification with minimal contaminating DNA. | Select mixes pre-screened for low microbial DNA background. |
| UV Crosslinker | Used to pre-treat water, buffers, and plasticware (tips, tubes) to photochemically degrade contaminating double-stranded DNA. | Standard treatment: 254 nm, 5-10 J/cm². Not effective on dried DNA. |
| DNA Decontamination Solution | Chemical agents like DNA-ExitusPlus or 10% (v/v) sodium hypochlorite (bleach) for surface and equipment cleaning. | Bleach must be freshly prepared, requires rinsing. Commercial products may be more stable. |
| Barrier/Piston-Filter Pipette Tips | Prevent aerosol carryover into pipette shafts, a major source of sample-to-sample cross-contamination. | Mandatory for all pre-PCR steps, especially during template addition. |
| High-Purity Oligonucleotides | HPLC- or PAGE-purified primers and barcodes ensure minimal truncated sequences or synthesis contaminants. | Critical for reducing index misassignment and maximizing primer efficiency. |
| Positive Control Mock Community | Defined mix of genomic DNA from known bacteria. Verifies assay sensitivity and detects inhibition. | Use at a concentration near the LoD to avoid overwhelming low-biomass test samples. |
Within the broader framework of a beginner's guide to 16S rRNA amplicon sequencing research, the analysis of low biomass samples from sterile sites presents a paramount challenge. Sterile sites, such as blood, cerebrospinal fluid (CSF), synovial fluid, and deep tissue, are presumed to harbor no indigenous microbiota. Detecting genuine microbial signals in these environments is complicated by extremely low microbial biomass, making results susceptible to contamination from DNA extraction kits, laboratory reagents, and the environment. This technical guide details the specialized considerations and stringent protocols required to distinguish true signal from noise in such samples, ensuring the validity of findings in clinical diagnostics and drug development.
The primary hurdle is the overwhelming ratio of contaminating DNA to target DNA. Contaminants can originate at every step:
- Wet Lab Reagents: DNA extraction kits, polymerase enzymes, and water.
- Laboratory Environment: Airborne particulates, laboratory surfaces, and personnel.
- Sample Collection: Collection tubes and antiseptics.
- Cross-Contamination: From higher biomass samples processed in the same space.
Quantitative Analysis of Common Contaminants
Recent literature surveys characterize typical reagent contaminants, which are predominantly bacterial taxa from manufacturing environments.
Table 1: Common Bacterial Genera Identified as Reagent Contaminants in Low Biomass Studies
| Genus | Typical Phylum | Frequency in Reagent Blanks | Potential Source |
|---|---|---|---|
| Pseudomonas | Proteobacteria | High | Water systems, purification resins |
| Acinetobacter | Proteobacteria | High | Soil, water in manufacturing |
| Cupriavidus | Proteobacteria | Moderate | Water, purification columns |
| Pelomonas | Proteobacteria | Moderate | Ultrapure water systems |
| Sphingomonas | Proteobacteria | Moderate | Biofilms in water pipes |
| Burkholderia | Proteobacteria | Moderate | Soil, plant material |
| Propionibacterium/Cutibacterium | Actinobacteria | Moderate (skin) | Human skin, laboratory personnel |
| Staphylococcus | Firmicutes | Low (skin) | Human skin |
| Ralstonia | Proteobacteria | Variable | Water systems, reagents |
Experimental Protocols for Rigorous Low Biomass Analysis
Protocol for a Controlled Sterile Site Sequencing Experiment
A. Sample Collection & Handling
- Materials: Use sterile, DNA-free collection kits (e.g., sterile pyrogen-free syringes, certified DNA-free tubes). Perform skin disinfection at the collection site with a validated, DNA-degrading antiseptic (e.g., 2% chlorhexidine in 70% ethanol).
- Negative Controls: At the point of collection, prepare a "field blank" by exposing a sterile swab or pouring sterile saline into a collection tube in the immediate environment.
B. DNA Extraction & Library Preparation
- Reagent Preparation: Aliquot all reagents (beads, buffers, enzymes) into single-use portions using sterile techniques in a PCR workstation or laminar flow hood.
- Critical Controls:
- Negative Extraction Controls (NECs): Include at least 3-5 blank extractions containing only lysis buffer instead of sample.
- Positive Control: Use a synthetic microbial community (e.g., ZymoBIOMICS Microbial Community Standard) at a very low input (e.g., 10-100 cells) to assess sensitivity.
- Methodology: Use a extraction kit validated for low biomass and high inhibitor removal. Perform extractions in a dedicated, UV-irradiated hood, physically separated from post-PCR areas. Include an enzymatic step to degrade contaminating prokaryotic DNA (e.g., Benzonase, DpnI) prior to cell lysis, if applicable.
C. Amplification & Sequencing
- PCR Setup: Use PCR reagents designed for low-biomass/high-sensitivity (e.g., high-fidelity, low-DNA polymerase). Set up reactions in a clean hood.
- PCR Controls:
- Template-Free Control (TFC): Contains all PCR reagents except template DNA.
- NEC Amplicon Control: Amplify the NEC DNA.
- Primer Choice: Use primers with unique molecular identifiers (UMIs) or barcodes to identify and correct for PCR errors and chimeras. Target a shorter, hypervariable region (e.g., V4) for higher sensitivity from degraded DNA.
- Sequencing: Sequence all sample and control libraries on the same high-output flow cell to ensure consistent sequencing depth and error profiles.
Protocol for In Silico Decontamination & Data Analysis
A. Bioinformatic Processing
- Demultiplexing & Trimming: Standard pipeline (e.g.,
cutadapt,dada2). - Generate Amplicon Sequence Variants (ASVs): Use DADA2 or Deblur to resolve single-nucleotide differences, which is more precise for low-biomass than OTU clustering.
- Contaminant Identification: Use statistical package
decontam(R) in "prevalence" mode. ASVs significantly more prevalent in negative controls (NECs, TFCs) than in true samples are classified as contaminants. - Filtering: Remove all contaminant ASVs from the entire dataset.
B. Validation & Reporting
- Thresholds: Define a minimum threshold for biological signal (e.g., ASV must be present in >X% of true technical replicates and at a read count >Y times the max found in any control).
- Reproducibility: True signal should be reproducible across technical replicates.
- Reporting: Transparently report all controls, their sequencing depths, and identified contaminants alongside results.
Title: Experimental & Computational Workflow for Sterile Site Analysis
The Scientist's Toolkit: Research Reagent Solutions
Table 2: Essential Materials for Low Biomass Sterile Site Research
| Item Category | Specific Product/Type Example | Critical Function & Rationale |
|---|---|---|
| DNA-Free Collection | Sterile, pyrogen-free vacuum tubes; endoscopic retrograde cholangiopancreatography (ERCP) aspiration catheters. | Minimizes introduction of contaminating DNA at the very first step of sampling. |
| Extraction Kit | Kits with pre-inactivated contaminant DNA (e.g., Qiagen PowerSoil Pro DNEasy, MoBio Ultraclean) or optimized for low input. | Maximizes yield from few cells while minimizing co-extraction of inhibitors and kit-borne contaminants. |
| PCR Polymerase | High-fidelity, ultrapure polymerases (e.g., Takara Ex Taq HS, Q5 High-Fidelity). | Reduces amplification bias and is manufactured to contain minimal bacterial DNA. |
| Nuclease-Free Water | Certified molecular biology grade, tested via ultradepth sequencing. | Serves as the solvent for all reactions without contributing amplifiable signal. |
| Unique Molecular Identifiers (UMIs) | Fusion primers with random nucleotide tags. | Allows bioinformatic correction for PCR errors and deduplication, improving accuracy from low template. |
| Synthetic Community Standard | Defined, low-concentration mock communities (e.g., from Zymo Research, ATCC). | Serves as a process control to track sensitivity, precision, and contamination across batches. |
| Decontamination Reagent | DNA degradation enzymes (e.g., DNase I, Benzonase) or pre-treatment solutions (e.g., PMA, DBN). | Can be used to treat samples or workspaces to degrade contaminating DNA prior to target cell lysis. |
| Bioinformatic Tool | decontam (R package), SourceTracker. |
Statistically identifies and removes contaminating sequences based on prevalence in negative controls. |
Within the workflow of 16S rRNA gene amplicon sequencing, PCR amplification is a critical step that introduces systematic biases and errors. These artifacts—chimeras, primer bias, and amplification errors—directly compromise the accuracy of microbial community profiles, leading to erroneous biological conclusions. This guide provides an in-depth technical analysis of these artifacts and methodologies for their mitigation, forming a crucial component of a robust beginner's guide to 16S rRNA amplicon sequencing research.
Chimera Formation and Detection
Chimeras are spurious sequences formed from incomplete extensions during PCR, where a partially extended fragment from one template anneals to a different template in a subsequent cycle. They create illusory, novel operational taxonomic units (OTUs) or amplicon sequence variants (ASVs).
Experimental Protocol for in silico Chimera Detection:
- Sequence Processing: After quality filtering and denoising (e.g., using DADA2 or UNOISE3), obtain a set of representative sequences.
- Reference-Based Detection:
- Use a tool like UCHIME2 in reference mode.
- Align query sequences against a curated reference database (e.g., SILVA, Greengenes).
- Identify sequences that are significantly better explained as a composite of two or more parent sequences.
- Command:
uchime2_ref --input [query_seqs.fasta] --db [reference_db.fasta] --uchimeout [results.uchime]
- De Novo Detection:
- Use the same tool in de novo mode (e.g., UCHIME2, VSEARCH).
- The algorithm compares each sequence against more abundant sequences in the same sample, under the assumption that chimeras are rare and parents are abundant.
- Command:
vsearch --uchime_denovo [input.fasta] --nonchimeras [output.fasta]
- Filtering: Remove all sequences flagged as chimeric from downstream analysis.
Primer Bias and Selection
Primer bias arises from mismatches between universal primer sequences and template DNA, causing non-uniform amplification of different taxa. This skews observed community composition.
Experimental Protocol for Primer Evaluation in silico:
- Target Region Alignment: Obtain a multiple sequence alignment of the full 16S gene from a reference database.
- Primer Binding Analysis: Extract the hypervariable regions flanked by your primer pair (e.g., V3-V4).
- Mismatch Calculation: For each primer, align it to all positions in the alignment where it is designed to bind. Count the number and position of mismatches for each taxonomic group.
- Coverage Estimation: Using tools like
ecoPCRorTestPrime, calculate the theoretical fraction of target sequences in a database that would amplify given a defined number of allowed mismatches. - In-Vitro Validation: Perform qPCR or digital PCR with the primer set on a mock microbial community of known composition to quantify amplification efficiency biases.
Table 1: Common 16S rRNA Gene Primer Pairs and Theoretical Coverage
| Primer Pair Name | Target Region | Approx. Amplicon Length | Theoretical Coverage* (% of Bacteria) | Key Known Biases |
|---|---|---|---|---|
| 27F / 338R | V1-V2 | ~310 bp | ~85% | Under-represents Bifidobacterium and Lactobacillus |
| 341F / 805R | V3-V4 | ~460 bp | ~90% | Commonly used; biases against Candidatus Saccharibacteria |
| 515F / 806R | V4 | ~290 bp | ~92% | Revised 515F helps reduce bias against Chloroflexi |
| 515F / 926R | V4-V5 | ~410 bp | ~95% | Broader coverage but longer length may reduce sequencing depth |
Coverage estimates based on *in silico analysis against SILVA 138 database with ≤1 mismatch.
Amplification Errors and Denoising
Polymerase errors introduced during PCR are propagated and amplified, inflating sequence diversity. Denoising algorithms distinguish true biological sequences from these errors.
Experimental Protocol for Denoising with DADA2:
- Quality Profile: Inspect read quality profiles using
plotQualityProfile()to set trimming parameters. - Filter and Trim: Filter based on quality scores and expected errors. Trim to remove primers and low-quality tails.
- Command in R:
filterAndTrim(fwd, filt_fwd, rev, filt_rev, truncLen=c(240,200), maxN=0, maxEE=c(2,2), truncQ=2, rm.phix=TRUE)
- Command in R:
- Learn Error Rates: Model the error rates specific to your dataset.
errF <- learnErrors(filt_fwd, multithread=TRUE)
- Dereplication & Denoising: Merge paired-end reads, remove duplicates, and apply the core denoising algorithm to infer exact amplicon sequence variants (ASVs).
mergers <- mergePairs(dadaF, filt_fwd, dadaR, filt_rev)seqtab <- makeSequenceTable(mergers)
- Remove Chimeras: Apply chimera removal as described in Section 1.
seqtab.nochim <- removeBimeraDenovo(seqtab, method="consensus")
The Scientist's Toolkit: Research Reagent Solutions
| Item | Function |
|---|---|
| High-Fidelity DNA Polymerase (e.g., Q5, Phusion) | Reduces PCR error rates (10-100x lower than Taq) through 3'→5' exonuclease proofreading activity. |
| Mock Microbial Community | Defined mix of genomic DNA from known organisms. Serves as a positive control to quantify primer bias, chimera rate, and error rate. |
| Low-Bias Library Preparation Kit (e.g., KAPA HiFi) | Optimized enzyme and buffer systems designed to minimize GC-bias and improve uniformity of amplification. |
| Duplex-Specific Nuclease (DSN) | Can be used to normalize libraries by degrading abundant, reannealed dsDNA to reduce over-amplification of dominant templates. |
| Unique Molecular Identifiers (UMIs) | Random barcodes ligated to templates pre-amplification, allowing bioinformatic correction for PCR duplicates and polymerase errors. |
Table 2: Quantitative Impact of PCR Artifacts on Community Analysis
| Artifact Type | Typical Frequency/Impact Range | Effect on Diversity Metrics | Primary Mitigation Strategy |
|---|---|---|---|
| Chimeras | 5-20% of raw reads | Increases richness (α-diversity), distorts β-diversity | In silico detection (UCHIME, VSEARCH) & removal |
| Polymerase Errors | ~0.1-1% per base (Taq) | Drastically inflates rare ASV/OTU counts | Use of high-fidelity polymerase; Denoising (DADA2, UNOISE) |
| Primer Bias | Amplification efficiency variance >1000x between taxa | Skews relative abundance, reduces detectable richness | Careful primer selection; Use of mock community for calibration |
| Differential Amplification | Major cause of between-sample variation | Increases perceived β-diversity | PCR replicate pooling; Template dilution; Minimal cycle number |
Title: PCR Artifact Introduction and Correction Workflow
Title: Chimera Formation Mechanism During PCR
Title: DADA2 Denoising and Chimera Removal Workflow
This guide serves as a focused component within a broader thesis on 16S rRNA Amplicon Sequencing for Beginners. Determining the optimal number of sequencing reads per sample is a critical, yet often misunderstood, step in experimental design. Insufficient depth yields poor taxonomic resolution and misses rare taxa, while excessive depth wastes resources and complicates downstream analysis. This whitepaper provides an in-depth technical framework for determining adequate sequencing depth tailored to researchers, scientists, and drug development professionals engaged in microbiome studies.
The Core Principle: Saturation and Rarefaction
The goal is to achieve saturation in community diversity detection, where additional sequencing reads yield diminishing returns in discovering new species or amplicon sequence variants (ASVs). The required depth is not a universal number but depends on sample complexity (e.g., gut vs. soil), the target region of the 16S gene (V1-V2, V3-V4, etc.), and the biological question (e.g., presence of a pathogen vs. full community characterization).
Key Metrics:
- Observed Richness: The raw number of ASVs/OTUs detected.
- Rarefaction Curves: Plot observed richness against the number of sequenced reads. A plateau indicates saturation.
- Good's Coverage: Estimates the probability that the next read is from a previously observed taxon. Values >99.5% often indicate sufficient depth for core community analysis.
Quantitative Data & Recommendations
Based on current literature and standard practices, the following table summarizes recommended sequencing depths for various sample types and study goals.
Table 1: Recommended Sequencing Depth for 16S rRNA Amplicon Studies
| Sample Type / Habitat | Estimated Microbial Richness | Recommended Minimum Reads/Sample (for Core Taxa) | Recommended Reads/Sample (for Rare Biosphere) | Key Considerations |
|---|---|---|---|---|
| Human Gut | Moderate-High (100-1000+ ASVs) | 20,000 - 30,000 | 50,000 - 100,000 | Highly diverse; depth depends on disease state (e.g., IBD increases diversity). |
| Human Skin | Low-Moderate (50-200 ASVs) | 10,000 - 20,000 | 30,000 - 50,000 | Lower biomass, higher host contamination. |
| Soil / Sediment | Very High (1000-10,000+ ASVs) | 50,000 - 100,000 | 100,000 - 200,000+ | Extreme diversity often precludes full saturation; define question carefully. |
| Water (Marine/Fresh) | Moderate (100-500 ASVs) | 30,000 - 50,000 | 70,000 - 100,000 | Biomass and diversity vary with location and depth. |
| Lab Cultures / Simple Communities | Very Low (1-20 ASVs) | 5,000 - 10,000 | N/A | Depth needed primarily for statistical confidence, not discovery. |
Table 2: Impact of Sequencing Depth on Downstream Analysis Outcomes
| Analysis Goal | Minimal Depth Requirement | Optimal Depth Range | Risk of Insufficient Depth | Risk of Excessive Depth |
|---|---|---|---|---|
| Alpha Diversity (Richness) | 10,000 reads | 30,000 - 50,000 reads | Severe underestimation of species count. | Increased computational load; minor artifacts from sequencing errors. |
| Beta Diversity (Community Comparison) | 15,000 reads | 25,000 - 70,000 reads | Reduced power to detect between-group differences. | Can amplify technical noise, requiring careful filtering. |
| Differential Abundance (Abundant Taxa) | 20,000 reads | 30,000 - 60,000 reads | Low power to detect shifts in major genera/families. | Minimal added benefit for top 50-100 taxa. |
| Rare Taxa Detection/Presence | 50,000 reads | 70,000 - 150,000+ reads | Complete failure to detect low-abundance but potentially critical members. | Significantly increases false positives from contamination/index hopping. |
Experimental Protocol: Determining Depth Empirically via Pilot Study
The most robust method for determining required depth is to conduct a pilot sequencing run at high depth and computationally subsample (rarefy) the data.
Protocol: Saturation Analysis via In Silico Rarefaction
A. Sample Preparation & Deep Sequencing:
- DNA Extraction: Perform extraction on a representative subset of samples (n=5-10 per group) using a standardized, high-yield kit (e.g., Qiagen DNeasy PowerSoil Pro).
- Library Preparation: Amplify the target hypervariable region (e.g., V3-V4) using dual-indexed primers. Use a high-fidelity polymerase to minimize PCR errors.
- Deep Sequencing: Pool libraries and sequence on an Illumina MiSeq (2x300 bp) or NovaSeq platform, aiming for ≥100,000 raw reads per sample in the pilot.
B. Bioinformatic Processing & In Silico Rarefaction:
- Quality Control & Denoising: Process reads through a pipeline like QIIME 2 or DADA2 to filter, denoise, merge reads, and remove chimeras, resulting in a feature table of Amplicon Sequence Variants (ASVs).
- Generate Rarefaction Curves: Use the
qiime diversity alpha-rarefactioncommand or the R packagevegan(rarecurve()function) to repeatedly subsample the feature table at increasing sequencing depths (e.g., 100, 1000, 5000, 10000... up to the maximum depth) and calculate observed richness at each depth. - Calculate Saturation Metrics: Compute Good's Coverage for each sample at various depths.
C. Analysis & Depth Determination:
- Plot rarefaction curves for all pilot samples.
- Identify the depth at which the average curve for your sample type begins to asymptote (plateau).
- Check Good's Coverage at that depth. A target of >99.5% is typical.
- Add a 20-30% buffer to this depth to account for sample-to-sample variation in complexity and potential sample quality loss in the full study. This final number is your target reads per sample.
Visualizing the Decision Workflow
Title: Workflow for Determining Optimal Sequencing Depth
The Scientist's Toolkit: Essential Research Reagent Solutions
Table 3: Key Reagents and Materials for 16S Sequencing Depth Optimization
| Item | Function in Depth Optimization | Example Product(s) |
|---|---|---|
| High-Yield DNA Extraction Kit | Maximizes microbial DNA recovery from diverse sample matrices, ensuring library prep starts with sufficient and representative template. Critical for low-biomass samples. | Qiagen DNeasy PowerSoil Pro, MO BIO PowerSoil, ZymoBIOMICS DNA Miniprep |
| High-Fidelity PCR Polymerase | Minimizes PCR errors during target amplification, reducing the generation of spurious sequences that can be mistaken for rare taxa at high depth. | KAPA HiFi HotStart, Q5 High-Fidelity DNA Polymerase |
| Dual-Indexed Primers (Nextera) | Enables multiplexing of hundreds of samples in a single run with minimal index hopping (bleed-through), a critical artifact when sequencing at very high depth. | Illumina Nextera XT Index Kit V2, IDT for Illumina 16S rRNA Primers |
| Quantification & QC Kit | Accurate quantification (via qPCR) of the final library is essential for achieving balanced, equimolar pooling, preventing some samples from being under-sequenced. | KAPA Library Quantification Kit (Illumina), Agilent Bioanalyzer/TapeStation |
| Positive Control (Mock Community) | A defined mix of known bacterial genomes. Used to validate the entire workflow, calculate limit of detection, and assess how read depth relates to expected community recovery. | ZymoBIOMICS Microbial Community Standard, ATCC MSA-1003 |
| Negative Control (Extraction Blank) | Water or buffer taken through extraction and library prep. Essential for identifying kit/reagent contaminants that become prominent at high sequencing depths. | Nuclease-Free Water |
Within the context of a comprehensive guide to 16S rRNA amplicon sequencing for beginners, understanding and managing batch effects is paramount. Batch effects are technical sources of variation introduced during different experimental runs, days, reagent lots, or sequencing lanes. They can confound biological signals, leading to false conclusions in microbial ecology, biomarker discovery, and drug development research. This technical guide details strategies for their minimization through experimental design and their mitigation via computational correction.
Experimental Design for Batch Effect Minimization
Proactive design is the most effective strategy against batch effects.
Core Principles
- Randomization: Distribute biological samples of different groups (e.g., case/control) randomly across processing batches.
- Balancing: Ensure each batch contains a similar proportion of samples from all experimental groups.
- Blocking: Treat "batch" as a blocking factor in the experimental design. Samples from the same subject or replicate set should be processed in the same batch when possible.
- Replication: Include technical replicates (the same sample processed in different batches) to explicitly measure batch variability.
Practical Protocol for 16S Sequencing
Title: Protocol for Batch-Aware 16S rRNA Library Preparation
Methodology:
- Sample Randomization: Using a laboratory information management system (LIMS) or script, randomize the order of all samples (across all groups) before any wet-lab procedure.
- Positive Control Spike-in: Include a mock microbial community (e.g., ZymoBIOMICS Microbial Community Standard) in every extraction and PCR batch. This provides a ground truth for assessing batch-derived taxonomic bias.
- Negative Controls: Include extraction blanks and PCR no-template controls in every batch to monitor contamination.
- Balanced PCR Plate Layout: When plating samples for PCR amplification, use a plate layout that balances experimental groups across columns/rows to control for position effects (e.g., thermal gradient effects).
- Pooling Strategy: Pool equimolar amounts of PCR products from samples across multiple batches before sequencing. If sequencing multiple lanes, pool samples from all groups into each lane.
Computational Correction Strategies
When batch effects persist post-sequencing, computational tools are required.
Data Exploration and Detection
Before correction, batch effects must be visualized.
- Principal Coordinates Analysis (PCoA): Plot samples using a distance metric (e.g., UniFrac, Bray-Curtis). Color points by batch versus experimental group. Clustering by batch indicates a strong batch effect.
- PERMANOVA: Statistical test to quantify the variance (R²) explained by "Batch" versus "Group" factors.
Table 1: Quantitative Assessment of a Simulated Batch Effect
| Variance Component | Sum of Squares | R² (%) | p-value |
|---|---|---|---|
| Experimental Group | 1.85 | 15.2 | 0.001* |
| Processing Batch | 2.90 | 23.8 | 0.001* |
| Residual | 7.45 | 61.0 | - |
Note: This table illustrates a scenario where batch explains more variance than the biological group of interest, necessitating correction.
Correction Algorithms & Protocols
A. Using Negative Controls and Spike-ins (Most Rigorous)
- Function: Directly measures and subtracts batch-specific noise.
- Protocol: Identify contaminants present in negative controls (
decontampackage in R). For spike-ins, calculate batch-specific recovery rates and use them to normalize counts from the same batch.
B. Compositional Data Transformations
- Method: Center Log-Ratio (CLR) transformation.
- Protocol: For each sample, transform the count vector
xusing a geometric meanG(x):CLR(x) = log(x_i / G(x)). This mitigates the compositional nature of the data but does not directly remove inter-batch differences.
C. Batch Correction Models
- Method 1: Remove Unwanted Variation (RUV)
- Concept: Uses negative controls or replicate samples to estimate factors of unwanted variation.
- Protocol (RUVseq in R):
- Method 2: ComBat or ComBat-seq
- Concept: Uses an empirical Bayes framework to adjust for batch effects while preserving biological variation.
- Protocol (sva package in R):
Table 2: Comparison of Computational Correction Methods
| Method | Input Data Type | Key Requirement | Preserves Group Differences? | Software/Package |
|---|---|---|---|---|
| CLR Transformation | Counts/Proportions | None | Yes | compositions (R), scikit-bio (Python) |
| RUVseq | Normalized Counts | Negative Controls/Replicates | Yes, via careful design | RUVSeq (R) |
| ComBat-seq | Raw Counts | Batch covariate only | Yes, when 'group' is specified | sva (R) |
| MMUPHin | Feature Table | Metadata with batch/group | Yes | MMUPHin (R/Python) |
The Scientist's Toolkit: Research Reagent Solutions
Table 3: Essential Materials for Batch-Effect-Aware 16S Studies
| Item | Function in Batch Management |
|---|---|
| Mock Microbial Community Standard | Provides identical positive control across batches to quantify technical variation in taxonomy and abundance. |
| DNA Extraction Kit (Same Lot) | Minimizes batch effects from variable lysis efficiency and inhibitor removal. Use a single large lot for a study. |
| PCR Enzyme Master Mix (Same Lot) | Minimizes amplification bias variation. Aliquot a large lot to avoid inter-batch differences. |
| Barcoded Adapters & Primers (Single-Pool) | Use a single, pre-mixed pool of uniquely indexed primers for all samples to control for priming efficiency differences. |
| Quantitation Standard (e.g., qPCR kit) | For accurate, batch-to-batch comparable library quantification prior to sequencing. |
| Automated Liquid Handler | Increases reproducibility and precision in sample and reagent transfers across plates and batches. |
Visualization of Workflows
Title: 16S Batch Effect Management & Correction Workflow
Title: ComBat-seq Empirical Bayes Correction Logic
This technical guide, framed within a broader thesis on beginner 16S rRNA amplicon sequencing research, provides an in-depth comparison of four principal bioinformatics platforms. The analysis is intended for researchers, scientists, and drug development professionals selecting tools for microbial community analysis.
Core Algorithmic Foundations & Quantitative Comparison
The primary distinction between these tools lies in their sequence processing philosophy: OTU clustering vs. ASV inference.
| Feature | QIIME 2 | mothur | DADA2 | USEARCH |
|---|---|---|---|---|
| Core Method | Plug-in platform (supports both OTU & ASV) | OTU Clustering (closed-reference, de novo) | Amplicon Sequence Variant (ASV) inference | OTU Clustering (primarily de novo) |
| Algorithm | Uses plugins like DADA2, Deblur, VSEARCH | Mothur's own algorithms, UCLUST-like | Divisive partitioning, error model | Proprietary (UPARSE, UNOISE algorithms) |
| Input Format | QIIME 2 artifacts (.qza) | FASTA, count tables, groups | FASTQ (paired-end support) | FASTA/FASTQ |
| Chimera Removal | Via plugins (DADA2, VSEARCH) | UCHIME (built-in) | Integrated probabilistic model | UCHIME2 (built-in) |
| Denoising | Through Deblur or DADA2 plugins | Pre-clustering | Core function (error correction) | UNOISE algorithm |
| Reference Database | SILVA, Greengenes via plugins | SILVA, RDP, Greengenes (custom) | Requires external DB for taxonomy | Requires external DB |
| License | Open-source (BSD) | Open-source (GPL) | Open-source (GPL) | Freemium (32-bit free, 64-bit paid) |
| Primary Output | Feature table, representative sequences | Shared file, consensus taxonomy | Sequence table, error rates | OTU table, representative sequences |
| Typical Run Time | Moderate to High | High | Moderate | Very Fast |
| Ease of Use | High (graphical interface available) | Moderate (command-line) | Moderate (R package) | High (simple commands) |
| Performance Metric (Simulated Data)* | QIIME 2 (Deblur) | mothur | DADA2 | USEARCH (UPARSE) |
|---|---|---|---|---|
| False Positive Rate (%) | 0.5 - 2.0 | 1.0 - 3.5 | 0.1 - 0.5 | 1.5 - 4.0 |
| False Negative Rate (%) | 3.0 - 7.0 | 5.0 - 10.0 | 2.0 - 5.0 | 1.0 - 3.0 |
| Computational Memory (GB) | 8 - 16 | 4 - 8 | 4 - 8 | < 2 |
| Processing Speed (Million reads/hr) | ~2 | ~1 | ~1.5 | ~10 |
*Data aggregated from recent benchmarks (2023-2024). Actual values depend on dataset size and parameters.
Detailed Experimental Protocols
Protocol A: Standard DADA2 Workflow for Paired-end Reads (in R)
This protocol details processing from raw FASTQ to an ASV table.
- Filter and Trim:
filterAndTrim(fwd=file.path(path, forward_reads), rev=file.path(path, reverse_reads), filt=file.path(filtpath, fwd_filts), filt.rev=file.path(filtpath, rev_filts), truncLen=c(240,200), maxN=0, maxEE=c(2,2), truncQ=2, rm.phix=TRUE, compress=TRUE) - Learn Error Rates:
learnErrors(filtFs, multithread=TRUE) - Dereplication:
derepFastq(filtFs, verbose=TRUE) - Sample Inference:
dada(derepFs, err=errF, multithread=TRUE) - Merge Paired Reads:
mergePairs(dadaF, derepF, dadaR, derepR, verbose=TRUE) - Construct Sequence Table:
makeSequenceTable(mergers) - Remove Chimeras:
removeBimeraDenovo(seqtab, method="consensus", multithread=TRUE) - Assign Taxonomy:
assignTaxonomy(seqtab, "silva_nr99_v138.1_train_set.fa.gz", multithread=TRUE)
Protocol B: QIIME 2 via q2-dada2 Plugin (Command Line)
- Import Data:
qiime tools import --type 'SampleData[PairedEndSequencesWithQuality]' --input-path manifest.csv --output-path demux.qza --input-format PairedEndFastqManifestPhred33 - Demultiplex & Summarize:
qiime demux summarize --i-data demux.qza --o-visualization demux.qzv - Run DADA2 Denoising:
qiime dada2 denoise-paired --i-demultiplexed-seqs demux.qza --p-trunc-len-f 240 --p-trunc-len-r 200 --p-trim-left-f 10 --p-trim-left-r 10 --p-max-ee 2.0 --o-representative-sequences rep-seqs.qza --o-table table.qza --o-denoising-stats stats.qza - Generate Feature Table Summary:
qiime feature-table summarize --i-table table.qza --o-visualization table.qzv
Protocol C: mothur SOP for OTU Clustering (Based on Schloss SOP)
- Make contigs from paired ends:
make.contigs(file=stability.files) - Screen sequences:
screen.seqs(fasta=stability.trim.contigs.fasta, group=current, maxambig=0, maxlength=275) - Alignment:
align.seqs(fasta=stability.good.fasta, reference=silva.v4.align) - Filter alignment:
filter.seqs(fasta=stability.good.align, vertical=T, trump=.) - Pre-cluster sequences:
pre.cluster(fasta=stability.good.filter.fasta, group=current, diffs=2) - Chimera removal (VSEARCH):
chimera.vsearch(fasta=current, group=current) - Classify sequences:
classify.seqs(fasta=current, group=current, reference=trainset_v4.pds.fasta, taxonomy=trainset_v4.pds.tax, cutoff=80) - Cluster into OTUs:
cluster.split(fasta=current, taxonomy=current, splitmethod=classify, taxlevel=4, cutoff=0.15) - Generate shared file:
make.shared(list=current, group=current, label=0.03)
Visualized Workflows
DOT Diagram: Decision Flow for Tool Selection
Diagram Title: Tool Selection Decision Flow for 16S Analysis
DOT Diagram: Core 16S Amplicon Analysis Pipeline
Diagram Title: Core 16S Amplicon Bioinformatics Pipeline
The Scientist's Toolkit: Essential Research Reagents & Materials
| Item | Function in 16S rRNA Amplicon Sequencing |
|---|---|
| PCR Primers (e.g., 515F/806R) | Target hypervariable regions (V4) of the 16S rRNA gene for amplification. |
| High-Fidelity DNA Polymerase | Reduces PCR errors introduced during initial amplification step. |
| Dual-Index Barcoded Adapters | Enable multiplexing of hundreds of samples in a single sequencing run. |
| Magnetic Bead-Based Cleanup Kits | For post-PCR purification and size selection to remove primer dimers. |
| Quantification Kit (Qubit dsDNA HS) | Accurate measurement of library concentration prior to sequencing. |
| PhiX Control v3 | Spiked into runs on Illumina platforms for calibration and error rate monitoring. |
| Reference Databases: • SILVA • Greengenes • RDP | Curated collections of aligned 16S sequences for taxonomic classification. |
| Positive Control Mock Community | Defined mix of known bacterial genomic DNA to assess pipeline accuracy. |
| Negative Extraction Control | Monitors contamination introduced during wet-lab steps. |
| Bioinformatics Compute Resource | Minimum 8-16 GB RAM, multi-core processor for typical dataset analysis. |
In the field of microbial ecology and drug discovery, 16S ribosomal RNA (rRNA) gene amplicon sequencing has become a foundational technique. Its relative simplicity and cost-effectiveness have led to widespread adoption. However, this popularity has exposed significant challenges in reproducibility across studies, even when analyzing identical samples. This whitepates this technique is not a lack of technical skill, but insufficient attention to three pillars of reproducible science: comprehensive metadata collection, rigorous experimental and bioinformatic controls, and mandatory public data deposition in curated repositories.
The First Pillar: Comprehensive Metadata (MIxS Standards)
Metadata—data describing the data—is the bedrock of interpretation and reuse. The Genomic Standards Consortium (GSD) developed the Minimum Information about any (x) Sequence (MIxS) checklist, which includes the MIMARKS package specifically for marker gene sequences.
Key Metadata Categories for 16S Studies
Table 1: Essential MIxS-MIMARKS Metadata Categories for 16S Reproducibility
| Category | Key Fields | Purpose & Impact on Reproducibility |
|---|---|---|
| Investigation & Study Design | Study goal, experimental design, inclusion/exclusion criteria. | Allows others to understand the scientific question and sampling framework. |
| Sample & Environmental Data | Host subject data (age, health status), environmental context (pH, temp, location), collection time/date. | Critical for comparative analysis and identifying confounding variables. |
| Sample Processing | DNA extraction kit & protocol, homogenization method, storage conditions prior to extraction. | Explains bias introduced by cell lysis efficiency differences across sample types. |
| Sequencing Protocol | PCR primers (exact sequences), cycle count, polymerase used, sequencing platform & model. | Accounts for amplification bias and platform-specific error profiles. |
| Bioinformatic Processing | Raw data QC thresholds, denoising/OTU-picking algorithm & version, reference database (e.g., SILVA, Greengenes) & version. | Explains differences in final taxonomic tables and diversity metrics. |
Protocol: Implementing the MIxS Standard
- Pre-Study Planning: Before sample collection, design a metadata spreadsheet using the MIMARKS checklist as a template.
- Controlled Vocabulary: Use established terms from the Environment Ontology (ENVO) or NCBI Taxonomy.
- Digital Object Identifiers (DOIs): Assign DOIs to custom laboratory protocols via repositories like protocols.io.
- Submission: Compile all metadata into a single, machine-readable file (e.g., .tsv, .xlsx) for deposition alongside sequence reads.
The Second Pillar: Experimental and Bioinformatic Controls
Controls are non-negotiable for diagnosing contamination, tracking batch effects, and measuring technical noise.
Essential Experimental Controls
Table 2: Mandatory Experimental Controls for 16S Amplicon Sequencing
| Control Type | Composition | When to Include | Interpretation & Action |
|---|---|---|---|
| Negative Extraction Control | Sterile water or buffer processed identically through DNA extraction. | Every extraction batch. | Identifies contamination from kits or laboratory environment. Sequences > 0.1% of sample library should trigger investigation. |
| Negative PCR Control | Sterile PCR-grade water used as template in amplification. | Every PCR batch. | Detects contamination from PCR reagents or amplicon carryover. Any amplification is cause for concern. |
| Positive Control (Mock Community) | Genomic DNA from known, quantified mixture of diverse bacterial strains (e.g., ZymoBIOMICS). | Every sequencing run. | Evaluates accuracy of taxonomy assignment, precision of abundance estimation, and detects batch effects. Calculate expected vs. observed composition. |
| Technical Replicates | Same extracted DNA split and processed independently through PCR/library prep. | Subset of samples (≥10%). | Quantifies variability introduced during library preparation. |
| Process Replicates | Same original sample homogenate split and processed through independent extraction. | Subset of samples (≥10%). | Quantifies variability introduced during DNA extraction. |
Protocol: Processing a Mock Community Control
- Acquisition: Purchase a characterized mock community (e.g., ZymoBIOMICS D6300).
- Inclusion: Spike the mock community DNA into each library preparation batch at a concentration similar to samples.
- Analysis Pipeline: Process the mock community reads through the identical bioinformatic pipeline used for samples.
- Evaluation Metrics:
- Recall: Percentage of expected taxa detected.
- Precision: Are any non-expected taxa called? (Indicates contamination or database bleed).
- Bias: Fold-difference between expected and observed relative abundances.
- Calibration: Use bias metrics to inform whether abundance-based conclusions are valid.
Bioinformatic Controls and Benchmarking
Reproducibility falters at the computational stage. A bioinformatic control framework is required.
Protocol: Establishing a Bioinformatic Control Workflow
- Version Control: Use Conda environments, Docker/Singularity containers, or virtual environments to record exact versions of all software (QIIME 2, DADA2, MOTHUR, etc.).
- Parameter Documentation: Record every parameter used in a README file (e.g.,
–p-trunc-len 240,–p-chimera-method consensus). - Pipeline Benchmarking: Run the positive control (mock community) data through multiple parameter sets (e.g., different trim lengths, denoising algorithms) to choose the optimal pipeline for your specific data.
- Reproducibility Scripts: Provide all analysis code in a public repository (e.g., GitHub), from raw data to final figures.
The Third Pillar: Public Data Deposition
Complete and standardized deposition enables independent verification, meta-analysis, and method development.
Current Deposition Requirements
Table 3: Key Public Repositories for 16S Data and Metadata
| Repository | Data Type | Mandatory Fields for Submission | Journal Compliance |
|---|---|---|---|
| Sequence Read Archive (SRA) | Raw sequencing reads (FASTQ). | BioProject, BioSample, library strategy (AMPLICON), instrument model. | Required by most reputable journals. |
| European Nucleotide Archive (ENA) | Raw sequencing reads (FASTQ). | Project, sample, experiment, and run metadata in structured templates. | Required by most reputable journals. |
| Qiita | Multi-omics microbiome data. | Integrated MIxS-compliant metadata linked to processed data (feature tables). | Emerging as a standard for microbiome-specific studies. |
| GitHub / Zenodo | Analysis code & scripts. | DOI generated by Zenodo for code snapshot. Linked from manuscript. | Increasingly required for computational reproducibility. |
Protocol: Submitting to the SRA
- Create a BioProject: A high-level description of the entire research initiative.
- Create BioSamples: One for each physical sample, annotated with all relevant MIxS/MIMARKS attributes.
- Prepare Metadata Table: Use the SRA metadata template to link each BioSample to sequencing library information (primer, instrument, etc.).
- Upload Reads: Transfer FASTQ files via Aspera or FTP.
- Release Date: Set to coincide with manuscript publication. Provide the BioProject accession number in the manuscript.
The Scientist's Toolkit: Research Reagent Solutions
Table 4: Essential Reagents and Materials for Reproducible 16S Research
| Item | Example Product(s) | Function in Ensuring Reproducibility |
|---|---|---|
| Characterized Mock Community | ZymoBIOMICS Microbial Community Standard, ATCC Mock Microbial Communities | Provides a ground-truth standard for benchmarking entire workflow (wet lab and dry lab) performance. |
| Ultra-Pure Water | Molecular biology-grade, PCR-certified water (e.g., Invitrogen, Millipore). | Minimizes background contamination in negative controls, ensuring signal fidelity. |
| High-Fidelity Polymerase | KAPA HiFi HotStart ReadyMix, Q5 High-Fidelity DNA Polymerase. | Reduces PCR amplification errors that create artifactual sequence variants. |
| Barcoded Primer Sets | Golay error-correcting barcodes, 16S V4 primer pair (515F/806R) with Illumina adapters. | Enables multiplexing while minimizing sample misassignment due to index hopping or sequencing errors. |
| Standardized Extraction Kits | DNeasy PowerSoil Pro Kit, MagMAX Microbiome Ultra Nucleic Acid Isolation Kit. | Provides consistent, documented lysis conditions. Critical for comparative studies. |
| Quantification Standards | dsDNA High-Sensitivity Assay kits (Qubit), synthetic DNA spikes. | Allows accurate normalization prior to pooling, preventing abundance bias from quantification error. |
Integrated Workflow Diagram
Diagram Title: Three Pillar Workflow for Reproducible 16S rRNA Sequencing
For the beginner and the expert alike, reproducibility in 16S amplicon sequencing is not an afterthought but a discipline integrated into every project phase. It demands meticulous metadata capture guided by community standards, the systematic use of controls to bound technical uncertainty, and a commitment to complete public data deposition to close the scientific loop. By rigorously implementing these three pillars, the field can strengthen the foundation upon which discoveries in microbial ecology and microbiome-based drug development are built.
Beyond 16S: Validating Findings and Choosing the Right 'Omics Tool for Your Study
Within the framework of a comprehensive beginner's guide to 16S rRNA amplicon sequencing research, a critical thesis emerges: sequencing data alone is insufficient for robust microbial community analysis. While 16S sequencing excels at revealing taxonomic composition and relative abundances, it is inherently limited by PCR bias, inability to distinguish live/dead cells, and lack of functional or absolute quantitative data. Validation through complementary techniques is therefore essential for generating reliable, biologically meaningful conclusions. This whitepaper details three pivotal methods—quantitative PCR (qPCR), Fluorescence In Situ Hybridization (FISH), and Culturomics—that provide orthogonal validation for 16S amplicon findings.
Complementary Technique 1: Quantitative PCR (qPCR)
Purpose & Rationale
qPCR provides absolute quantification of specific bacterial taxa or total bacterial load, converting relative abundances from 16S sequencing into absolute numbers (e.g., gene copies per gram of sample). This corrects for the compositional nature of sequencing data, where an increase in one taxon's relative abundance can artifactually decrease others.
Detailed Protocol: Absolute Quantification of Total Bacteria
- DNA Extraction: Use the same extract as for 16S sequencing to ensure comparability.
- Primer Selection: Use universal 16S rRNA gene primers (e.g., 341F/534R, targeting the V3-V4 region). A standard curve must be created using a plasmid containing a cloned 16S rRNA gene insert of known concentration.
- qPCR Reaction Setup:
- Master Mix: 10 µL SYBR Green or TaqMan master mix.
- Primers: 0.8 µL each (10 µM stock).
- DNA Template: 2-5 µL (optimize to fall within standard curve).
- Nuclease-free water to 20 µL.
- Thermocycling Conditions:
- Initial Denaturation: 95°C for 3 min.
- 40 Cycles: Denaturation at 95°C for 15 sec, Annealing/Extension at 60°C for 60 sec (with fluorescence acquisition).
- Melt Curve: 60°C to 95°C, increment 0.5°C.
- Data Analysis: Plot Cq values against the log of the standard copy number. Use the linear regression to calculate the absolute 16S gene copy number in unknown samples.
Data Presentation: qPCR vs. 16S Relative Abundance
Table 1: Discrepancy Resolution Between 16S Relative Abundance and qPCR Absolute Quantification
| Sample Condition | 16S Result: Lactobacillus Relative Abundance | qPCR Result: Total Bacterial Load (16S copies/µg DNA) | qPCR Result: Lactobacillus spp. Absolute Count (copies/µg DNA) | Interpretation |
|---|---|---|---|---|
| Healthy Control | 25% | 1.0 x 10^9 | 2.5 x 10^8 | Baseline |
| Antibiotic-Treated | 50% (2-fold increase) | 2.0 x 10^8 (5-fold decrease) | 1.0 x 10^8 (2.5-fold decrease) | Lactobacillus proportion increased not due to growth, but to greater decline of competing taxa. |
Complementary Technique 2: FluorescenceIn SituHybridization (FISH)
Purpose & Rationale
FISH visualizes and quantifies spatially resolved, intact microbial cells within a sample (e.g., tissue section, biofilm). It validates 16S taxonomy at the single-cell level and provides critical spatial context (microcolonies, host-microbe interactions) absent from bulk sequencing. It primarily targets rRNA, correlating with metabolic activity.
Detailed Protocol: FISH for Tissue Sections
- Sample Fixation & Sectioning: Fix tissue in 4% paraformaldehyde (4°C, 4-16h). Embed in paraffin and section at 5 µm thickness. Mount on charged slides.
- Deparaffinization & Permeabilization: Deparaffinize with xylene and ethanol series. Treat with proteinase K (10 µg/mL, 10 min, 37°C) for permeabilization.
- Hybridization: Apply hybridization buffer containing taxon-specific, fluorophore-labeled oligonucleotide probe (e.g., EUB338 for Bacteria, species-specific probe at 50 ng/µL). Hybridize at 46°C for 90 min in a humidified chamber.
- Washing: Wash slides in pre-warmed stringent wash buffer (48°C, 20 min) to remove unbound probe.
- Counterstaining & Mounting: Counterstain nuclei with DAPI (1 µg/mL). Mount with anti-fade mounting medium.
- Imaging & Analysis: Image with epifluorescence or confocal microscopy. Quantify using image analysis software (e.g., FIJI/ImageJ) to determine bacterial abundance and location.
Diagram 1: FISH Workflow for Tissue Samples
Complementary Technique 3: Culturomics
Purpose & Rationale
Culturomics employs high-throughput, diverse culture conditions to isolate live microorganisms, providing strains for downstream functional validation (e.g., antibiotic resistance, metabolite production). It directly addresses the "great plate count anomaly" and validates the viability of taxa identified by 16S sequencing.
Detailed Protocol: High-Throughput Culturomics
- Sample Preparation: Serially dilute sample in sterile PBS or saline.
- Multi-Condition Inoculation: Plate dilutions onto a variety of media:
- Rich Media: Blood agar, Brain Heart Infusion agar.
- Selective Media: Columbia colistin-nalidixic acid (CNA) agar for Gram-positives, MacConkey for Gram-negatives.
- Specialized Media: Media supplemented with rumen fluid, haemin, or specific antibiotics to target fastidious taxa.
- Liquid Enrichment: Use multiple broths with different atmospheres (aerobic, anaerobic, microaerophilic).
- Incubation: Incubate plates/broths at various temperatures (e.g., 28°C, 37°C) and atmospheres for up to 30 days. Regularly check for growth.
- Colony Picking & Identification: Pick morphologically distinct colonies. Identify isolates via MALDI-TOF MS or 16S rRNA gene Sanger sequencing. Compare to 16S amplicon sequencing taxonomy list.
The Scientist's Toolkit
Table 2: Essential Research Reagents & Materials for Validation Techniques
| Technique | Key Reagent/Material | Function & Rationale |
|---|---|---|
| qPCR | SYBR Green or TaqMan Master Mix | Contains polymerase, dNTPs, and dye/ probe for fluorescence-based detection of amplicons. |
| Cloned 16S Gene Plasmid | Essential for generating a standard curve of known copy number for absolute quantification. | |
| FISH | Fluorophore-Labeled Oligonucleotide Probe (e.g., Cy3-EUB338) | Binds specifically to complementary 16S rRNA sequences in fixed cells, enabling visualization. |
| Proteinase K | Digests proteins in the cell wall/membrane, allowing probe penetration (permeabilization). | |
| Stringent Wash Buffer | Removes nonspecifically bound probes, ensuring signal specificity. | |
| Culturomics | Diverse Culture Media (Rich, Selective, Enriched) | Expands the range of cultivable bacteria beyond standard lab conditions. |
| Anaerobic Chamber or Gas-Pak System | Creates an oxygen-free environment essential for cultivating obligate anaerobes. | |
| MALDI-TOF MS System | Enables rapid, low-cost identification of bacterial isolates based on protein profiles. |
Diagram 2: Integrating Techniques to Validate 16S Data
For the researcher navigating 16S rRNA amplicon sequencing, moving from descriptive lists to validated biological insight requires a multi-method approach. qPCR adds the essential dimension of absolute quantity, FISH provides visual and spatial confirmation, and Culturomics bridges sequence data with viable isolates for functional studies. Employing these techniques in a complementary fashion, as guided by the initial 16S results, transforms a preliminary sequencing survey into a robust and defensible microbiological study, a core tenet of any rigorous thesis in this field.
This guide provides a detailed technical comparison of 16S rRNA amplicon sequencing and shotgun metagenomics, focusing on resolution and cost. This analysis is framed within the context of a broader thesis on initiating 16S sequencing research, offering beginners a foundation to understand the trade-offs when selecting a microbial community profiling method.
Core Methodological Principles
16S rRNA Amplicon Sequencing targets the hypervariable regions of the conserved 16S rRNA gene. PCR amplification with universal primers is followed by high-throughput sequencing, enabling taxonomic classification primarily to the genus level.
Shotgun Metagenomics involves random fragmentation and sequencing of all genomic DNA in a sample. This approach allows for taxonomic profiling to the species or strain level and provides functional insight by characterizing genes and metabolic pathways.
Comparative Analysis: Resolution and Cost
The choice between methods hinges on a trade-off between the depth of information (resolution) and the financial and computational resources required (cost).
Table 1: Comparative Analysis of Key Parameters
| Parameter | 16S rRNA Amplicon Sequencing | Shotgun Metagenomics |
|---|---|---|
| Primary Target | 16S rRNA gene hypervariable regions | Total genomic DNA |
| Taxonomic Resolution | Genus-level (occasionally species) | Species to strain-level |
| Functional Insight | Inferred from taxonomy | Directly profiled via gene content |
| PCR Bias | Yes (amplification step) | No (subject to other biases) |
| Sequencing Depth (Typical) | 50,000 - 100,000 reads/sample | 10 - 40 million reads/sample |
| Cost per Sample (Approx.) | $20 - $100 | $150 - $500+ |
| Bioinformatics Complexity | Moderate | High |
| Reference Database | 16S-specific (e.g., SILVA, Greengenes) | Comprehensive genomic (e.g., NCBI, KEGG) |
| Host DNA Contamination | Minimal impact (targeted) | Major concern, requires depletion |
Table 2: Cost Breakdown (Example for 96 Samples)
| Cost Component | 16S Sequencing | Shotgun Metagenomics |
|---|---|---|
| Library Prep & Sequencing | $5,000 - $10,000 | $30,000 - $60,000 |
| Data Analysis (Compute) | $500 - $2,000 | $5,000 - $15,000 |
| Total Approximate Cost | $5,500 - $12,000 | $35,000 - $75,000 |
| Cost per Sample | ~$57 - $125 | ~$365 - $780 |
Note: Costs are approximate and vary by region, provider, depth, and service level.
Detailed Experimental Protocols
Protocol 1: Standard 16S rRNA Amplicon Sequencing Workflow
- DNA Extraction: Use a bead-beating mechanical lysis kit (e.g., DNeasy PowerSoil Pro) for robust cell wall disruption. Include negative controls.
- PCR Amplification: Amplify the target hypervariable region (e.g., V3-V4) using universal primers (e.g., 341F/806R) with overhang adapters. Use a high-fidelity polymerase. Include PCR controls.
- Library Preparation: Index the amplicons via a limited-cycle PCR adding dual indices and sequencing adapters.
- Pooling & Clean-up: Normalize and pool libraries, then purify.
- Sequencing: Load onto an Illumina MiSeq (2x300 bp) or NovaSeq platform.
- Bioinformatics: Process using QIIME 2 or DADA2 for denoising, ASV/OTU picking, and taxonomy assignment.
Protocol 2: Standard Shotgun Metagenomic Workflow
- High-Quality DNA Extraction: Use a method yielding high-molecular-weight DNA (>10 kb). Assess integrity via gel electrophoresis or Fragment Analyzer.
- Host DNA Depletion (if needed): For host-associated samples (e.g., stool, tissue), use probe-based kits (e.g., NEBNext Microbiome DNA Enrichment Kit).
- Library Preparation: Fragment DNA via sonication or enzymatic digestion. Perform end-repair, A-tailing, and ligation of indexed adapters. Use size selection (e.g., SPRI beads).
- Quantification & Pooling: Precisely quantify libraries via qPCR (e.g., KAPA Library Quant Kit) before equimolar pooling.
- Sequencing: Sequence on an Illumina NovaSeq (150 bp paired-end) to achieve high depth.
- Bioinformatics: Perform quality trimming (Trimmomatic), filter host reads (Bowtie2), perform de novo and/or reference-based assembly (MEGAHIT, metaSPAdes), and annotate genes (Prokka, HUMAnN3).
Visualizing Method Selection and Workflows
Title: Decision Flowchart for 16S vs. Shotgun Sequencing
Title: 16S and Shotgun Experimental Workflow Comparison
The Scientist's Toolkit: Key Research Reagent Solutions
Table 3: Essential Materials and Reagents
| Item | Function | Example Product(s) |
|---|---|---|
| Bead-Beating DNA Extraction Kit | Mechanical and chemical lysis for diverse cell walls; removes inhibitors. | Qiagen DNeasy PowerSoil Pro, MP Biomedicals FastDNA Spin Kit |
| PCR Enzymes (High-Fidelity) | Accurate amplification of target 16S regions with low error rates. | KAPA HiFi HotStart ReadyMix, Q5 High-Fidelity DNA Polymerase (NEB) |
| Universal 16S Primers | Amplify conserved regions flanking hypervariable zones (e.g., V4). | 515F/806R, 27F/1492R (with Illumina overhangs) |
| Library Prep Kit (Shotgun) | Fragments DNA, adds adapters/indexes for Illumina sequencing. | Illumina DNA Prep, NEBNext Ultra II FS DNA Library Prep Kit |
| Host Depletion Kit | Selectively removes host (e.g., human) DNA from samples. | NEBNext Microbiome DNA Enrichment Kit, QIAseq HostZERO |
| Size Selection Beads | Clean up and select DNA fragments by size (e.g., post-PCR, post-ligation). | SPRIselect / AMPure XP Beads |
| Library Quantification Kit | Accurate qPCR-based quantification for optimal sequencing pooling. | KAPA Library Quantification Kit (Illumina) |
| Positive Control Mock Community | Validates entire workflow, from extraction to bioinformatics. | ZymoBIOMICS Microbial Community Standard |
For researchers beginning with 16S rRNA sequencing, the method offers a cost-effective, high-throughput entry point for comparative taxonomic studies. However, understanding its limitations in resolution and functional inference is critical. When the research question demands strain-level discrimination, comprehensive functional profiling, or the discovery of novel genes, shotgun metagenomics is the necessary choice, despite its higher financial and computational costs. The decision ultimately maps directly to the study's specific hypotheses, required analytical depth, and available resources.
Within the foundational context of a 16S rRNA amplicon sequencing beginner guide, this whitepaper explores the evolution of microbial community analysis. While 16S sequencing establishes the census of "who is there," it provides limited functional insight. Metatranscriptomics and metaproteomics are advanced methodologies that bridge this gap, characterizing active gene expression and protein synthesis to answer "what are they doing." This guide provides a technical comparison, detailed protocols, and essential tools for researchers and drug development professionals moving from taxonomic profiling to functional characterization.
Core Technology Comparison
Table 1: Quantitative Comparison of Microbial Community Analysis Methods
| Feature | 16S rRNA Amplicon Sequencing | Metatranscriptomics | Metaproteomics |
|---|---|---|---|
| Target Molecule | 16S rRNA gene (DNA) | Total RNA (primarily mRNA) | Proteins/Peptides |
| Primary Output | Taxonomic composition & diversity | Gene expression profiles | Protein abundance & activity |
| Functional Insight | Inferred from taxonomy | Direct (expressed genes) | Direct (functional molecules) |
| Typical Sequencing Depth | 10,000 - 100,000 reads/sample | 20 - 100 million reads/sample | N/A (MS-based) |
| Turnaround Time | 1-3 days (post-library prep) | 3-7 days (post-library prep) | 5-10 days (sample-to-data) |
| Relative Cost per Sample | $ | $$$ | $$$$ |
| Major Technical Bias | PCR primers, copy number | rRNA depletion, RNA stability | Protein extraction, ionization efficiency |
| Bioinformatics Complexity | Moderate | High | Very High |
Table 2: Data Type and Downstream Application Comparison
| Aspect | 16S rRNA Amplicon Sequencing | Metatranscriptomics | Metaproteomics |
|---|---|---|---|
| Key Databases | SILVA, Greengenes, RDP | NCBI nt/nr, KEGG, COG | UniProt, SEED, KEGG |
| Common Tools | QIIME 2, MOTHUR, DADA2 | KneadData, HUMAnN, DESeq2 | MetaProteomeAnalyzer, MaxQuant, ProteomeDiscoverer |
| Links to Host | Indirect (correlation) | Direct (host-pathogen expression) | Direct (host-protein interaction) |
| Drug Discovery Utility | Biomarker identification, dysbiosis | MOA of drugs, resistance markers | Direct drug target identification, toxicity |
Detailed Experimental Protocols
Protocol 1: Standard 16S rRNA Gene Amplicon Sequencing (Illumina MiSeq)
Sample Preparation: Extract genomic DNA using a bead-beating kit (e.g., DNeasy PowerSoil Pro) to ensure lysis of tough cells. PCR Amplification: Amplify the V3-V4 hypervariable region using primers 341F (5'-CCTACGGGNGGCWGCAG-3') and 805R (5'-GACTACHVGGGTATCTAATCC-3') with attached Illumina adapters. Use a high-fidelity polymerase (e.g., KAPA HiFi) for 25-30 cycles. Library Preparation: Clean amplicons with magnetic beads. Perform a second, limited-cycle PCR to add dual-index barcodes and full Illumina sequencing adapters. Sequencing: Pool libraries, quantify by qPCR, and sequence on a MiSeq using 2x300 bp v3 chemistry. Bioinformatics: Process raw reads through a pipeline like QIIME 2: demultiplex, denoise (DADA2), assign taxonomy (classifier trained on SILVA 138), and analyze diversity.
Protocol 2: Metatranscriptomic Analysis of a Gut Microbiome Sample
RNA Extraction & Stabilization: Preserve sample immediately in RNAlater. Extract total RNA using a phenol-chloroform method (e.g., TRIzol) combined with mechanical lysis. Treat with DNase I. rRNA Depletion: Use a commercial kit (e.g., Illumina Ribo-Zero Plus) to deplete bacterial and host rRNA. Verify depletion with Bioanalyzer. Library Preparation: Fragment enriched mRNA (approx. 200-300 nt). Synthesize cDNA, perform end-repair, A-tailing, and adapter ligation (Illumina TruSeq Stranded Total RNA Kit). Amplify library with 10-12 cycles of PCR. Sequencing: Sequence on an Illumina NovaSeq platform for ≥50 million 2x150 bp paired-end reads per sample. Bioinformatics: Quality trim (Trimmomatic). Remove residual host reads (Bowtie2 vs. human genome). Assemble transcripts (metaSPAdes). Quantify expression (Salmon) and annotate against functional databases (HUMAnN 3.0).
Protocol 3: MetaProteomic Workflow for Soil Microbial Communities
Protein Extraction: Suspend 1g of soil in 5 mL of extraction buffer (100 mM Tris-HCl, pH 8.0, 1% SDS). Use a combination of bead-beating and repeated freeze-thaw cycles. Centrifuge to pellet debris. Protein Clean-up & Digestion: Precipitate proteins using the methanol/chloroform method. Redissolve pellet in 8M urea buffer. Reduce (DTT), alkylate (iodoacetamide), and digest with trypsin (1:50 enzyme:protein) overnight at 37°C after diluting urea. LC-MS/MS Analysis: Desalt peptides (C18 stage tip). Separate on a nanoLC system (C18 column, 90-minute gradient). Analyze with a high-resolution tandem mass spectrometer (e.g., Q-Exactive HF) in data-dependent acquisition mode. Data Processing: Search MS/MS spectra against a protein database derived from a co-assembled metagenome of the sample using search engines (Comet, X!Tandem) within the MetaProteomeAnalyzer platform. Apply FDR cutoff of 1%.
Visualized Workflows and Relationships
Title: From Sample to Multi-Omic Insight Workflow
Title: Metatranscriptomics Analysis Pipeline Steps
The Scientist's Toolkit: Essential Research Reagents & Materials
Table 3: Key Reagent Solutions for Functional Microbiome Analysis
| Item | Function | Example Product/Catalog |
|---|---|---|
| RNAlater Stabilization Solution | Preserves RNA integrity immediately upon sample collection by inhibiting RNases. | Thermo Fisher Scientific AM7020 |
| Mechanical Lysis Beads (0.1mm) | Ensures complete disruption of tough microbial cell walls (Gram-positive, spores) for nucleic acid/protein extraction. | Zymo Research S6012-50 |
| Ribo-Zero Plus rRNA Depletion Kit | Removes >99% of bacterial and host ribosomal RNA to enrich for mRNA in metatranscriptomic libraries. | Illumina 20037125 |
| KAPA HiFi HotStart ReadyMix | High-fidelity PCR enzyme for accurate, low-bias amplification of 16S amplicons. | Roche 7958935001 |
| Trypsin, Sequencing Grade | Protease for specific digestion of proteins into peptides for LC-MS/MS analysis. | Promega V5111 |
| C18 Desalting Tips (StageTips) | Microscale purification and desalting of peptide mixtures prior to LC-MS/MS. | Thermo Fisher Scientific 87782 |
| SILVA SSU Ref NR 99 Database | Curated reference database for accurate taxonomic classification of 16S rRNA sequences. | SILVA Release 138.1 |
| UniProtKB Reference Proteomes | Comprehensive protein sequence database for metaproteomic search engines. | UniProt Release 2023_04 |
Transitioning from 16S rRNA sequencing to metatranscriptomics and metaproteomics represents a shift from a taxonomic census to a dynamic, functional interrogation of microbial communities. While the complexity, cost, and bioinformatic demands increase significantly, the payoff is a direct view of microbial activity, regulation, and metabolism. For drug developers, this functional layer is indispensable for identifying novel therapeutic targets, understanding mechanisms of action, and discovering biomarkers of efficacy or toxicity. Integrating these multi-omic approaches provides a powerful, holistic framework for moving beyond "who is there" to definitively answer "what are they doing."
Integrating 16S Data with Host Genomics and Metabolomics for Systems Biology
This whitepaper provides a technical guide for integrating multi-omics data—specifically 16S rRNA amplicon sequencing, host genomics, and metabolomics—to construct a systems-level understanding of host-microbiome interactions. Framed within the context of advancing beyond beginner 16S analysis, this guide details experimental design, data processing, integration methodologies, and interpretation for research and therapeutic discovery.
Moving from descriptive 16S rRNA amplicon sequencing to mechanistic systems biology requires integration with host molecular data. This integration elucidates how microbial communities influence and are influenced by host genetics and metabolism, offering profound insights for understanding disease etiology and identifying novel drug targets.
Foundational Technologies and Data Types
16S rRNA Amplicon Sequencing
Profiles microbial community composition and diversity via targeted amplification of hypervariable regions (e.g., V3-V4).
Host Genomics
Identifies host genetic variants (e.g., SNPs from Whole Genome Sequencing - WGS) that may predispose individuals to specific microbiome states or mediate host response to microbes.
Metabolomics
Profiles the small-molecule metabolite complement (e.g., via Mass Spectrometry - MS or Nuclear Magnetic Resonance - NMR) in host samples (serum, feces, tissue), representing a functional readout of host-microbiome activity.
Experimental Design & Cohort Considerations
Successful integration begins with robust experimental design.
Key Principles:
- Matched Samples: All omics data (16S, genomics, metabolomics) must be generated from the same biological subject and, where relevant, the same sample type (e.g., fecal sample for 16S and fecal metabolomics; blood for host DNA).
- Longitudinal vs. Cross-Sectional: Longitudinal sampling captures dynamics and causal inferences, while cross-sectional studies identify associations.
- Confounding Factors: Record and control for diet, medication (especially antibiotics), age, BMI, and batch effects.
Detailed Methodological Pipelines
16S rRNA Amplicon Sequencing Protocol
Objective: Generate microbial community profiles.
- DNA Extraction: Use a bead-beating mechanical lysis kit (e.g., Qiagen DNeasy PowerSoil Pro Kit) for robust Gram-positive bacterial lysis. Include extraction controls.
- PCR Amplification: Amplify the V3-V4 hypervariable region using primers 341F (5’-CCTACGGGNGGCWGCAG-3’) and 805R (5’-GACTACHVGGGTATCTAATCC-3’). Use a high-fidelity polymerase. Include negative (no-template) and positive (mock community) controls.
- Library Preparation & Sequencing: Clean amplicons, attach dual-index barcodes via a limited-cycle PCR, pool libraries, and sequence on an Illumina MiSeq (2x300 bp) or NovaSeq platform to achieve ≥10,000 reads/sample after quality control.
Host Whole Genome Sequencing Protocol
Objective: Identify host genetic variants.
- DNA Extraction: Extract high-molecular-weight DNA from blood or saliva (e.g., using Qiagen PureGene kit). Quantity via fluorometry.
- Library Preparation: Fragment DNA, perform end-repair, A-tailing, and ligate with sequencing adapters (e.g., Illumina DNA Prep Kit).
- Sequencing: Sequence on an Illumina platform (e.g., NovaSeq) to achieve >30x coverage.
Untargeted Metabolomics Protocol (LC-MS)
Objective: Profile a broad range of metabolites.
- Sample Preparation: For fecal or serum samples, add cold methanol/acetonitrile (e.g., 80% methanol) for protein precipitation. Vortex, incubate at -20°C, then centrifuge. Collect supernatant and dry in a vacuum concentrator. Reconstitute in appropriate solvent for LC-MS.
- LC-MS Analysis:
- Chromatography: Use reversed-phase (C18) and HILIC columns for broad metabolite separation.
- Mass Spectrometry: Operate in both positive and negative electrospray ionization (ESI) modes on a high-resolution mass spectrometer (e.g., Q-Exactive Orbitrap). Use data-dependent acquisition (DDA) for MS/MS.
- Data Processing: Use software (e.g., MS-DIAL, XCMS) for peak picking, alignment, and annotation against databases (e.g., HMDB, GNPS).
Data Processing & Integration Workflow
Diagram Title: Multi-Omic Data Integration Workflow
Individual Omic Data Processing
Table 1: Core Bioinformatics Pipelines for Each Omic Data Type
| Data Type | Primary Tool(s) | Key Output | Critical Parameters |
|---|---|---|---|
| 16S rRNA | DADA2, QIIME 2, mothur | Amplicon Sequence Variant (ASV) table, Taxonomy table | TruncLen (quality trimming), maxEE (expected errors), chimera removal. |
| Host Genomics | BWA, GATK, Plink | VCF file, Genotype calls, QC’d SNP matrix | Base quality recalibration, variant filtering (e.g., MAF > 0.01, call rate > 95%). |
| Metabolomics | XCMS, MS-DIAL, MetaboAnalyst | Peak intensity table with putative annotations | Peak width, m/z tolerance, retention time alignment, blank subtraction. |
Statistical Integration Methods
Goal: Move from parallel analyses to true integration where datasets interrogate each other.
Primary Approaches:
- Correlation-Based Networks: Calculate pairwise associations (e.g., Spearman) between microbial taxa (from 16S), metabolite levels, and host SNP genotypes (coded as 0,1,2). Construct multi-layered networks visualized in Cytoscape.
- Multivariate Methods: Use tools like MMINP or mixOmics (R package) to perform methods such as:
- Sparse Canonical Correlation Analysis (sCCA): Identifies linear combinations of features from two omics datasets with maximal correlation.
- Multi-Block Partial Least Squares (MB-PLS): Models relationships between multiple blocks of data (e.g., Microbiome, Genomics, Metabolomics) and a phenotype of interest.
- Pathway-Centric Integration: Map significant microbial taxa and metabolites to known biological pathways (e.g., via KEGG, MetaCyc). Overlay host genetic variants in relevant pathways (e.g., immune signaling).
Diagram Title: Integrative Host-Microbe-Metabolite Pathway Model
The Scientist's Toolkit: Essential Research Reagents & Materials
Table 2: Key Reagent Solutions for Integrated Multi-Omic Studies
| Item | Function/Application | Example Product |
|---|---|---|
| Bead-Beating Lysis Kit | Mechanical and chemical lysis for comprehensive microbial DNA extraction from complex samples (feces, soil). | Qiagen DNeasy PowerSoil Pro Kit |
| PCR Inhibitor Removal Beads | Critical for clean PCR from samples like feces; improves 16S amplification efficiency. | Zymo Research OneStep PCR Inhibitor Removal Kit |
| Mock Microbial Community | Essential positive control for 16S sequencing pipeline accuracy and reproducibility. | ZymoBIOMICS Microbial Community Standard |
| Stable Isotope Internal Standards | For quantitative metabolomics; corrects for variability in MS ionization efficiency. | Cambridge Isotope Laboratories MSK-CUSTOM-IS |
| High-Fidelity DNA Polymerase | Reduces PCR errors during 16S amplicon and genomic library preparation. | NEB Q5 Hot Start High-Fidelity Master Mix |
| Magnetic Bead-Based Cleanup Kits | For post-PCR purification and library size selection in NGS workflows. | Beckman Coulter SPRIselect Reagent |
| LC-MS Grade Solvents | Essential for low-background, reproducible metabolomics data. | Fisher Chemical Optima LC/MS Grade Acetonitrile |
| DNA/RNA Shield | Preserves sample integrity for concurrent or future multi-omic analysis (e.g., metatranscriptomics). | Zymo Research DNA/RNA Shield |
Case Study: Integrating Data for Hypothesis Generation
Scenario: Investigating the gut microbiome's role in Type 2 Diabetes (T2D) predisposition.
- Association: Host genomics identifies a SNP near the SLC30A8 gene (zinc transporter) associated with T2D status.
- Microbiome Link: This SNP genotype correlates with reduced abundance of Akkermansia muciniphila (16S data).
- Functional Metabolite: A. muciniphila abundance positively correlates with fecal propionate levels (metabolomics).
- Integrated Hypothesis: The host risk allele in SLC30A8 leads to a depletion of A. muciniphila, reducing propionate production, which may impair glucose regulation—a testable mechanistic pathway.
Challenges & Future Directions
- Causality vs. Correlation: Integration alone does not prove mechanism. Requires follow-up in vitro and gnotobiotic mouse experiments.
- Data Heterogeneity & Scale: Computational challenges in analyzing high-dimensional, sparse datasets with different scales and distributions.
- Standardization: Lack of universal protocols for sample collection, storage, and data processing across labs.
- Therapeutic Translation: Moving from associations to identifying druggable microbial targets or metabolite-based therapies.
Integrating 16S data with host genomics and metabolomics transforms correlative microbial observations into testable, systems-level hypotheses. This guide provides a technical foundation for designing and executing such integrative studies, which are critical for advancing our understanding of complex diseases and accelerating the development of microbiome-informed therapeutics.
Context within 16S rRNA Amplicon Sequencing Research: This case study serves as an advanced application guide, demonstrating how foundational 16S data—detailing microbial community composition—transcends basic characterization to become a pivotal tool in translational medicine, directly shaping the development of novel therapeutics.
The integration of 16S rRNA amplicon sequencing into drug development pipelines represents a paradigm shift in understanding host-microbiome interactions. By profiling bacterial communities, researchers can deconvolute the microbiome's role in disease pathogenesis, treatment response, and toxicity. This guide details the technical application of 16S data to refine preclinical models and design more precise and effective clinical trials.
Key Data Points from Recent Studies
Table 1: Impact of Gut Microbiome on Drug Efficacy & Toxicity (Recent Findings)
| Drug/Therapeutic Area | Key 16S-Based Finding | Quantitative Association | Implication for Development |
|---|---|---|---|
| Immunotherapy (Anti-PD-1) | Response linked to specific gut commensals. | High Faecalibacterium & Ruminococcaceae abundance associated with 75% longer PFS. | Patient stratification & microbiome-based co-therapies. |
| Metformin (Type II Diabetes) | Efficacy mediated via gut microbiome shift. | Increase in Akkermansia muciniphila and Bifidobacterium spp. by 3-5 fold post-treatment. | Validates microbial mode of action; suggests biomarker. |
| Irinotecan (Chemotherapy) | Gastrointestinal toxicity driven by bacterial enzymes. | β-glucuronidase activity from E. coli strains correlates with severe diarrhea (p<0.01). | Mitigation via bacterial enzyme inhibitors or prebiotics. |
| Checkpoint Inhibitor Colitis | Specific taxa predict immune-related adverse events. | Enrichment of Bacteroides intestinalis (≥2-fold) in patients developing colitis. | Predictive biomarker for toxicity management. |
Table 2: 16S-Informed Preclinical Model Selection
| Model Type | 16S Data Utility | Typical 16S Metric Used | Outcome in Drug Testing |
|---|---|---|---|
| Humanized Microbiota Mice | Ensures human-relevant microbial pathways. | Bray-Curtis similarity to human donor >70%. | Improves predictive value of drug metabolism & efficacy. |
| Gnotobiotic Models | Tests causal role of specific bacteria. | Defined colonization with 1-10 bacterial strains. | Validates microbial targets and mechanisms of action. |
| Antibiotic-Perturbed Models | Models dysbiosis seen in patient populations. | 80-90% reduction in Shannon Diversity Index. | Assesses drug performance in compromised microbiome states. |
Experimental Protocols
Protocol 1: Longitudinal 16S Sampling in Preclinical Efficacy Studies
This protocol is critical for establishing causal links between microbiome shifts and treatment outcomes.
- Animal Model Grouping: Assign rodents (e.g., C57BL/6 mice) to Vehicle Control, Treatment, and Treatment + Antibiotic cocktail (Ampicillin, Vancomycin, Neomycin, Metronidazole) groups (n≥10).
- Baseline Fecal Collection: Collect fresh fecal pellets prior to treatment initiation. Snap-freeze in liquid N₂ and store at -80°C.
- Drug Administration & Sampling: Administer drug/vehicle daily. Collect fecal samples at Days 3, 7, 14, and at endpoint. Record efficacy readouts (e.g., tumor volume, glucose tolerance).
- DNA Extraction & 16S Library Prep:
- Extraction: Use a bead-beating optimized kit (e.g., QIAamp PowerFecal Pro DNA Kit) to ensure lysis of tough Gram-positive bacteria.
- PCR Amplification: Amplify the V3-V4 hypervariable region using primers 341F (5′-CCTAYGGGRBGCASCAG-3′) and 806R (5′-GGACTACNNGGGTATCTAAT-3′).
- Sequencing: Perform paired-end sequencing (2x300 bp) on an Illumina MiSeq platform, targeting 50,000 reads per sample.
- Bioinformatic Analysis:
- Process sequences using DADA2 (via QIIME2) to generate Amplicon Sequence Variants (ASVs).
- Classify taxonomy against the SILVA 138 reference database.
- Perform differential abundance analysis (ALDEx2 or ANCOM-BC) between treatment groups at each timepoint.
- Correlate specific ASV abundances with primary efficacy metrics using Spearman's rank.
Protocol 2: Stratifying Clinical Trial Participants Using 16S Biomarkers
A framework for incorporating microbiome screening into clinical trial design.
- Screening Phase: During trial recruitment, collect baseline stool samples from all potential participants.
- Rapid Microbiome Profiling:
- Utilize a standardized, high-throughput DNA extraction pipeline.
- Perform 16S PCR targeting a single, short hypervariable region (e.g., V4) for rapid turnaround.
- Sequence on a high-output platform (Illumina NextSeq) for batch processing.
- Biomarker Application: Quantify the pre-defined microbial signature (e.g., ratio of Faecalibacterium to Bacteroides). Apply pre-established abundance cut-offs to categorize patients as "Microbiome Favorable" or "Microbiome Unfavorable".
- Stratified Randomization: Randomize patients within each microbiome stratum to treatment and placebo arms to ensure balanced allocation.
- Outcome Analysis: Compare treatment response rates between arms within each microbiome stratum to evaluate the predictive power of the biomarker.
Visualizing the Workflow and Impact
Title: 16S Data Integration in Drug Development Pipeline
Title: Microbiome-Mediated Drug Outcome Pathways
The Scientist's Toolkit: Research Reagent Solutions
Table 3: Essential Reagents & Kits for 16S in Drug Development
| Item | Function in Workflow | Example Product(s) |
|---|---|---|
| Stabilization Buffer | Preserves microbial community structure at room temperature for clinical trial samples. | OMNIgene•GUT, DNA/RNA Shield (Zymo) |
| Mechanical Lysis Beads | Ensures complete cell wall disruption of all bacterial taxa, critical for unbiased representation. | 0.1mm & 0.5mm Zirconia/Silica beads mix |
| High-Throughput DNA Extraction Kit | Standardized, column-based purification of PCR-ready microbial DNA from complex samples. | QIAamp 96 PowerFecal Pro QIAcube HT Kit |
| 16S PCR Primers (Barcoded) | Amplifies target hypervariable region with unique barcodes for multiplex sequencing. | Illumina 16S Metagenomic Library Prep primers |
| Positive Control Mock Community | Validates entire wet-lab and bioinformatic pipeline, identifying technical bias. | ZymoBIOMICS Microbial Community Standard |
| Negative Control | Monitors contamination from reagents or environment during extraction and PCR. | Nuclease-free water processed identically to samples |
| Bioinformatic Pipeline | Processes raw sequences to produce analyzed, publication-ready data. | QIIME2, DADA2, phyloseq (R) |
The field of microbiome research, particularly 16S rRNA amplicon sequencing, is defined by rapid technological evolution. The core challenge is not merely generating data but ensuring its long-term utility amidst constantly shifting reference databases (like SILVA, Greengenes, RDP), classification algorithms (QIIME 2, mothur, DADA2), and computational pipelines. Future-proofing data in this context means adopting practices that ensure reproducibility, interoperability, and re-analyzability of microbial community datasets over decades, directly impacting downstream research in drug development and therapeutic discovery.
The Moving Targets: Databases and Algorithms
A primary threat to data longevity is the version dependency of bioinformatics tools. The quantitative summary below captures the current landscape.
Table 1: Current Major 16S rRNA Reference Databases and Key Algorithms (2024)
| Resource | Current Version (as of 2024) | Update Frequency | Primary Use | Size (Representative Sequences) |
|---|---|---|---|---|
| SILVA | SSU r138.1 | ~2-3 years | Taxonomic classification, alignment | ~2.7 million |
| Greengenes2 | 2022.10 | Irregular, major updates | Taxonomic classification, phylogeny | ~1.3 million |
| RDP | 11.5 Update 11 | Regular updates | Taxonomic classification (RDP classifier) | ~1.6 million |
| QIIME 2 | 2024.5 | Quarterly releases | End-to-end analysis pipeline | Framework, not a DB |
| DADA2 | 1.30.0 | Regular updates | ASV inference, error correction | Algorithm, not a DB |
| mothur | 1.48.0 | Regular updates | End-to-end analysis pipeline | Framework, not a DB |
Foundational Principles for Future-Proofing Data
Comprehensive Metadata Capture (MIxS Standards)
Adherence to the Minimum Information about any (x) Sequence (MIxS) standards, specifically the MIMARKS survey package for marker genes, is non-negotiable. This ensures data is findable, accessible, interoperable, and reusable (FAIR).
Raw Data Immutability and Provenance Tracking
Always archive the raw sequencing data (FASTQ files) in a stable, immutable form. Document every computational step with explicit software names, versions, parameters, and database versions used.
Experimental Protocol 1: Capturing Computational Provenance
- Containerization: Use Docker or Singularity containers to encapsulate the entire analysis environment (e.g., a specific QIIME 2 version).
- Workflow Management: Implement pipelines using Nextflow, Snakemake, or the native QIIME 2 pipeline system. These tools automatically generate provenance graphs.
- Parameter Logging: For any script or command, log the full call with all arguments to a timestamped file. Example:
A Future-Proofed Experimental Workflow
The following diagram outlines a robust, version-controlled workflow that separates raw data from analytical choices.
Diagram Title: Versioned 16S Analysis Workflow with Provenance
Strategy for Evolving Databases and Algorithms
Database-Agnostic ASV Generation
Amplicon Sequence Variants (ASVs) are finite, biologically meaningful units. Generate them using error-correction algorithms (DADA2, deblur) before classification.
Experimental Protocol 2: Database-Agnostic ASV Generation with DADA2
- Quality Filter & Trim: Use
filterAndTrim()in R, truncating based on quality profiles (e.g., truncLen=c(240,200)). - Learn Error Rates:
learnErrors()models sequencing error rates from the data. - Dereplication:
derepFastq()combines identical reads. - Core ASV Inference:
dada()applies the error model to infer true sequences. - Merge Paired Reads:
mergePairs()merges forward and reverse reads. - Construct Sequence Table:
makeSequenceTable()creates the ASV abundance table. - Remove Chimeras:
removeBimeraDenovo()filters chimeric sequences. Output: An ASV table (counts per sample) and a FASTA file of unique ASV sequences. These outputs are independent of any taxonomic database.
Decoupling Classification from Analysis
Store ASVs and their abundances separately from taxonomic assignments. This allows re-classification against newer databases without reprocessing raw data.
Diagram Title: Decoupling Taxonomy from ASVs for Re-analysis
The Scientist's Toolkit: Research Reagent Solutions
Table 2: Essential Computational & Data Management "Reagents"
| Item | Function & Purpose | Example/Format |
|---|---|---|
| Container Image | Encapsulates the exact software environment for perfect reproducibility. | Docker image, Singularity .sif file |
| Workflow Script | Defines the sequence of analysis steps, enabling automation and provenance. | Nextflow/Snakemake pipeline, QIIME 2 artifact |
| Version-Pinned Database | A static copy of the reference database used for classification. | Downloaded SILVA 138.1 FASTA and taxonomy files |
| Provenance Log File | A human- and machine-readable record of all commands and parameters executed. | Timestamped .log or .txt file, CWL/WDL descriptor |
| MIxS-Compliant Metadata | Standardized sample metadata ensuring interoperability across studies. | TSV file following MIMARKS survey specifications |
| Immutable Raw Data Archive | The primary, unaltered data that is the source of all downstream results. | FASTQ files in SRA, institutional repository, or cold storage |
| Analysis-Ready Core Objects | The key derived data objects that are decoupled from transient databases. | ASV sequence FASTA, ASV count table (BIOM format) |
Implementing a Re-analysis Strategy
Establish a schedule (e.g., biennially) to re-classify your core ASVs against updated databases using the original workflow scripts.
Experimental Protocol 3: Systematic Re-classification Protocol
- Retrieve Core Objects: Access the archived ASV sequences (FASTA) and abundance table.
- Update Classifier: Train a new classifier on the latest database version (e.g., SILVA 150) using the same classifier plugin (e.g.,
fit-classifier-naive-bayes). - Execute Classification: Run the classification command against the ASV sequences using the new, versioned classifier artifact.
- Integrate and Compare: Merge the new taxonomy with the original ASV table. Use phylogenetic placement or taxonomy comparison tools (like
taxa barplot) to assess shifts in community composition due to database changes. - Archive New Outputs: Store the new taxonomic assignments with clear labels linking them to the database version used.
By adhering to these principles—prioritizing raw data and ASV preservation, decoupling classification, and meticulously tracking provenance—researchers can ensure their 16S rRNA amplicon sequencing data remains a viable and valuable resource, capable of answering future questions with future tools.
Conclusion
16S rRNA amplicon sequencing remains an indispensable, cost-effective gateway to exploring complex microbial communities. By mastering the foundational concepts, meticulous workflow, and troubleshooting strategies outlined, researchers can generate robust, interpretable data that reliably links microbiota to host physiology. However, the true power of 16S sequencing is realized when its findings are validated with complementary methods and integrated into multi-omics frameworks. As we move towards personalized medicine, the insights derived from 16S profiling will be crucial for developing microbiome-based diagnostics, understanding drug-microbiome interactions, and engineering next-generation live biotherapeutic products. Embracing both the strengths and limitations of this technique will allow the biomedical research community to continue unraveling the profound influence of our microbial partners on health and disease.