Mastering FISH on FFPE Tissue: A Complete Protocol Guide for Cancer Research & Biomarker Discovery
This comprehensive guide details the Fluorescence In Situ Hybridization (FISH) protocol for Formalin-Fixed Paraffin-Embedded (FFPE) tissue samples, the cornerstone of retrospective molecular analysis in pathology and oncology research.
Mastering FISH on FFPE Tissue: A Complete Protocol Guide for Cancer Research & Biomarker Discovery
Abstract
This comprehensive guide details the Fluorescence In Situ Hybridization (FISH) protocol for Formalin-Fixed Paraffin-Embedded (FFPE) tissue samples, the cornerstone of retrospective molecular analysis in pathology and oncology research. We cover the foundational principles of probe design and tissue fixation, provide a step-by-step methodological workflow from sectioning to imaging, address common troubleshooting and optimization challenges for signal quality, and validate FISH against next-generation sequencing (NGS) and digital PCR. Tailored for researchers and drug development professionals, this article serves as a critical resource for accurate genomic alteration analysis in solid tumors, enabling advancements in personalized medicine and biomarker-driven clinical trials.
FISH on FFPE 101: Core Principles, Probe Design, and Tissue Architecture
Why FFPE? The Enduring Value of Archival Tissue in Translational Research
Formalin-fixed, paraffin-embedded (FFPE) tissue remains the cornerstone of clinical pathology archives and translational research. The ability to analyze vast retrospective cohorts with long-term clinical outcome data provides an irreplaceable resource for biomarker discovery, disease mechanism studies, and drug development validation. Within this context, Fluorescence In Situ Hybridization (FISH) on FFPE samples is a critical technique for detecting genetic aberrations directly within the tissue architecture, linking molecular changes to histomorphology.
Application Notes: The Quantitative Advantage of FFPE Archives
FFPE biobanks offer unparalleled access to annotated clinical samples. The following table summarizes key quantitative advantages for translational research.
Table 1: Quantitative Value Proposition of FFPE Archives in Translational Research
| Metric | Typical Value/Scope in FFPE Archives | Impact on Translational Research |
|---|---|---|
| Retrospective Cohort Size | 100s to 1,000,000s of samples per large biobank | Enables statistically powerful studies of rare events and subpopulation analyses. |
| Associated Clinical Data | 5-30+ years of longitudinal follow-up available. | Allows correlation of molecular findings with long-term outcomes (e.g., survival, therapy response). |
| Sample Age for Study | Tissues routinely processed and stored for 1-50+ years. | Facilitates long-term studies and validation of biomarkers over time. |
| Tissue Representativeness | Covers full spectrum of disease stages and normal adjacent tissue. | Provides context for disease progression and tumor microenvironment studies. |
| Cost Efficiency | Pre-collected, eliminating prospective collection costs and time. | Dramatically reduces study initiation time and financial burden. |
Table 2: Common FISH Applications in FFPE Translational Research
| Application | Target Examples (Disease Context) | Primary Translational Research Question |
|---|---|---|
| Gene Amplification | HER2 (breast/gastric cancer), MET (NSCLC), MYC (lymphomas) | Identifying patient subsets for targeted therapies; understanding resistance mechanisms. |
| Gene Deletion | 1p/19q (gliomas), CDKN2A (pan-cancer), PTEN (prostate cancer) | Prognostic stratification; identifying loss of tumor suppressors. |
| Gene Rearrangement | ALK, ROS1, RET (NSCLC), NTRK1/2/3 (pan-cancer) | Diagnosing actionable oncogenic drivers for therapy selection. |
| Aneuploidy / Polysomy | Centromeric probes for chromosomes 7, 17 (multiple cancers) | Assessing genomic instability and its correlation with aggressiveness. |
Protocols: FISH for FFPE Tissue Sections
Protocol 1: Standard Pre-Treatment for FFPE FISH
This protocol prepares FFPE tissue sections to maximize probe accessibility while preserving tissue morphology and target DNA.
Materials:
- FFPE tissue sections (4-5 µm thick) mounted on positively charged slides.
- Xylene or xylene substitute.
- Ethanol (100%, 85%, 70%).
- Citrate-based or EDTA-based antigen retrieval buffer.
- Protease digestion solution (e.g., pepsin in HCl or protease K).
- Wash buffers (2x SSC, distilled water).
- Heating source (water bath, steamer, or pressure cooker).
Method:
- Deparaffinization: Immerse slides in fresh xylene (2 changes, 10 min each).
- Rehydration: Pass slides through a graded ethanol series: 100% ethanol (2 changes, 2 min each), 85% ethanol (2 min), 70% ethanol (2 min). Rinse in distilled water.
- Antigen Retrieval: Immerse slides in pre-warmed retrieval buffer (e.g., pH 6.0 citrate buffer). Heat using a steamer (80-97°C) for 20-40 minutes or as optimized. Allow slides to cool in buffer for 20 min at room temperature.
- Wash: Rinse slides in distilled water, then wash in 2x SSC buffer for 3 min.
- Protease Digestion: Apply pre-warmed protease solution (e.g., 0.25 mg/ml pepsin in 0.01N HCl at 37°C) to the tissue section. Incubate for 5-30 minutes (time must be empirically determined for each tissue type and fixation). Optimal digestion is critical.
- Wash: Rinse slides in distilled water (1 min) followed by 2x SSC (2 changes, 2 min each).
- Dehydration: Dehydrate slides in 70%, 85%, and 100% ethanol series (2 min each). Air dry slides completely before applying probe.
Protocol 2: Hybridization and Post-Hybridization Wash
This protocol details the hybridization of fluorescently labeled DNA probes to target sequences and the removal of unbound probe.
Materials:
- Commercially available or custom FISH probe mixture.
- Denaturation solution (70% formamide in 2x SSC, pH 7.0-7.5).
- Hybridization buffer.
- Rubber cement or coverslip sealant.
- Post-hybridization wash buffer (0.4x SSC / 0.3% NP-40 or 2x SSC / 0.1% NP-40, depending on probe stringency).
- DAPI I counterstain.
- Fluorescent mounting medium.
- Hybridization oven or humidified chamber, heated plate, water bath.
Method:
- Probe Denaturation: Mix the probe with hybridization buffer according to manufacturer's instructions. Denature the probe mixture at 73°C ± 1°C for 5 minutes, then briefly place on ice.
- Tissue Denaturation: Apply denaturation solution to the tissue area and cover with a coverslip. Denature on a pre-heated plate or in a water bath at 73°C ± 1°C for 5-10 minutes.
- Dehydration: Immediately remove coverslip and dehydrate slides in the cold (4°C) ethanol series (70%, 85%, 100% for 2 min each). Air dry.
- Hybridization: Apply the denatured probe mixture to the target area, apply a coverslip, and seal with rubber cement. Incubate slides in a humidified chamber at 37°C (for DNA probes) for 12-18 hours (overnight).
- Post-Hybridization Wash: a. Remove seal and coverslip carefully. b. Wash in pre-warmed stringent wash buffer (e.g., 0.4x SSC at 72°C ± 1°C) for 2-5 minutes. c. Transfer slides to room temperature wash buffer (2x SSC / 0.1% NP-40) for 1-2 minutes.
- Counterstaining: Apply DAPI counterstain to the tissue area, cover with a coverslip, and allow to incubate in the dark for 10-15 minutes.
- Mounting: Apply anti-fade mounting medium, seal coverslip, and store slides at -20°C in the dark until imaging.
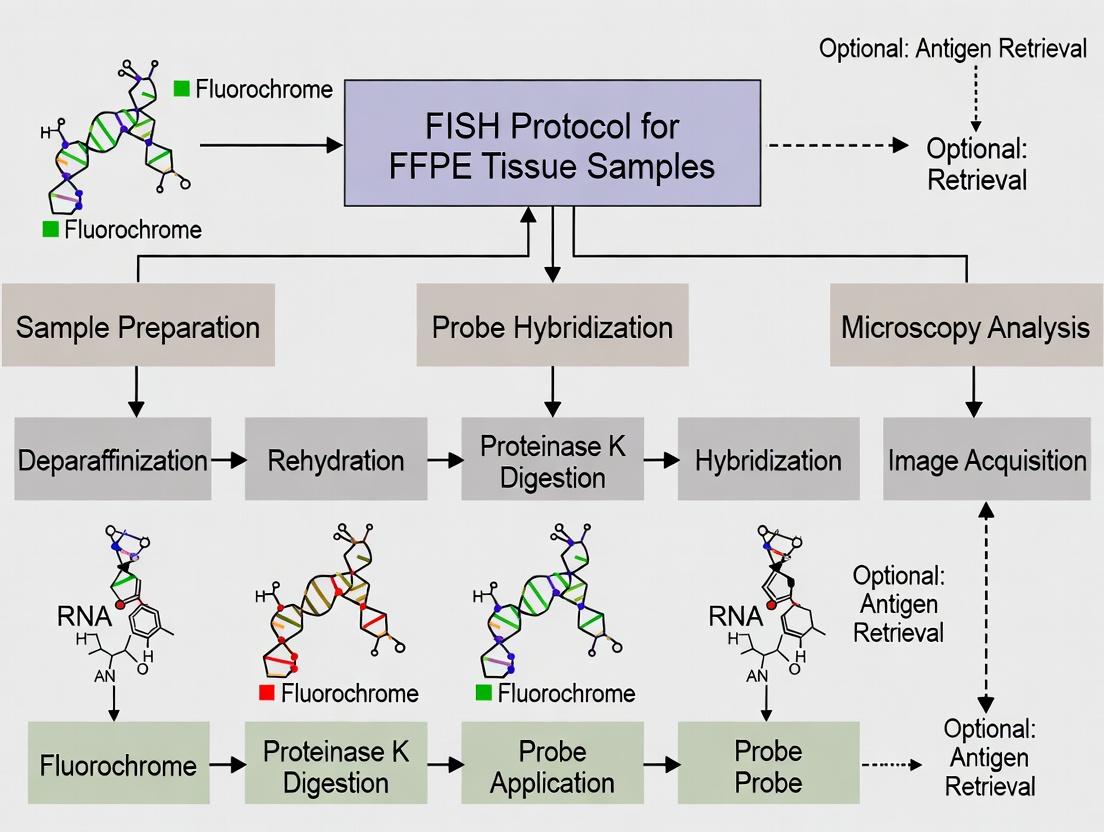
Diagrams
Title: FFPE Tissue FISH Protocol Workflow
Title: From FFPE Archive to Clinical Application via FISH
The Scientist's Toolkit: Essential Reagents & Materials for FFPE FISH
Table 3: Key Research Reagent Solutions for FFPE FISH
| Item | Function in FFPE FISH Protocol |
|---|---|
| Positively Charged Slides | Ensures strong tissue section adhesion throughout harsh pre-treatment and high-temperature steps. |
| Formalin-Fixed Paraffin-Embedded (FFPE) Tissue Block | The archival source material, preserving tissue morphology and nucleic acids for decades. |
| Commercial FISH Probe Kit (e.g., HER2/CEP17) | Validated, fluorescence-labeled DNA probes specific to target genes/regions, often with control probes. |
| Citrate-Based Antigen Retrieval Buffer (pH 6.0) | Reverses formalin-induced cross-links, making target DNA more accessible to the probe. |
| Protease Enzyme Solution (Pepsin or Protease K) | Digests proteins to further expose target DNA sequences within the fixed tissue matrix. |
| Formamide-Based Denaturation Solution | Denatures double-stranded target and probe DNA into single strands to enable hybridization. |
| Stringent Wash Buffer (0.4x SSC / NP-40) | Removes nonspecifically bound probe by controlling the stringency of hybridization conditions. |
| DAPI (4',6-diamidino-2-phenylindole) Counterstain | Fluorescent stain that binds to DNA in the nucleus, allowing visualization of tissue architecture. |
| Fluorescent Anti-Fade Mounting Medium | Preserves fluorescence signal during microscopy and storage by reducing photobleaching. |
Within the broader thesis on optimizing FISH protocols for FFPE tissue, understanding the molecular impact of formalin fixation is foundational. Formalin fixation, while essential for tissue preservation, introduces chemical modifications that directly challenge the accuracy and reliability of Fluorescence In Situ Hybridization (FISH). These Application Notes detail the core principles and provide actionable protocols to mitigate fixation-induced artifacts, enabling robust genetic analysis in clinical and drug development research.
The Chemistry of Fixation and Its Impact on DNA
Formalin (aqueous formaldehyde) primarily reacts with the amino and imino groups of nucleic acids and proteins, forming reversible methylol adducts and, crucially, irreversible methylene bridges. For DNA, this cross-linking occurs between proteins and DNA (protein-DNA) and, to a lesser extent, within DNA itself (DNA-DNA).
Primary Lesions in DNA:
- DNA-Protein Cross-links (DPCs): The most significant lesion, tethering DNA to histone and non-histone proteins. This physically impeders probe access during FISH.
- Base Modifications: (e.g., Adenine to Hydroxymethyladenine). Can alter base pairing.
- Single-Strand Breaks (SSBs): Introduced via hydrolysis during fixation and storage.
- Inter-strand Cross-links: Directly prevent DNA denaturation (strand separation), a critical step in FISH.
Quantitative Impact of Fixation Variables on DNA Quality The degradation of DNA is a function of fixation duration and the subsequent storage time of FFPE blocks.
Table 1: Effect of Fixation and Storage on DNA Quality Metrics
| Fixation Time | Block Age | Mean DNA Fragment Size (bp) | DPC Frequency (per 10^6 bp) | FISH Success Rate (%) |
|---|---|---|---|---|
| 6-24 hours | < 1 year | 500-1000 | 15-25 | >95 |
| 24-48 hours | 1-3 years | 200-500 | 25-40 | 80-90 |
| >48 hours | 3-5 years | 100-300 | 40-60 | 60-75 |
| Excessive | >5 years | <100 | >60 | <50 |
Key Protocols for Optimal FISH on FFPE Samples
Protocol 2.1: Pre-FISH DNA Integrity Assessment (QC Protocol) Purpose: To evaluate the suitability of an FFPE block for FISH analysis by quantifying DNA fragmentation and cross-link density. Materials: FFPE sections (10µm), deparaffinization reagents, DNA extraction kit, spectrophotometer/nanodrop, gel electrophoresis system. Procedure:
- Cut three 10µm sections into a microcentrifuge tube.
- Deparaffinize with xylene (2x, 10 min), followed by ethanol washes (100%, 90%, 70%).
- Extract DNA using a commercial FFPE-DNA kit with extended proteinase K digestion (18-24 hrs at 56°C with agitation).
- Elute in 30µL buffer.
- QC Steps:
- A260/A280 Ratio: Measure. A ratio of 1.8-2.0 indicates pure DNA.
- Fragment Analysis: Run 100ng on a 1.5% agarose gel. A successful smear >300bp is acceptable for FISH.
- qPCR Amplifiability Assay: Perform qPCR with amplicons of varying lengths (100bp, 200bp, 300bp). A significant drop in efficiency with longer amplicons indicates high cross-linking.
Protocol 2.2: Optimized FISH Pretreatment for FFPE Sections Purpose: To reverse cross-links and permeabilize tissue without destroying morphology or degrading target DNA. Materials: FFPE slides (4-5µm), Target Retrieval Solution (pH 6 or 9), pepsin or proteinase K, wash buffers, humidified hybridization chamber. Detailed Workflow:
- Bake & Deparaffinize: Bake slides at 60°C for 1 hr. Deparaffinize in xylene (3x, 10 min), hydrate through ethanol series to water.
- Target Retrieval (Critical): Immerse slides in pre-heated (95-98°C) citrate-based (pH 6.0) or EDTA-based (pH 9.0) retrieval solution. Incubate for 15-30 minutes. Cool at room temp for 20 min.
- Enzymatic Digestion: Rinse in PBS. Apply 100-200µL of pepsin (0.1mg/mL in 0.1N HCl) or proteinase K (10-50µg/mL). Incubate at 37°C for 5-30 minutes (optimize per tissue).
- Dehydration: Stop digestion with water rinse. Dehydrate through ethanol series (70%, 85%, 100%), air dry.
- Probe Application & Denaturation: Apply FISH probe, coverslip, and seal. Co-denature slide and probe at 75-85°C for 5-10 minutes. Hybridize overnight (16-20 hrs) at 37-42°C in a humid chamber.
Visualization of Core Concepts
Title: Formalin Lesions and FISH Challenge Pathways
Title: Optimized FFPE-FISH Experimental Workflow
The Scientist's Toolkit: Essential Research Reagent Solutions
Table 2: Key Reagents for FFPE-FISH Research
| Reagent/Material | Function in FFPE-FISH | Key Consideration |
|---|---|---|
| Neutral Buffered Formalin (NBF) | Standard fixative. Maintains morphology and antigen/DNA integrity. | Fixation time must be standardized (6-24hrs). Over-fixation is detrimental. |
| High-purity Proteinase K | Enzymatically digests proteins to reverse DPCs and permeabilize tissue. | Concentration and time require empirical optimization per tissue type. |
| pH-specific Target Retrieval Solutions | Breaks methylene bridges via heat and pH. Critical for unmasking nucleic acids. | pH 6.0 (citrate) is standard; pH 9.0 (EDTA/Tris) may be better for some targets. |
| Validated FISH Probe Mix | Contains labeled nucleic acid probe specific to target and hybridization buffer. | Use probes validated for FFPE. Buffer composition affects stringency. |
| DAPI Counterstain Antifade Mountant | Counterstains nuclei and reduces fluorescence photobleaching. | Essential for visualization and preserving signal during microscopy. |
Within the broader thesis on optimizing Fluorescence in situ Hybridization (FISH) for FFPE tissue samples, understanding probe chemistry is paramount. The choice between locus-specific, centromeric, and whole-chromosome paint probes directly impacts the resolution, specificity, and diagnostic or research outcome. This application note details their characteristics, protocols, and applications in formalin-fixed, paraffin-embedded tissue research, crucial for oncology, genetics, and drug development.
Probe Chemistry: Definitions and Applications
Locus-Specific Probes (LSI): Target unique DNA sequences, typically 100-300 kb, for detecting specific genetic alterations (e.g., gene amplifications, deletions, translocations).
Centromeric Enumeration Probes (CEP): Target highly repetitive alpha-satellite DNA sequences at centromeres (approx. 5.7 million base pairs per chromosome), used for chromosome enumeration (aneuploidy).
Whole-Chromosome Paint Probes (WCP): Comprise a cocktail of sequences spanning entire chromosomes, allowing visualization of whole chromosomes or chromosomal regions for identifying structural rearrangements.
Quantitative Data Comparison
Table 1: Comparative Analysis of FISH Probe Types for FFPE Samples
| Feature | Locus-Specific (LSI) | Centromeric (CEP) | Whole-Chromosome Paint (WCP) |
|---|---|---|---|
| Target Size | 100 - 300 kb | ~5.7 Mb (per chr.) | Entire chromosome (100-250 Mb) |
| Typical Application | Gene amplification (HER2), deletions (1p/19q), translocations (BCR::ABL1) | Aneuploidy detection (e.g., Chr 7, 17) | Complex rearrangements, marker chromosome identification |
| Signal Intensity | High (discrete foci) | Very High (bright, compact cluster) | Lower (distributed paint) |
| Optimal FFPE Section Thickness | 4-5 µm | 4-5 µm | 3-4 µm (thinner preferred) |
| Hybridization Time (Typical) | 12-16 hours | 2-6 hours | 16-24 hours |
| Common Labeling Fluorophores | SpectrumOrange, SpectrumGreen, Texas Red | SpectrumGreen, SpectrumOrange, DEAC | Multiple fluorophore mixtures (e.g., FITC, Cy3) |
| Key Challenge in FFPE | Signal fragmentation due to DNA damage | Non-specific binding to repetitive DNA elsewhere | High background; requires optimal pre-treatment |
Detailed Protocols for FFPE Tissue
Protocol 1: General FFPE Slide Pretreatment for FISH
This universal pretreatment is critical for all probe types to enable probe access.
- Bake and Deparaffinize: Bake slides at 56°C for 1 hour. Immerse in fresh xylene (3 changes, 10 min each).
- Hydrate: Pass slides through graded ethanols (100%, 85%, 70%, 2 min each) to distilled water.
- Pretreatment Wash: Immerse in pretreatment solution (e.g., 1M NaSCN or Target Retrieval Solution) at 80°C for 10-30 minutes. Rinse in distilled water.
- Proteolytic Digestion: Apply pepsin solution (e.g., 0.5 mg/ml in 0.1N HCl) at 37°C for 5-30 minutes (time must be empirically optimized per tissue block). Rinse in distilled water.
- Dehydration: Dehydrate slides through 70%, 85%, 100% ethanol series (2 min each) and air dry.
Protocol 2: Hybridization and Post-Hybridization Washes
Adapt probe-specific hybridization times as per Table 1.
- Denaturation: Apply probe mix to target area, coverslip, and seal. Co-denature slide and probe on a hybridizer at 80-83°C for 5-10 minutes.
- Hybridization: Immediately transfer to 37-42°C incubator for the probe-specific duration (2-24 hours).
- Post-Wash Stringency: Remove coverslip and wash in:
- 2X SSC/0.1% NP-40 at 72°C for 2 minutes (Stringent Wash).
- 2X SSC/0.1% NP-40 at RT for 1 minute.
- Counterstain and Mount: Apply DAPI (125 ng/ml) and mount with anti-fade medium.
Visualizing FISH Probe Selection and Workflow
Diagram Title: Decision Workflow for FISH Probe Selection in FFPE Analysis
Diagram Title: Core FFPE-FISH Protocol Steps and Key Considerations
The Scientist's Toolkit: Research Reagent Solutions
Table 2: Essential Materials for FFPE-FISH with Probe Chemistry
| Item | Function/Benefit | Example/Note |
|---|---|---|
| Hybrite / ThermoBrite | Automated slide processing for precise, reproducible denaturation & hybridization. | Standardizes temperature and time. |
| Formalin-Fixed Paraffin Sections (4-5 µm) | Optimal thickness for cell nucleus preservation and probe penetration. | Thicker sections cause signal overlap. |
| Paraffin Pretreatment Kit (NaSCN or Citrate-based) | Reverses formalin cross-links, opens chromatin structure for probe access. | Critical step affecting signal intensity. |
| Pepsin or Proteinase K | Digests proteins, removes nuclear proteins to expose target DNA. | Concentration/time must be titrated. |
| Locus-Specific Identifier (LSI) Probe | Targets specific gene loci for cancer diagnostics (e.g., HER2, ALK). | Often dual-color, break-apart designs. |
| Chromosome Enumeration Probe (CEP) | Binds centromeric repeats to count chromosome copies. | Bright signal, shorter hybridization. |
| Whole Chromosome Painting (WCP) Probe | Labels entire chromosome for identifying structural abnormalities. | Often used in metaphase/touch prep. |
| DAPI Counterstain | Fluorescent DNA stain; visualizes all nuclei for signal context. | Must be at consistent concentration. |
| Antifade Mounting Medium | Reduces photobleaching of fluorophores during microscopy. | Essential for signal preservation. |
| Stringent Wash Buffer (2X SSC/0.3% NP-40) | Removes nonspecifically bound probe; concentration and temperature are key. | Higher temp/ lower salt = more stringent. |
Within the broader thesis on Fluorescence In Situ Hybridization (FISH) protocol optimization for formalin-fixed paraffin-embedded (FFPE) tissue samples, the accurate detection of specific genomic aberrations and biomarkers is paramount for targeted cancer therapy. This article details application notes and protocols for detecting key biomarkers—HER2 amplification, ALK and ROS1 rearrangements, and Microsatellite Instability/Mismatch Repair (MSI/MMR) status—which are critical for patient stratification and treatment decisions in oncology.
HER2 Amplification Detection
Application Notes
HER2 (ERBB2) gene amplification and protein overexpression drive a subset of breast and gastric cancers. Detection guides the use of HER2-targeted therapies like trastuzumab. While IHC is a common first-line test, FISH is the gold standard for equivocal cases due to its quantitative nature.
Protocol: Dual-Probe FISH for HER2 on FFPE Tissue
Objective: To determine HER2 gene copy number relative to chromosome 17 centromere (CEP17).
Detailed Methodology:
- Sectioning & Baking: Cut 4-5 µm FFPE sections onto positively charged slides. Bake at 60°C for 60 minutes.
- Deparaffinization & Hydration: Immerse slides in xylene (3 x 10 min), followed by 100% ethanol (2 x 5 min). Air dry.
- Pretreatment: Immerse in pretreatment solution (1M sodium thiocyanate, 80°C) for 10-30 min. Rinse in deionized water.
- Proteolytic Digestion: Apply pepsin digest solution (e.g., 0.5 mg/mL in 0.1N HCl) at 37°C for 10-30 minutes. Rinse in PBS and dehydrate through ethanol series.
- Denaturation & Hybridization: Apply HER2/CEP17 dual-color probe mix. Co-denature specimen and probe at 82°C for 5 min. Hybridize at 45°C in a humidified chamber for 16-20 hours.
- Post-Hybridization Wash: Wash in 2x SSC/0.3% NP-40 at 72°C for 2 min. Air dry in darkness.
- Counterstaining & Mounting: Apply DAPI counterstain and mount with antifade medium.
- Analysis: Score 20-60 non-overlapping interphase nuclei using a fluorescence microscope. Calculate HER2/CEP17 ratio and average HER2 signals per cell.
Interpretation Criteria (ASCO/CAP):
| Result Category | HER2/CEP17 Ratio | Average HER2 Signals/Cell | IHC Correlation |
|---|---|---|---|
| Positive (Amplified) | ≥ 2.0 | Any value | 3+ |
| Equivocal | < 2.0 | ≥ 4.0 and < 6.0 | 2+ |
| Negative (Not Amplified) | < 2.0 | < 4.0 | 0, 1+ |
| Group 4 (Not Amplified) | ≥ 2.0 | < 4.0 | Rare |
ALK and ROS1 Rearrangement Detection
Application Notes
Chromosomal rearrangements in ALK (e.g., EML4-ALK) and ROS1 genes are actionable drivers in non-small cell lung cancer (NSCLC). Their detection identifies patients eligible for tyrosine kinase inhibitors (e.g., crizotinib, alectinib). Break-apart FISH is a definitive diagnostic method.
Protocol: Break-Apart FISH for ALK/ROS1 on FFPE NSCLC Samples
Objective: To detect split signals indicative of gene rearrangement.
Detailed Methodology: Steps 1-4 follow the HER2 FISH protocol for slide preparation.
- Denaturation & Hybridization: Apply ALK or ROS1 break-apart probe (labeled 5’ region in SpectrumGreen, 3’ region in SpectrumRed). Co-denature at 82°C for 5 min. Hybridize at 37°C for 16-20 hours.
- Wash & Mounting: Wash per manufacturer's instructions (similar to HER2 protocol). Counterstain with DAPI.
- Analysis: Score at least 50 tumor cells. A positive rearrangement is indicated by split 5’ and 3’ probe signals (separation > 2 signal diameters) or isolated 3’ signals (loss of 5’).
Interpretation Criteria:
| Signal Pattern | Interpretation | Positive Cut-off (Tumor Cells) |
|---|---|---|
| Fused (yellow) | Wild-type gene | - |
| Split 5’ & 3’ | Rearranged gene | ≥ 15% |
| Isolated 3’ (red) | Rearranged gene with 5’ deletion | ≥ 15% |
| Isolated 5’ (green) | Atypical, not scored as positive | - |
MSI/MMR Status Detection
Application Notes
MSI-High (MSI-H) or deficient MMR (dMMR) status is a pan-cancer biomarker predicting response to immune checkpoint inhibitors. While PCR-based microsatellite analysis detects MSI, immunohistochemistry (IHC) for MMR proteins (MLH1, MSH2, MSH6, PMS2) is widely used. FISH is not standard for MSI/MMR but is a research tool for genomic instability.
Protocol: Immunohistochemistry for MMR Protein Detection
Objective: To assess nuclear expression of four MMR proteins in tumor cells.
Detailed Methodology:
- Sectioning & Baking: Cut 4 µm FFPE sections. Bake at 60°C for 30-60 min.
- Deparaffinization & Rehydration: Use xylene and graded alcohols.
- Antigen Retrieval: Use pressure cooker or water bath with EDTA-based (pH 9.0) or citrate-based (pH 6.0) buffer for 20-30 min. Cool for 20 min.
- Endogenous Peroxidase Blocking: Incubate with 3% H₂O₂ for 10 min.
- Primary Antibody Incubation: Apply monoclonal antibodies against MLH1, MSH2, MSH6, PMS2. Incubate at room temperature for 60 min or 4°C overnight.
- Detection: Use polymer-based HRP detection system. Incubate with secondary antibody for 30 min. Apply DAB chromogen for 5-10 min.
- Counterstaining & Mounting: Counterstain with hematoxylin. Dehydrate, clear, and mount.
- Analysis: Assess nuclear staining in tumor cells. Internal positive control (normal epithelium, lymphocytes) must show intact nuclear staining.
Interpretation Criteria:
| MMR Protein Expression in Tumor Nuclei | Status Interpretation | Probable MSI Status |
|---|---|---|
| All four proteins retained (positive) | MMR Proficient (pMMR) | Microsatellite Stable (MSS) |
| Loss of one or more proteins | MMR Deficient (dMMR) | MSI-High (MSI-H) |
| Common Loss Patterns: | Associated Germline Mutation | |
| MLH1 & PMS2 lost | MLH1 or PMS2 | |
| MSH2 & MSH6 lost | MSH2 or MSH6 | |
| Isolated PMS6 lost | MSH6 | |
| Isolated PMS2 lost | PMS2 |
The Scientist's Toolkit: Research Reagent Solutions
| Item | Function in FFPE Biomarker Detection |
|---|---|
| Dual-Probe HER2/CEP17 FISH Kit | Provides standardized, validated probes for precise HER2 amplification ratio scoring. |
| Break-Apart FISH Probes (ALK, ROS1) | Fluorescently labeled probes flanking common breakpoint regions to visualize gene rearrangements. |
| MMR Protein Antibody Panel (IHC) | Monoclonal antibodies for MLH1, MSH2, MSH6, PMS2 for detecting loss of protein expression. |
| FFPE DNA/RNA Extraction Kits | Optimized for nucleic acid recovery from cross-linked, degraded FFPE material for NGS/PCR. |
| Hybridization Chamber & Sealer | Creates a sealed, humidified environment to prevent probe evaporation during hybridization. |
| Fluorescence Microscope with Filters | Equipped with specific DAPI/FITC/TRITC filters for visualizing FISH signals. |
| Antigen Retrieval Buffers (pH 6.0 & 9.0) | Critical for unmasking epitopes in FFPE tissue for accurate IHC staining. |
| Polymer-based IHC Detection System | Increases sensitivity and reduces background vs. traditional avidin-biotin systems. |
Visualizations
Diagram Title: HER2 Signaling Pathway and Amplification Impact
Diagram Title: General FISH Protocol Workflow for FFPE Tissue
Diagram Title: MSI/MMR Status Detection Clinical Logic
Essential Equipment and Reagent Overview for a Successful FISH Lab
Within the broader thesis on optimizing FISH protocols for Formalin-Fixed Paraffin-Embedded (FFPE) tissue in oncology research and companion diagnostic development, a meticulously equipped laboratory is the foundational pillar. This document provides a detailed overview of essential equipment and reagents, framed as application notes and protocols, to ensure reproducible, high-quality FISH data crucial for clinical research and drug development.
Essential Equipment and Quantitative Specifications
The core equipment for a FISH lab must ensure precise sample preparation, hybridization, and imaging. The following table summarizes key equipment with quantitative performance parameters.
Table 1: Core Laboratory Equipment for FFPE-FISH
| Equipment Category | Specific Instrument | Key Performance Parameters | Purpose in FFPE-FISH Workflow |
|---|---|---|---|
| Sample Preparation | Microtome/Cryostat | Cutting range: 1-10 µm; Recommended: 3-5 µm | Sectioning FFPE tissue blocks onto charged slides. |
| Slide Dryer/Oven | Temperature range: 37°C-65°C; Hold time: 30 min - O/N | Baking sections to ensure adhesion. | |
| Water Bath | Temperature stability: ±0.5°C; Range: 37°C-80°C | Slide warming and paraffin melting. | |
| Pretreatment & Denaturation | Pressure Cooker or Steamer | Temperature: >95°C; Time: 10-20 min (varies by protocol) | High-temperature antigen/ epitope retrieval. |
| Hybridization System (e.g., ThermoBrite) | Temperature range: 37°C-95°C; Accuracy: ±1.0°C; Capacity: 12-40 slides | Controlled denaturation and hybridization. | |
| Post-Hybridization | Shaking Water Bath | Speed: 20-60 oscillations/min; Temp: 37°C-75°C | Stringent washes to remove nonspecific probe binding. |
| Detection & Imaging | Fluorescence Microscope | Objectives: 40x, 60x, 100x oil immersion; Filter sets for DAPI, FITC, Texas Red, Cy5 | Initial visualization and analysis. |
| Digital Imaging System | Camera: High-resolution CCD/sCMOS; Software: Z-stacking, enumeration, co-localization | Image capture, analysis, and archival. |
The Scientist's Toolkit: Key Research Reagent Solutions
Table 2: Essential Reagents for FFPE-FISH Protocols
| Reagent Category | Specific Reagent/Kit | Function & Critical Notes |
|---|---|---|
| Slide Preparation | Positively Charged Slides | Ensures tissue adhesion during harsh pretreatment steps. |
| Xylene (or Xylene Substitute) | Deparaffinization agent to remove embedding paraffin wax. | |
| Ethanol Series (100%, 85%, 70%) | Dehydration and rehydration of tissue sections. | |
| Pretreatment | Pretreatment Solution (e.g., Citrate Buffer, EDTA, TRIS-EDTA) | Unmasking of target nucleic acids by reversing formalin cross-links. |
| Protease (e.g., Pepsin, Proteinase K) | Digests proteins to permeabilize tissue and allow probe access. | |
| Hybridization | FISH Probe(s) | Target-specific DNA sequences labeled directly or indirectly with fluorophores (e.g., SpectrumOrange, SpectrumGreen, DAPI as counterstain). |
| Hybridization Buffer | Contains dextran sulfate, formamide, SSC to promote probe specificity and hybridization efficiency. | |
| Post-Hybridization | Stringent Wash Buffer (e.g., 0.4X SSC / 0.3% NP-40) | Removes excess and non-specifically bound probe. Saline-Sodium Citrate (SSC) concentration and temperature are critical. |
| Detection & Mounting | Detection Reagents (for indirect probes) | Antibodies (anti-digoxigenin, anti-biotin) conjugated to fluorophores for signal amplification. |
| Fluorescence Mounting Medium with DAPI | Preserves fluorescence and counterstains nuclei for enumeration. Anti-fade agents are essential. |
Detailed Experimental Protocol: FFPE-FISH for Gene Amplification (HER2/CEP17 Example)
Protocol Title: Dual-Color FISH on FFPE Breast Carcinoma Tissue for HER2 Gene Amplification Assessment.
Objective: To determine the HER2/Chr17 ratio using a dual-probe FISH assay.
Materials:
- FFPE tissue sections (4-5 µm) on charged slides.
- Xylene, Ethanol series.
- Pretreatment solution (1X Target Retrieval Solution, pH 6.0).
- Protease solution (0.5 mg/mL Pepsin in 0.1N HCl).
- Commercially approved HER2/CEP17 dual-color FISH probe (e.g., Abbott PathVysion).
- Hybridization buffer.
- Rubber cement.
- Stringent wash buffer (0.4X SSC/0.3% NP-40, 2X SSC/0.1% NP-40).
- DAPI I counterstain.
- Equipment: Slide warmer, water bath, pressure cooker, ThermoBrite system, fluorescence microscope.
Methodology:
Deparaffinization & Hydration:
- Immerse slides in fresh xylene (3 x 10 min).
- Hydrate through ethanol series (100%, 85%, 70%) for 2 min each.
- Rinse in deionized water and air dry.
Pretreatment:
- Immerse slides in pre-warmed pretreatment solution (80°C) for 30 min in a water bath.
- Alternatively, use pressure cooker: incubate slides in boiling retrieval solution for 10-20 min, cool for 20 min.
- Rinse in deionized water, then wash in 2X SSC for 5 min.
Protease Digestion:
- Apply pre-warmed pepsin solution (37°C) to tissue and incubate for 10-20 min at 37°C in a humidified chamber.
- Rinse in 2X SSC (2 x 5 min). Dehydrate through ethanol series (70%, 85%, 100%) for 2 min each and air dry.
Denaturation & Hybridization:
- Apply 10 µL of probe mixture (HER2 SpectrumOrange/CEP17 SpectrumGreen) to target area. Apply a coverslip and seal with rubber cement.
- Co-denature slides and probe on ThermoBrite system: 73°C for 5 min.
- Hybridize at 37°C for 14-18 hours (overnight).
Post-Hybridization Wash:
- Remove rubber cement and coverslip.
- Wash in pre-warmed stringent wash buffer (73°C) for 2 min.
- Wash in room temperature 2X SSC/0.1% NP-40 for 1 min. Air dry in darkness.
Counterstaining & Visualization:
- Apply 10 µL DAPI I counterstain to target area, apply coverslip.
- Allow to set for 10 min in darkness.
- Visualize using a fluorescence microscope with appropriate filter sets.
- Enumerate HER2 (orange) and CEP17 (green) signals in at least 20 non-overlapping interphase nuclei.
Visualization: FISH Experimental Workflow and Analysis Logic
Diagram 1: FFPE FISH Experimental Workflow
Diagram 2: FISH Signal Enumeration Logic Tree
Step-by-Step FISH Protocol: From FFPE Block to Digital Imaging Analysis
The success of Fluorescence In Situ Hybridization (FISH) on Formalin-Fixed Paraffin-Embedded (FFPE) tissue samples is critically dependent on the pre-analytical phase. This initial stage, encompassing tissue selection, sectioning, and slide preparation, directly influences nucleic acid integrity, probe accessibility, and signal clarity. Within a broader thesis on FFISH protocol optimization for FFPE tissues in drug development research, rigorous standardization of these pre-analytical steps is paramount to generate reproducible, high-quality data for biomarker validation and therapeutic target assessment.
Tissue Selection for FFPE FISH Analysis
The selection of appropriate FFPE tissue blocks is the foundational step. Key considerations include:
- Pathology Review: A certified pathologist must review Hematoxylin and Eosin (H&E)-stained sections to confirm the diagnosis, assess tumor cellularity (>50-70% is ideal for most FISH assays), and identify the optimal block containing representative target morphology.
- Fixation Quality: Blocks fixed in 10% Neutral Buffered Formalin (NBF) for 6-72 hours are optimal. Under- or over-fixation can degrade nucleic acids and create cross-links that impede probe hybridization.
- Block Age: While FFPE blocks are stable for years, prolonged storage can lead to nucleic acid fragmentation. Antigen retrieval methods in FISH protocol can partially compensate for this.
Table 1: Criteria for FFPE Tissue Block Selection for FISH
| Criterion | Optimal Specification | Impact on FISH Outcome |
|---|---|---|
| Fixative | 10% NBF | Preserves morphology and nucleic acid structure. |
| Fixation Time | 6-72 hours | Insufficient fixation causes loss of material; excessive fixation causes over-crosslinking. |
| Tumor Cellularity | >50-70% | Ensures sufficient target cells for accurate enumeration of genetic alterations. |
| Block Age | <10 years preferred | Older blocks may show increased signal attenuation due to nucleic acid degradation. |
| Necrosis/Fibrosis | Minimal (<10%) | Non-cellular areas yield no signal and can cause tissue loss during processing. |
Microtomy and Sectioning (4-5 μm)
Consistent sectioning at 4-5 micrometers is crucial for FISH. Thicker sections cause overlapping nuclei and ambiguous signals; thinner sections may yield insufficient target material.
Protocol: FFPE Block Sectioning for FISH
Objective: To obtain consecutive, wrinkle-free, 4-5 μm thick tissue sections.
Materials & Equipment:
- Selected FFPE tissue block
- Rotary microtome
- Ice tray or cooling plate
- High-quality disposable microtome blades
- Fine-tip forceps and artist's brush
- 40-45°C water bath (RNase/DNase-free)
- Positively charged or adhesive glass slides (e.g., SuperFrost Plus)
Methodology:
- Block Cooling: Chill the FFPE block on ice for 10-15 minutes to harden the paraffin.
- Microtome Setup: Install a new, sharp blade in the microtome. Set the section thickness to 4.5 μm.
- Facing: Trim the block surface until the full tissue face is exposed. Discard these coarse sections.
- Sectioning: Cut serial 4.5 μm sections using a smooth, steady motion. Use a brush to gently guide the ribbon as it forms.
- Floatation: Carefully float the ribbon (sections side down) onto the surface of the RNase-free water bath (40-45°C). Allow sections to expand for 30-60 seconds.
- Mounting: Place a labeled positively charged slide vertically into the water, contact the ribbon, and lift it out in one smooth motion, allowing the section to adhere evenly.
- Draining: Drain excess water and air-dry the mounted sections on a slide rack at room temperature for 15-30 minutes before baking.
Table 2: Troubleshooting Microtomy for FISH
| Problem | Possible Cause | Solution |
|---|---|---|
| Shattered Sections | Block too cold, dull blade | Warm block face briefly; replace blade. |
| Compressed Sections | Dull blade, incorrect blade angle | Replace blade; adjust clearance angle. |
| Wrinkles | Water bath too hot/cold, uneven lifting | Calibrate bath temperature; practice even slide retrieval. |
| Sections Not Adhering | Slide type, water contaminants | Use positively charged slides; use fresh RNase-free water. |
Slide Baking
Baking ensures permanent adhesion of the tissue section to the slide, preventing detachment during the rigorous denaturation and washing steps of the FISH protocol.
Protocol: Slide Baking for FFPE FISH
Objective: To irreversibly adhere tissue sections to slides without damaging nucleic acids.
Materials:
- Slide drying oven or hybridizer
- Sectioned, air-dried slides.
Methodology:
- Place the air-dried slides on a slide rack in a pre-warmed oven.
- Bake at 60°C for 60 minutes OR Bake at 70°C for 15-30 minutes.
- After baking, allow slides to cool to room temperature.
- Proceed immediately to FISH protocol (deparaffinization, retrieval) or store baked slides at 2-8°C in a desiccated, slide box for up to 6 weeks.
Critical Note: Excessive heat (>80°C) or prolonged baking can damage nucleic acids and reduce FISH signal intensity. The 60°C/1hr protocol is widely considered the gentler standard for FISH applications.
The Scientist's Toolkit: Key Reagent Solutions
Table 3: Essential Materials for Pre-Analytical Phase in FFPE FISH
| Item | Function in Pre-Analytical Phase |
|---|---|
| Positively Charged Slides | Electrostatic attraction binds negatively charged nucleic acids, preventing tissue loss. |
| RNase/DNase-Free Water | Used in water bath and reagent preparation to prevent degradation of target nucleic acids. |
| High-Quality Microtome Blades | Ensures smooth, consistent 4-5 μm sections without compression or tearing. |
| 10% NBF (Neutral Buffered Formalin) | Standard fixative that cross-links proteins while preserving nucleic acid structure adequately. |
| Slide Drying Oven | Provides uniform, controlled heat for the baking step to ensure tissue adhesion. |
Visualizing the Pre-Analytical Workflow for FFPE FISH
Diagram Title: FFPE Tissue Sectioning & Baking Workflow with QC Checkpoints
The pre-analytical phase of tissue selection, precise 4-5 μm sectioning, and controlled slide baking forms the critical foundation for robust FISH analysis in FFPE tissue research. Standardization of these protocols, guided by clear quantitative criteria and quality control checkpoints, is essential for generating reliable genetic data in translational research and oncology drug development programs.
Formalin-fixed, paraffin-embedded (FFPE) tissue preservation is the cornerstone of histopathological archives, enabling long-term morphological studies. However, for Fluorescence In Situ Hybridization (FISH), the paraffin matrix and formalin-induced crosslinks present formidable barriers to nucleic acid accessibility. A robust, reproducible pre-treatment protocol encompassing deparaffinization, hydration, and antigen retrieval is thus the critical determinant of FISH assay success. This application note details the optimized methodologies for these steps, with a focus on the synergistic roles of heat-induced epitope retrieval (HIER) and controlled protease digestion, framed within the broader thesis of achieving high signal-to-noise ratios in FFPE-FISH.
Quantitative Impact of Pre-Treatment Variables on FISH Signal Quality
The efficacy of pre-treatment is quantifiable through metrics such as Signal Intensity (SI), Background Fluorescence (BF), and Percent of Target-Positive Cells (PPC). The following table summarizes key experimental findings from recent literature.
Table 1: Quantitative Comparison of Pre-Treatment Modalities for FFPE-FISH
| Pre-Treatment Variable | Tested Condition | Key Metric (vs. Control) | Optimal Result Citation |
|---|---|---|---|
| Deparaffinization Agent | Xylene vs. Citrisolv | Signal Clarity, Tissue Integrity | Citrisolv showed equivalent efficiency with lower toxicity. |
| HIER Buffer pH | pH 6.0 (Citrate) vs. pH 9.0 (Tris-EDTA) | SI for DNA Targets | pH 9.0 superior for most DNA FISH targets (↑~40% SI). |
| HIER Heating Method | Steamer vs. Pressure Cooker vs. Water Bath | Reproducibility, SI | Pressure cooker yielded most uniform results across blocks. |
| Protease Type | Pepsin vs. Proteinase K | PPC, Tissue Morphology | Pepsin (0.1-0.4% in 0.1N HCl) offered best balance for most tissues. |
| Protease Time | 2 min vs. 10 min vs. 30 min | BF, Morphology Integrity | 10 min digest optimal; longer times ↑ BF and tissue loss. |
| Combined HIER + Protease | Sequential (HIER→Protease) | PPC, Specificity | Sequential treatment ↑ PPC by 60-80% over either alone. |
Detailed Experimental Protocols
Protocol 1: Standard Deparaffinization and Hydration
Objective: To completely remove paraffin and rehydrate tissue sections without compromising adhesion or morphology. Materials: FFPE sections (4-5 µm) on charged slides, Xylene or Citrisolv alternatives, 100% Ethanol, 95% Ethanol, 70% Ethanol, deionized water. Procedure:
- Baking: Bake slides at 60°C for 1 hour to melt paraffin and enhance adhesion.
- Deparaffinization:
- Immerse slides in fresh Xylene (or alternative) I for 10 minutes.
- Transfer to fresh Xylene (or alternative) II for 10 minutes.
- Hydration:
- Immerse in 100% Ethanol I for 5 minutes.
- Immerse in 100% Ethanol II for 5 minutes.
- Immerse in 95% Ethanol for 3 minutes.
- Immerse in 70% Ethanol for 3 minutes.
- Rinse in deionized water for 2 minutes. Proceed immediately to pre-treatment.
Protocol 2: Heat-Induced Epitope Retrieval (HIER) for DNA Targets
Objective: To reverse formalin crosslinks and expose target nucleic acids using heat and buffer chemistry. Materials: pH 9.0 Tris-EDTA Buffer (10mM Tris Base, 1mM EDTA, 0.05% Tween 20, adjust pH), or pH 6.0 Citrate Buffer, pressure cooker or steamer, coplin jars. Procedure:
- Place hydrated slides in a coplin jar filled with pre-warmed retrieval buffer (≥500 ml).
- For Pressure Cooker: Bring to full pressure (≈15 psi, ~121°C) and maintain for 10-15 minutes. Allow natural pressure release over 10 minutes.
- For Steamer: Place jar in pre-heated steamer (95-100°C) for 30-40 minutes.
- Cool slides in buffer at room temperature for 20 minutes.
- Rinse briefly in deionized water. Proceed to protease digestion or FISH hybridization.
Protocol 3: Optimized Protease Digestion
Objective: To digest crosslinked proteins enveloping nucleic acids, improving probe penetration and accessibility. Materials: Pepsin stock solution (10% w/v in water), 0.1N HCl, PBS, humidity chamber. Procedure:
- Prepare 0.1-0.4% pepsin working solution in 0.1N HCl. Pre-warm to 37°C.
- Apply sufficient volume to cover tissue section (≈100-200 µl).
- Incubate in a humidity chamber at 37°C for 5-20 minutes (10 min is typical starting point).
- Immediately stop digestion by rinsing in PBS for 2 minutes.
- Dehydrate slides through an ethanol series (70%, 95%, 100%) for 2 minutes each and air dry. Slides are now ready for probe application.
The Scientist's Toolkit: Key Research Reagent Solutions
Table 2: Essential Materials for FFPE-FISH Pre-Treatment
| Item | Function & Rationale |
|---|---|
| Charged/Plus Slides | Prevents tissue detachment during rigorous heating and washing steps. |
| Citrisolv or Limonene Alternatives | Less toxic, biodegradable substitutes for xylene in deparaffinization. |
| Tris-EDTA Buffer (pH 9.0) | High-pH retrieval buffer optimal for breaking protein-DNA crosslinks. |
| Pressure Cooker (Lab Grade) | Provides consistent, high-temperature HIER, superior to water baths. |
| Pepsin (from porcine stomach) | Acidic protease; specific activity minimizes nuclear disruption vs. Proteinase K. |
| Humidity Chamber | Prevents evaporation of small-volume protease solutions during incubation. |
| Hybrite or Similar Hybridization System | Provides precise, programmable temperature control for denaturation/hybridization. |
Visualization of Protocols and Pathways
Title: FFPE-FISH Pre-Treatment Workflow
Title: Mechanism of Nucleic Acid Unmasking in FFPE
Within the framework of developing a robust Fluorescence In Situ Hybridization (FISH) protocol for Formalin-Fixed Paraffin-Embedded (FFPE) tissue samples, the steps of denaturation and hybridization are critical determinants of assay success. These steps directly influence the accessibility of target nucleic acids, the specificity of probe binding, and the ultimate signal-to-noise ratio. Optimizing the interdependent variables of temperature, time, and probe concentration is essential for achieving consistent, reliable results in clinical diagnostics and drug development research. This application note provides detailed protocols and data-driven guidance for this optimization process.
The Scientist's Toolkit: Key Research Reagent Solutions
| Item | Function in FFPE FISH |
|---|---|
| Formalin-Fixed Paraffin-Embedded (FFPE) Tissue Sections | The archival sample format for retrospective studies; requires specialized pre-treatment for nucleic acid accessibility. |
| Target-Specific FISH Probe (e.g., locus-specific, break-apart) | A fluorescently labeled nucleic acid sequence designed to bind complementary genomic DNA or RNA target. |
| Hybridization Buffer | A solution containing agents (e.g., dextran sulfate, formamide, salts) to promote specific probe-target annealing while suppressing non-specific binding. |
| Formamide (High-Grade, Molecular Biology) | A denaturing agent included in hybridization buffers to lower the effective melting temperature (Tm) of DNA, allowing for stringent hybridization at manageable temperatures (e.g., 37-45°C). |
| Coverslips and Sealant | Used to apply probe mixture to tissue and prevent evaporation during the high-temperature denaturation and long incubation steps. |
| Hybridization Chamber or Humidity Box | Maintains a humidified environment during incubation to prevent sample drying, which is catastrophic for hybridization. |
| Stringency Wash Buffers (e.g., SSC solutions) | Saline-sodium citrate buffers used post-hybridization to remove excess and non-specifically bound probe; concentration and temperature are key for stringency. |
| DAPI (4',6-diamidino-2-phenylindole) Counterstain | A fluorescent stain that binds to DNA, labeling all cell nuclei to provide tissue morphology context for probe signal localization. |
| Antifade Mounting Medium | Preserves fluorescence during microscopy and storage by reducing photobleaching. |
Optimized Denaturation & Hybridization Protocol for FFPE FISH
Protocol 1: Co-Denaturation Method (Standard)
This method simultaneously denatures target DNA and probe on the slide.
- Slide Preparation: Apply 10 µL of probe mixture (in hybridization buffer) to the target area of the pre-treated FFPE tissue section. Carefully lower a glass coverslip, avoiding air bubbles. Seal edges with rubber cement.
- Co-Denaturation: Place slides on a pre-warmed (or programmable) hybridizer or thermal cycler with a flat block.
- Temperature: 82°C (± 1°C).
- Time: 10 minutes.
- Function: Simultaneously melts the double-stranded target DNA in the tissue and the probe DNA.
- Hybridization: Immediately following denaturation, reduce the instrument temperature.
- Temperature: 37°C (for typical DNA probes) or the calculated optimal temperature.
- Time: 12-18 hours (overnight).
- Function: Allows the probe to anneal specifically to its complementary target sequence.
- Post-Hybridization Washes: Remove coverslip and perform stringency washes (e.g., in 0.4X SSC at 72°C for 2 minutes, followed by 2X SSC at room temperature).
Protocol 2: Separate Denaturation Method (For Delicate Targets)
This method denatures the tissue target DNA first, before adding probe, to minimize potential damage from extended high heat in the presence of formamide.
- Slide Denaturation: Apply only hybridization buffer (without probe) and a coverslip to the pre-treated FFPE section. Seal.
- Target Denaturation: Place slides on the hybridizer.
- Temperature: 82°C.
- Time: 10 minutes.
- Function: Denatures tissue target DNA.
- Probe Application: Rapidly remove the coverslip, apply the probe mixture in fresh buffer, and re-apply a new coverslip.
- Hybridization: Proceed immediately to the hybridization step as described in Protocol 1 (37°C, 12-18 hours).
Optimization Data & Guidelines
The following parameters are interdependent. Optimization should be performed using control FFPE samples with known positive and negative status.
Table 1: Optimization of Denaturation Parameters for FFPE Tissue
| Parameter | Typical Starting Range | Optimal Value (Guideline) | Effect of Increase | Key Consideration for FFPE |
|---|---|---|---|---|
| Temperature | 75 - 85°C | 82°C | Higher signal but increased tissue damage/ morphology loss. | Over-denaturation can degrade tissue architecture. Under-denaturation reduces probe access. |
| Time | 5 - 15 minutes | 10 minutes | Similar to temperature increase; plateau after full denaturation. | Must be balanced with pre-treatment (pepsin) time. Older or over-fixed samples may require adjustment. |
Table 2: Optimization of Hybridization Parameters
| Parameter | Typical Range | Optimal Value (Guideline) | Effect of Increase | Key Consideration for FFPE |
|---|---|---|---|---|
| Temperature | 37 - 45°C | Probe-specific; often 37°C or 42°C. | Increases stringency (less mismatch tolerance). Reduces signal if too high. | Calculated based on probe Tm, formamide concentration. Must preserve tissue integrity. |
| Time | 4 - 24 hours | 12-16 hours (Overnight). | Increases signal intensity until equilibrium. Increases risk of drying/artifact. | Longer times may increase non-specific background in sub-optimally pre-treated tissue. |
| Probe Concentration | 1 - 20 ng/µL | 5-10 ng/µL (validated per probe lot). | Increases signal, but also background noise and cost. | FFPE samples have variable target accessibility; a moderate concentration is often optimal. |
Table 3: Troubleshooting Common Issues
| Problem | Potential Cause Related to Denaturation/Hybridization | Suggested Adjustment |
|---|---|---|
| Weak or No Signal | Denaturation temp/time too low. Hybridization temp too high. Probe concentration too low. | Increase denaturation time by 2 min increments. Lower hybridization temp by 2-5°C. Validate and increase probe concentration. |
| High Background / Non-Specific Binding | Denaturation temp/time too high (exposed nonspecific sequences). Hybridization temp too low. Probe concentration too high. Inadequate stringency washes. | Slightly reduce denaturation time. Increase hybridization temp by 2-5°C. Decrease probe concentration. Increase wash temperature or decrease SSC concentration. |
| Poor Tissue Morphology | Excessive denaturation temperature or time. | Reduce denaturation temperature to 80°C or time to 8 minutes. |
Visualizing the Optimization Workflow and Effects
Diagram 1: Variable Impact on FISH Steps
Diagram 2: Denaturation Parameter Effects
Within the broader thesis on optimizing Fluorescence In Situ Hybridization (FISH) protocols for formalin-fixed paraffin-embedded (FFPE) tissue samples, the post-hybridization wash step is a critical determinant of assay success. This phase is not merely a cleaning procedure but a precise exercise in stringency control. In FFPE tissues, factors like cross-linking, non-specific probe binding, and autofluorescence elevate background noise, which can obscure specific signals, particularly in low-copy-number or heterogeneous samples. Effective post-hybridization washes selectively destabilize mismatched or weakly bound probe-target hybrids while preserving perfect matches. This document provides detailed application notes and protocols to standardize this crucial step, ensuring high signal-to-noise ratios essential for accurate analysis in research and drug development.
Principles of Stringency in Post-Hybridization Washes
Stringency is controlled primarily by the temperature, ionic strength (salt concentration), and chemical denaturant concentration of the wash buffers. The objective is to disrupt hydrogen bonds in imperfect duplexes.
- Temperature: Increased temperature destabilizes all hybrids; the melting temperature (Tm) of a perfect match is higher than that of a mismatch.
- Salt Concentration (Sodium Chloride, NaCl): Lower salt concentrations reduce ionic shielding, increasing electrostatic repulsion between the negatively charged phosphate backbones of the probe and target, destabilizing hybrids.
- Denaturants (Formamide): Formamide disrupts hydrogen bonding, effectively lowering the Tm of the duplex, allowing stringent washes to be performed at lower, tissue-preserving temperatures (e.g., 45-75°C instead of >90°C).
For FFPE tissues, a balance must be struck between achieving high stringency and preserving tissue morphology and antigenicity (in multiplex assays).
Key Quantitative Data for Wash Stringency
The following table summarizes standard and optimized wash conditions for common FISH applications in FFPE tissues, based on current literature and product manuals.
Table 1: Standard and High-Stringency Post-Hybridization Wash Buffers
| Buffer Component | Standard Stringency Wash (e.g., for abundant targets) | High Stringency Wash (e.g., for single-copy genes, microdeletions) | Function & Rationale |
|---|---|---|---|
| Saline-Sodium Citrate (SSC) Concentration | 2x SSC | 0.1x - 0.5x SSC | Lower concentration increases stringency by reducing cation concentration, weakening duplex stability. |
| Formamide Concentration | 10-30% (v/v) | 40-60% (v/v) | Denaturant; lowers Tm, allowing high stringency at moderate temperatures to protect FFPE tissue. |
| Sodium Dodecyl Sulfate (SDS) | 0.1-0.3% (w/v) | 0.1-0.3% (w/v) | Ionic detergent; reduces non-specific hydrophobic interactions and background. |
| Typical Wash Temperature | 45°C - 60°C | 60°C - 75°C | Higher temperature increases kinetic energy, disrupting imperfect bonds. Must be below tissue degradation point. |
| Wash Duration (per wash) | 5 - 10 minutes | 5 - 10 minutes | Must be sufficient for buffer exchange within tissue. Longer times may increase stringency but risk tissue loss. |
| Number of Washes | 2 - 3 | 2 - 3 | Ensures complete removal of unbound and loosely bound probe. |
Table 2: Impact of Wash Stringency on Signal-to-Noise Ratio in FFPE FISH
| Study / Probe Type | Low Stringency Wash (2x SSC, 45°C) | High Stringency Wash (0.5x SSC, 72°C) | Observed Outcome (Signal:Noise Ratio) |
|---|---|---|---|
| HER2/CEP17 Dual Probe (Breast CA) | Strong specific signal, high background fluorescence. | Strong specific signal, minimal background. | SNR improved by 3-5 fold, enabling clearer interpretation of gene amplification. |
| ALK Breakapart Probe (Lung CA) | Frequent false-positive split signals due to nonspecific binding. | Clear, specific fusion or breakapart patterns. | False-positive rate reduced from ~15% to <2%. |
| Single-copy mRNA Target | Often undetectable due to high background. | Discrete, punctate signals visible above low background. | Critical for detection; moves target from "undetectable" to "quantifiable." |
Detailed Experimental Protocols
Protocol A: Standard Post-Hybridization Wash for FFPE FISH
Objective: To remove unhybridized probe while retaining specific signal for robust targets (e.g., centromeric repeats, highly amplified genes).
Materials: See "The Scientist's Toolkit" section. Procedure:
- Pre-warm Wash Buffers: Preheat a water bath or dry bath to 45°C ± 2°C. Pre-warm Coplin jars containing ~50 ml of 2x SSC (with 0.1% SDS if desired) per jar.
- Initial Removal of Coverslip: Gently remove the coverslip by immersing the slide in the first jar of pre-warmed 2x SSC. Allow the coverslip to slide off. Do not force it.
- Stringency Washes: a. Transfer the slide to a fresh jar of pre-warmed 2x SSC. b. Incubate for 5 minutes at 45°C with gentle agitation. c. Repeat step (a-b) for a total of 2 washes.
- Optional Counterstain Wash: Transfer slide to a jar of room temperature 2x SSC for 2 minutes to cool.
- Proceed to DAPI staining and mounting.
Protocol B: High-Stringency Wash for Low-Copy or Repetitive Sequence Probes
Objective: To maximize discrimination of specific from non-specific binding for challenging targets.
Materials: See "The Scientist's Toolkit" section. Procedure:
- Pre-warm Wash Buffers: Preheat a water bath or dry bath to 72°C ± 1°C. Pre-warm Coplin jars with ~50 ml of 0.5x SSC per jar. For very high stringency, use a formamide-based wash (e.g., 50% formamide / 2x SSC) pre-warmed to 45°C.
- Initial Stringency Wash: a. Remove coverslip as in Protocol A, Step 2, using the pre-warmed stringent buffer. b. Immediately transfer slide to a second jar of the same pre-warmed stringent buffer. c. Incubate for 5-10 minutes at the specified temperature (72°C for low-salt; 45°C for formamide). Caution: Monitor tissue adherence closely.
- Secondary Wash: Transfer slide to a fresh jar of pre-warmed 2x SSC and incubate for 2-3 minutes at 45°C to remove residual stringent buffer.
- Cooling Wash: Transfer slide to room temperature 2x SSC for 2 minutes.
- Proceed to DAPI staining and mounting.
Visualization of Workflows and Relationships
Diagram 1: Post-Hybridization Wash Decision Workflow
Diagram 2: How Stringency Factors Affect Hybrid Stability
The Scientist's Toolkit
Table 3: Essential Research Reagent Solutions for Post-Hybridization Washes
| Item | Function & Rationale | Example/Concentration |
|---|---|---|
| 20x SSC Stock Solution | Provides the sodium chloride and sodium citrate for wash buffers. The ionic strength of its dilution (2x, 0.5x) is a primary stringency controller. | 3.0 M NaCl, 0.3 M Na₃C₆H₅O₇, pH 7.0 |
| Formamide (Molecular Biology Grade) | Chemical denaturant. Incorporated into wash buffers to lower the effective Tm, enabling stringent washes at lower temperatures to preserve FFPE tissue integrity. | 99.5% purity, deionized. Used at 10-60% (v/v) in 2x SSC. |
| Sodium Dodecyl Sulfate (SDS) | Ionic detergent. Added to wash buffers (typically 0.1-0.3%) to reduce non-specific hydrophobic binding of probes to tissue or glass, lowering background. | 10% (w/v) stock solution. |
| Stringency Wash Buffer (Low Salt) | The high-stringency working solution. Low salt concentration (0.1x-0.5x SSC) is critical for destabilizing mismatched hybrids. | 0.5x SSC, 0.1% SDS. |
| Stringency Wash Buffer (Formamide) | An alternative high-stringency working solution. Allows stringent washing at more moderate temperatures. | 50% Formamide, 2x SSC, 0.1% SDS. |
| Temperature-Controlled Water Bath or Dry Bath | Provides precise and consistent temperature control during washes. ±1°C accuracy is critical for reproducibility of stringency. | Calibrated bath with digital control. |
| Coplin Jars or Staining Dishes | Glass or plastic containers for immersing slides during washes. Sufficient volume (≥50 ml) ensures proper buffer exchange. | Glass Coplin jars (5-10 slide capacity). |
| DAPI Counterstain Solution | Nuclear stain applied after final wash. Allows visualization of tissue architecture and acts as a mounting medium with antifade. | DAPI at 0.5-1.0 µg/mL in antifade mounting medium. |
| Antifade Mounting Medium | Preserves fluorescence by reducing photobleaching. Essential for signal stability during microscopy and analysis. | Commercially available solutions with p-phenylenediamine or similar compounds. |
Counterstaining with DAPI and Mounting for Fluorescence Preservation
Within the broader thesis on optimizing Fluorescence In Situ Hybridization (FISH) protocols for Formalin-Fixed Paraffin-Embedded (FFPE) tissue samples, the final steps of counterstaining and mounting are critical for data integrity. Successful FISH analysis depends not only on specific probe hybridization but also on high-quality nuclear visualization and long-term fluorescence signal preservation. This application note details a standardized protocol for DAPI counterstaining and mounting of FFPE tissue sections post-FISH, designed to maximize contrast, resolution, and archival stability of fluorescence signals for research and drug development applications.
Research Reagent Solutions: Essential Materials
The following table lists key reagents and their functions for optimal counterstaining and mounting.
Table 1: Essential Reagents and Materials for DAPI Counterstaining and Mounting
| Item | Function & Rationale |
|---|---|
| DAPI (4',6-diamidino-2-phenylindole) | A blue-fluorescent, AT-selective DNA stain that provides a high-contrast nuclear counterstain. It allows for the delineation of tissue architecture and localization of FISH signals within nuclei. |
| Antifade Mounting Medium | Aqueous or glycerol-based medium containing compounds (e.g., p-phenylenediamine, DABCO) that retard photobleaching (fading) of fluorophores by scavenging free radicals generated during fluorescence excitation. |
| Prolong Diamond / Gold or Similar | Advanced polyvinyl alcohol-based or polymer-based mounting media that harden to form a permanent seal. They often contain antifade agents and provide superior signal preservation over months to years. |
| Glass Coverslips (#1.5 thickness) | Optimal for high-resolution microscopy. #1.5 thickness (0.17 mm) is ideal for oil-immersion objectives corrected for this cover glass thickness. |
| Nail Polish or Sealant | Used to seal the edges of coverslips when using non-hardening media, preventing evaporation and movement. |
| DAPI Stock Solution (e.g., 5 mg/mL in water) | Concentrated stock for preparing accurate working dilutions. |
| Dilution Buffer (e.g., PBS or Tris-EDTA) | Used to dilute DAPI stock to the optimal working concentration for FFPE tissues. |
| Non-Absorbent Paper/Blotter | For careful removal of excess mounting medium before sealing. |
Detailed Protocol: DAPI Counterstaining and Mounting for FFPE Tissue Post-FISH
Note: This protocol assumes FISH probe hybridization and post-hybridization washes on FFPE tissue sections are complete.
Materials Required
- DAPI stock solution (e.g., 5 mg/mL in deionized water)
- 1x Phosphate Buffered Saline (PBS), pH 7.4
- Antifade mounting medium (e.g., ProLong Diamond, Vectashield, or similar)
- Glass coverslips (#1.5, 24 x 50 mm or 22 x 22 mm)
- Forceps
- Pipettes and tips
- Light-blocking container (e.g., slide mailer)
- Nail polish (if required)
- Microscope slides with processed FFPE tissue sections
Step-by-Step Procedure
DAPI Solution Preparation:
- Prepare a DAPI working solution in 1x PBS. A typical final concentration for FFPE tissues is 150-300 nM.
- Example: For a 200 nM solution from a 5 mg/mL (≈14 mM) stock: Dilute 1.43 µL of stock in 100 mL of 1x PBS. Mix thoroughly. Protect from light. Solution can be aliquoted and stored at 4°C for several weeks.
Counterstaining:
- Following the final post-FISH wash, briefly drain excess wash buffer from the slide.
- Apply 100-200 µL of the DAPI working solution directly onto the tissue section, ensuring complete coverage.
- Incubate at room temperature for 5-10 minutes in a light-blocking container (e.g., a slide mailer wrapped in aluminum foil).
Brief Rinse:
- Tilt the slide to drain the DAPI solution.
- Gently rinse the slide by immersing it or flowing 1-2 mL of 1x PBS over the section for approximately 10-15 seconds to remove excess, unbound DAPI. This reduces background fluorescence.
Excess Buffer Removal:
- Carefully blot the edges and the back of the slide with a laboratory wipe.
- Do not let the tissue section dry out completely. The section should remain slightly damp.
Mounting with Antifade Medium:
- Apply 20-40 µL of antifade mounting medium onto the tissue section.
- Gently lower a clean #1.5 coverslip at an angle to avoid introducing air bubbles. Slowly lower it to cover the section completely.
- If bubbles are trapped, gently press on the coverslip with forceps to push them to the edge.
Curing and Sealing:
- For non-hardening media (e.g., glycerol-based): Seal the edges of the coverslip immediately with clear nail polish. Allow to dry completely. Store slides flat at 4°C in the dark.
- For hardening polymer media (e.g., ProLong series): Allow slides to cure flat in the dark at room temperature for 24-48 hours before microscopy. No nail polish is required. Store cured slides at room temperature or 4°C in the dark.
Critical Protocol Notes
- Optimal DAPI Concentration: Too high a concentration can cause excessive background and obscure dim FISH signals. The recommended range (150-300 nM) provides a strong nuclear signal with low cytoplasmic staining for FFPE tissues.
- Antifade Selection: For multi-color FISH involving far-red dyes (e.g., Cy5), use an antifade medium specifically formulated to preserve these signals, as some compounds (e.g., p-phenylenediamine) can quench Cy5.
- Imaging Timing: For quantitative analysis, image slides as soon as possible after mounting. Although antifade media preserve signals, some initial fading can occur.
The performance of various mounting media has been quantitatively assessed in recent literature. Key metrics include signal intensity preservation over time and reduction in photobleaching rate.
Table 2: Comparison of Antifade Mounting Media Performance for FISH Signal Preservation
| Mounting Medium | Type | Key Component(s) | Signal Half-Life (Cy3, approx.)* | Hardens? | Recommended For |
|---|---|---|---|---|---|
| Glycerol/PBS + p-phenylenediamine | Aqueous | p-phenylenediamine | ~6-12 hours | No | General use; avoid with Cy5 |
| Vectashield | Aqueous/Glycerol | Proprietary | ~24-48 hours | No | General multi-color FISH |
| Prolong Diamond | Polymer | Proprietary antifade | >2 weeks | Yes, permanent | Long-term archival, super-resolution |
| Prolong Gold | Polymer | Proprietary antifade | >1 week | Yes, permanent | Long-term archival, standard confocal |
| Mowiol/DABCO | Aqueous/Polymer | DABCO | ~48-72 hours | Yes, semi-permanent | Cost-effective long-term storage |
*Signal half-life is an approximation under continuous or frequent illumination and varies by fluorophore and microscope settings. Data synthesized from current vendor specifications and recent peer-reviewed evaluations.
Experimental Workflow and Logical Relationships
The following diagrams illustrate the post-FISH workflow and the mechanism of action for antifade mounting media.
Post-FISH Counterstaining and Mounting Workflow
Mechanism of Antifade Mounting Media Action
Within a thesis investigating FISH protocols for FFPE tissue samples, selecting the optimal image acquisition platform is critical. This note compares traditional fluorescence microscopy and automated slide scanning systems, providing protocols and data to guide researchers and drug development professionals in high-throughput biomarker analysis and spatial biology studies.
Core Technologies: Comparison & Data
Table 1: Quantitative Comparison of Acquisition Systems
| Parameter | Fluorescence Microscopy (Epi-fluorescence) | Automated Slide Scanner (High-Throughput) |
|---|---|---|
| Max Sample Area | ~1-3 slides per session (manual) | 20-400+ slides (unattended) |
| Typical Resolution | 0.2 - 0.3 µm/pixel (60x-100x oil) | 0.18 - 0.5 µm/pixel (20x-40x) |
| Multiplexing Capacity | 4-6 fluorophores (standard filter cubes) | 5-8+ fluorophores (spectral unmixing) |
| Acquisition Speed | 5-15 mins per FOV (manual navigation) | 2-10 mins per whole slide (20x) |
| Data per Whole Slide | 1-10 GB (selected regions) | 20-80 GB (compressed) |
| Focus Method | Manual or software-based Z-stack | Automated laser-based or software autofocus |
| System Cost Range | $$ - $$$ | $$$$ - $$$$$ |
Table 2: Suitability for FFPE-FISH Applications
| Application Need | Recommended Platform | Rationale |
|---|---|---|
| High-Throughput Biomarker Scoring | Automated Scanner | Unattended operation, batch consistency |
| High-Resolution Subcellular Localization | Fluorescence Microscopy | Superior Z-sectioning, oil immersion optics |
| Multiplex FISH (>6 targets) | Automated Scanner (Spectral) | Advanced unmixing reduces channel crosstalk |
| Rapid Prototyping / Pilot Studies | Fluorescence Microscopy | Lower barrier to entry, flexible targeting |
| Spatial Transcriptomics / Phenotyping | Automated Scanner | Whole-slide context, tissue cytometry analysis |
| Archival & Digital Pathology | Automated Scanner | Whole-slide images for AI/ML, database integration |
Experimental Protocols
Protocol 1: Multiplex FISH Image Acquisition on an Automated Slide Scanner
Objective: Acquire whole-slide images from a 5-color FFPE-FISH experiment for quantitative analysis of gene amplifications and translocations.
- Slide Preparation: Perform standard FFPE-FISH protocol. Apply 90 µL of DAPI-containing antifade mounting medium and a #1.5 coverslip. Seal edges with clear nail polish. Allow to cure for 1 hour in the dark.
- Scanner Setup:
- Power on scanner and computer. Launch acquisition software.
- Load up to 40 slides into the robotic tray. Ensure barcodes are recognized.
- Create a new batch experiment. Select the 20x/0.75NA dry objective for optimal speed and resolution balance.
- Define Acquisition Parameters:
- Scan Area: Select "Whole Slide" with a 5% margin exclusion.
- Focus Map: Set software to collect a 9-point focus map per slide (corners, edges, center).
- Z-Stacking: Define a 7-layer Z-stack with a 0.8 µm step size to accommodate tissue unevenness.
- Channels: Input fluorophore spectra (DAPI, FITC, Cy3, Texas Red, Cy5). For spectral scanners: Capture the full emission lambda stack for later linear unmixing.
- Exposure Times: Set using "Auto-Expose" on a control slide region, then reduce by 15% to prevent saturation. Typical range: 20-150 ms per channel.
- Batch Run & Quality Control:
- Initiate unattended batch scan. Monitor progress remotely.
- Post-scan, use software to stitch image tiles and apply flat-field correction.
- For spectral data: Execute linear unmixing algorithm using pre-defined single-stain reference slides to eliminate autofluorescence and crosstalk.
- Output: Images saved as .svs or .czi pyramidal files for analysis in dedicated FISH or digital pathology software.
Protocol 2: High-Resolution Z-Series Acquisition on a Widefield Fluorescence Microscope
Objective: Capture high-magnification, multi-Z-layer images of rare FISH signals within a specific tissue microenvironment.
- Microscope Setup:
- Turn on microscope, mercury or LED lamp, and camera. Allow lamp to warm up for 15 minutes.
- Place FISH slide on the stage. Use a 63x or 100x oil immersion objective (NA ≥1.4).
- Apply a drop of immersion oil of the correct refractive index.
- Region of Interest (ROI) Identification:
- Using a low-magnification objective (e.g., 10x) and the DAPI channel, manually navigate to the annotated ROI.
- Switch to the high-magnification oil objective, carefully refocusing.
- Configure Acquisition Software:
- Open multidimensional acquisition module.
- Channels: Sequentially add DAPI, FITC, Cy3, Texas Red. Set appropriate filter cubes and exposure times (100-500 ms typical).
- Z-Stack: Click "Define Z Series." Set the top and bottom focal limits by focusing above and below the tissue section. Set a step size of 0.2 µm (Nyquist criterion for calculated Z-resolution).
- Deconvulation Setup (Optional): Check "Capture PSF" or "Theoretical PSF" for later deconvolution processing.
- Acquisition & Post-Processing:
- Click "Acquire" to capture the Z-stack for all channels.
- Save as a .nd2 or .lif file.
- Post-Processing: Apply 3D deconvolution (e.g., Constrained Iterative algorithm) using the microscope's theoretical or measured PSF to sharpen signals and reduce out-of-focus light.
- Output: A high-resolution, optically optimized 3D image stack for detailed signal analysis within cell nuclei.
Visualization of Workflows
Title: Decision Workflow for FISH Image Acquisition Platform Selection
Title: FISH Protocol Timeline from Sample to Data Analysis
The Scientist's Toolkit: Research Reagent Solutions
Table 3: Essential Materials for FFPE-FISH Image Acquisition
| Item | Function & Relevance to Acquisition |
|---|---|
| High-Performance Antifade Mountant (e.g., ProLong Diamond, VECTASHIELD) | Preserves fluorophore intensity during prolonged scanner exposure or microscope Z-stack capture. Reduces photobleaching. |
| #1.5 Precision Coverslips (0.17 mm thickness) | Critical for optimal performance of high-NA oil immersion objectives (60x, 100x) on microscopes. Ensures correct working distance and spherical aberration correction. |
| Immersion Oil (Type NV or DF, n=1.518) | Matches the refractive index of glass and objective lens for high-resolution microscopy. Must be non-drying and non-hardenening. |
| Multiplex FISH Probe Kit (e.g., 5-color) | Pre-validated, spectrally distinct probes (e.g., DAPI, FITC, Cy3, Texas Red, Cy5) enable simultaneous multi-target imaging and reduce need for sequential rounds. |
| Positive Control FFPE Slide (e.g., cell line pellet with known amplification) | Essential for setting baseline exposure times and validating scanner/microscope performance before running experimental batches. |
| Single-Stain Reference Slides (for spectral scanning) | Slides stained with only one fluorophore each are mandatory for creating the spectral library required for linear unmixing software. |
| Slide Barcode Labels & Printer | Enables reliable sample tracking and automated linking of scan data to sample metadata in high-throughput scanner workflows. |
| Flat-Field Reference Slide (fluorescent plastic slide) | Used to correct for uneven illumination across the microscope field of view or scanner imaging path, ensuring quantitative intensity accuracy. |
The accurate scoring and interpretation of Fluorescence In Situ Hybridization (FISH) signals in Formalin-Fixed Paraffin-Embedded (FFPE) tissue samples is a critical endpoint in translational research and drug development. This protocol details standardized enumeration guidelines, signal pattern classification, and reporting criteria to ensure reproducible and clinically actionable data within the broader thesis of optimizing FISH for heterogeneous FFPE samples.
Enumeration Guidelines & Scoring Criteria
Cell Selection and Eligibility
- Target Area: Score within the pre-defined tumor area, avoiding necrosis, edges, and folds.
- Cell Eligibility: Nuclei must be intact, non-overlapping, and exhibit clear, bright hybridization signals with low background.
- Minimum Count: A minimum of 50-100 eligible tumor cells per case is required for statistical relevance. For heterogeneous samples, increase count to 100-200 cells.
- Systematic Sampling: Employ a systematic random sampling pattern (e.g., moving the microscope field in a "meander" pattern) to avoid scorer bias.
Quantitative Signal Enumeration Tables
Table 1: Core Enumeration Guidelines for Common FISH Probes
| Probe Type (Example) | Normal Pattern | Abnormal Pattern & Scoring Criteria | Clinical/Research Significance |
|---|---|---|---|
| Dual-Color, Single-Fusion (e.g., BCR/ABL1) | 2O2G* | Fusion (F): 1O1G1F. >10% fusion-positive cells often threshold for positivity. | Detection of specific translocations. |
| Dual-Color, Break-Apart (e.g., ALK, ROS1) | 2F (fused signals) | Break-Apart (BP): 1O1G (split signals >2 signal diameters apart). Report % of cells with break-apart. | Indicates gene rearrangement. |
| Aneuploidy/CEN (e.g., Chromosome 17 CEP) | 2 signals per nucleus | Gain: ≥3 signals in >XX% of cells. Loss: 0 or 1 signal in >YY% of cells. | Ploidy assessment, used as control. |
| HER2/neu (Dual-Color, CEP17 control) | HER2=2, CEP17=2 | Ratio HER2/CEP17: ≥2.0 OR HER2 copy number: ≥6.0 signals/cell (ASCO/CAP guidelines). | Targeted therapy eligibility in breast/GC. |
*O = Orange, G = Green, F = Fusion (Yellow) signal.
Table 2: Signal Pattern Classification & Interpretation
| Pattern Name | Description | Potential Biological Interpretation |
|---|---|---|
| Classic Fusion/Split | Clear, discrete signals meeting distance/colocalization criteria. | Clonal genetic alteration. |
| Signal Clustering | Tight aggregation of multiple signals, making precise counting difficult. | High-level amplification or technical artifact. |
| Nuclear Truncation | Partial nucleus, missing signals due to tissue sectioning. | Exclude from count. Sectioning artifact. |
| Polysomy | Increased copy number of both target and control probes. | Whole chromosome gain, not specific amplification. |
| Technical Failure | High background, diffuse signals, or no signals in positive control cells. | Repeat assay; probe/ hybridization issue. |
Experimental Protocol: Detailed FISH Scoring Workflow for FFPE Sections
Materials & Pre-Scoring Setup
- Hybridized FFPE Tissue Section on charged slide.
- Fluorescence Microscope equipped with appropriate filters (DAPI, SpectrumOrange, SpectrumGreen, etc.), 100x oil immersion objective, and a sensitive CCD camera.
- FISH Scoring Software (e.g., MetaSystems, BioView) or manual counter.
- Immersion Oil.
Step-by-Step Scoring Methodology
- Localization: Using the DAPI filter and a low-power objective (e.g., 10x), locate the tumor region previously marked by a pathologist.
- Systematic Navigation: Switch to the 100x oil immersion objective. Begin at one corner of the tumor area and establish a systematic pattern to field movement.
- Signal Enumeration: For each eligible nucleus:
- Switch sequentially between the relevant single-bandpass filters (e.g., FITC for Green, Texas Red for Orange) and the dual-bandpass filter.
- Identify and count the discrete signals for each probe color within the nuclear boundary.
- Classify the signal pattern (e.g., normal, split, fused, gain).
- Data Recording: Enter the pattern for each cell directly into a spreadsheet or dedicated software. Continue until the pre-determined minimum cell count is met.
- Calculation: Calculate percentages for each pattern observed. For ratio-based assays (e.g., HER2), calculate the average ratio across counted cells.
Signal Pattern Diagrams
Short Title: FISH Signal Pattern Decision Tree
Short Title: FISH Scoring Experimental Workflow
The Scientist's Toolkit: Essential Research Reagent Solutions
Table 3: Key Reagents & Materials for FFPE-FISH Scoring
| Item | Function & Importance in Scoring |
|---|---|
| Target-Specific FISH Probe Kits | Validated, commercially available probes ensure specificity and signal intensity for accurate enumeration. |
| High-Quality Immersion Oil | Provides correct refractive index for 100x objective; prevents image distortion and signal haze. |
| Antifade Mounting Medium with DAPI | Preserves fluorescence, reduces photobleaching during scoring. DAPI counterstain defines nuclear boundaries. |
| Positive & Negative Control Slides | Essential for validating scoring thresholds and ensuring daily technical performance of the assay. |
| Fluorophore-Specific Microscope Filters | Single and dual-bandpass filters isolate probe signals, preventing bleed-through and enabling accurate colocalization assessment. |
| Digital FISH Capture & Analysis Software | Enables image archiving, automated signal counting, and objective, reproducible analysis for high-volume studies. |
Reporting Standards
A comprehensive FISH report for research must include:
- Sample & Probe Information: Case ID, probe name(s), locus/loci tested.
- Scoring Methodology: Enumeration guidelines used, minimum cell count, scoring system (e.g., FDA/ASCO/CAP or internal research criteria).
- Raw Data: Total number of nuclei scored, counts and percentages for each signal pattern observed.
- Result: Clear statement of positive/negative or quantitative result (e.g., "HER2/CEP17 ratio = 2.4", "60% of cells showed ALK rearrangement").
- Interpretation & Notes: Brief biological/clinical context, mention of technical artifacts (e.g., truncation, polysomy), and any limitations.
Solving FISH Challenges: Troubleshooting Weak Signal, Autofluorescence, and Artifacts
Within the broader thesis on optimizing fluorescence in situ hybridization (FISH) for formalin-fixed paraffin-embedded (FFPE) tissue samples, achieving a high signal-to-noise ratio is paramount. Poor or absent specific signal is a common hurdle, often attributable to three core technical failures: degradation of the labeled nucleic acid probe, inadequate denaturation of target DNA and probe, or insufficient tissue permeabilization that blocks probe access. This application note provides a systematic diagnostic workflow, quantitative benchmarks, and detailed protocols to identify and rectify these issues, ensuring reliable data for research and drug development.
Diagnostic Workflow & Quantitative Benchmarks
The following tables summarize key quantitative indicators and controls for diagnosing the root cause of poor FISH signal.
Table 1: Symptom-Based Diagnosis Guide
| Primary Symptom | Supporting Observations | Most Likely Cause |
|---|---|---|
| Very weak or absent specific signal | High autofluorescence; Positive control probe also fails | Probe Degradation |
| Weak specific signal; High background | Poor nuclear morphology (swollen, distorted); DAPI stain appears diffuse | Inadequate Denaturation |
| Patchy or uneven signal; High background | Strong signal only at tissue edges; Positive control works in some areas but not others | Insufficient Permeabilization |
| Punctate, bright background specks | Signal appears in cytoplasm or extracellular spaces non-specifically | Inadequate Denaturation or Excessive Probe Concentration |
Table 2: Critical Experimental Controls & Expected Results
| Control Type | Purpose | Protocol | Expected Result (Signal) | Interpretation of Failure |
|---|---|---|---|---|
| Positive Control Probe | Verify entire FISH protocol. Use a ubiquitously present target (e.g., centromere probe). | Apply to a known positive tissue sample alongside experimental probe. | Strong, clear nuclear signals. | Points to global protocol failure (Probe, Denaturation, or Permeabilization). |
| No-Probe Control | Assess level of autofluorescence and non-specific binding of detection reagents. | Perform full protocol omitting the probe. | Minimal to no fluorescence in all channels. | High signal indicates inadequate post-hybridization washes. |
| DNase Pretreatment Control | Confirm signal specificity for DNA target. | Treat sample with DNase I prior to denaturation and hybridization. | Significant signal reduction (>90%). | Persistent signal indicates non-specific probe binding. |
| Viability Check (DAPI) | Assess nuclear DNA integrity and denaturation. | Include DAPI counterstain in mounting medium. | Bright, compact nuclear staining. | Diffuse or weak DAPI indicates over-denaturation or sample degradation. |
Detailed Experimental Protocols
Protocol 1: Validating Probe Integrity (qPCR-Based Assay)
This protocol quantitatively assesses whether fluorescent label conjugation or probe integrity has degraded.
- Materials: Suspect FISH probe, reference (fresh) aliquot of same probe, qPCR master mix, primers specific to the probe's backbone sequence (e.g., for plasmid-derived probes) or label-specific assay, qPCR instrument.
- Method: a. Dilute both suspect and reference probes 1:1000 in nuclease-free water. b. Set up qPCR reactions in triplicate: Use 2 µL of diluted probe as template in a 20 µL reaction with SYBR Green master mix and primers. c. Run qPCR with standard cycling conditions. d. Compare the Cq (quantification cycle) values. A ΔCq (suspect - reference) > 3.0 indicates significant degradation of the probe's nucleic acid component.
Protocol 2: Optimizing Denaturation Conditions
This protocol systematically tests denaturation temperature and time.
- Materials: FFPE sections on slides, hybridizer or precise hot block, positive control probe (e.g., CEP17), thermocycler with slide capability (optional).
- Method: a. Deparaffinize and pretreat (pepsin) slides as standard. Divide into treatment groups. b. Denaturation: Use a hybridizer containing 70% formamide/2xSSC, pH 7.0. Test conditions: * Group A: 73°C for 5 min. * Group B: 80°C for 5 min. * Group C: 85°C for 5 min. * Group D: 80°C for 10 min. c. Immediately dehydrate slides in cold ethanol series (70%, 85%, 100%) and air dry. d. Apply positive control probe, hybridize (37°C, 16h), wash, counterstain with DAPI, and mount. e. Quantification: Score 100 nuclei per condition for signal intensity (0-3 scale) and clarity. Optimal condition yields maximum intensity with preserved nuclear morphology (per DAPI).
Protocol 3: Titrating Permeabilization (Proteolytic Digestion)
This protocol determines the optimal digestion time for a specific tissue type and fixation.
- Materials: FFPE sections, pepsin stock solution (e.g., 10% in 0.2N HCl), 37°C incubator.
- Method: a. Deparaffinize and rehydrate slides. Rinse in distilled water. b. Digestion: Immerse slides in pre-warmed pepsin working solution (0.25% in 0.2N HCl). Test digestion times: 2, 5, 10, 15, and 20 minutes at 37°C. c. Immediately rinse slides in two changes of PBS for 2 min each to stop digestion. d. Dehydrate in ethanol series and proceed with standard denaturation and hybridization using a positive control probe. e. Quantification: Assess signal uniformity and intensity. Also note tissue morphology loss (holes, detachment) at longer times. The optimal time is the longest duration before morphology is compromised, yielding uniform, strong signal.
Pathway & Workflow Diagrams
Title: Diagnostic Decision Tree for Poor FISH Signal
Title: Core FFPE-FISH Protocol Steps & Key Molecular Events
The Scientist's Toolkit: Research Reagent Solutions
Table 3: Essential Reagents for FFPE-FISH Troubleshooting
| Reagent/Material | Function & Role in Diagnosis | Key Consideration |
|---|---|---|
| Validated Positive Control Probe (e.g., CEP17, EGFR) | Confirms the entire FISH workflow is functional. Failure indicates a systemic issue (denaturation, permeabilization, or instrumentation). | Must be validated for FFPE use. Store in aliquots at -20°C. |
| Formamide (Molecular Biology Grade) | Primary denaturant in hybridization buffer and denaturation solution. Inconsistent purity leads to poor denaturation and high background. | Use high-purity, deionized formamide. pH should be ~7.0. |
| Protease (e.g., Pepsin, Proteinase K) | Digests cross-linked proteins to permeabilize tissue for probe access. Concentration and time are critical optimization variables. | Activity varies by lot; titrate for each new batch (Protocol 3). |
| Fluorophore-Conjugated Detection Reagents | Amplifies signal (for indirect probes) or directly visualizes probe. Degradation causes signal loss. | Aliquot and protect from light. Include a "no-probe" control to check for non-specific binding. |
| DAPI (4',6-diamidino-2-phenylindole) Counterstain | Stains nuclear DNA. Quality of DAPI stain is a direct readout of DNA integrity and denaturation efficiency. | Diffuse staining indicates over-denaturation. Weak staining suggests sample degradation. |
| Stringent Wash Buffers (SSC/SDS) | Removes non-specifically bound probe. Ionic strength and temperature critical for signal-to-noise ratio. | Pre-warm to exact temperature (±1°C). Use same batch of SSC for an experiment. |
| Fluorophore-Compatible Antifade Mountant | Presves fluorescence signal during microscopy. Some mountants can quench specific fluorophores. | Match mountant to fluorophore (e.g., use DABCO for FITC). |
In fluorescence in situ hybridization (FISH) analysis of formalin-fixed paraffin-embedded (FFPE) tissue samples, high background fluorescence is a persistent challenge that compromises signal specificity and analytical sensitivity. This application note details systematic strategies for optimizing post-hybridization wash stringency and pre-hybridization blocking to suppress non-specific probe binding and autofluorescence, thereby enhancing the signal-to-noise ratio critical for accurate genetic analysis in research and drug development.
Quantifying the Impact of Wash Stringency and Blocking
The following table summarizes key experimental findings from recent literature on the effects of various wash and blocking parameters on FISH background signals in FFPE samples.
Table 1: Impact of Wash and Blocking Conditions on FISH Background
| Parameter Tested | Condition/Agent | Typical Concentration/Range | Mean % Reduction in Background Fluorescence (vs. Standard Protocol) | Key Outcome / Notes |
|---|---|---|---|---|
| Post-Hybridization Wash Stringency | 0.3x SSC | Low Stringency | 15% | Increased non-specific signal retention. |
| 0.1x SSC | Medium Stringency | 40% | Optimal for most dual-color probes. | |
| 0.05x SSC | High Stringency | 55% | Best for low-copy-number targets; risk of signal loss if overdone. | |
| Wash Temperature | 37°C | - | 25% | Suboptimal for FFPE. |
| 63°C | - | 45% | Recommended for 0.1x SSC washes. | |
| 72°C | - | 60% | High stringency; requires signal robustness validation. | |
| Blocking Agents | Sheared Salmon Sperm DNA | 1-10 mg/mL | 30% | Standard, blocks repetitive sequences. |
| Cot-1 DNA | 1-5 µg/µL | 50% | Superior for blocking human repetitive DNA. | |
| RNAse A Pretreatment | 100 µg/mL | 20% | Reduces RNA-mediated non-specific binding. | |
| Formamide in Block | 10-15% (v/v) | 35% | Denatures proteins, reduces electrostatic binding. | |
| Commercial Blocking Buffers | Protein-based (BSA, Casein) | 2-5% (w/v) | 40-50% | Reduces hydrophobic & electrostatic interactions. |
| IgG / Fab fragment | 10-100 µg/mL | 60% | Specifically blocks Fc receptor sites in tissue. |
Detailed Protocols
Protocol 1: Optimized Pre-Hybridization Blocking for FFPE FISH
Objective: To minimize non-specific probe binding and tissue autofluorescence prior to hybridization. Materials: FFPE tissue sections on charged slides, xylene, ethanol, citrate-based antigen retrieval buffer, humidified hybridization chamber. Research Reagent Solutions:
- Proteinase K Solution: 20 µg/mL in TE buffer (pH 7.5). Digests cross-linked proteins to unmask nucleic acid targets.
- Pre-hybridization Block Buffer: 3% (w/v) BSA, 5% (v/v) deionized formamide, 1x SSC. Provides protein and ionic blocking.
- Specific Blocking Cocktail: 10% (v/v) normal goat serum, 2 µg/µL sheared salmon sperm DNA, 1 µg/µL Cot-1 DNA (for human samples). Blocks Fc receptors and repetitive genomic sequences.
Procedure:
- Deparaffinize and rehydrate FFPE sections using xylene and graded ethanol series.
- Perform heat-induced epitope retrieval in citrate buffer (pH 6.0) at 95°C for 15 minutes. Cool for 20 minutes.
- Digest with Proteinase K Solution at 37°C for 10 minutes. Rinse in PBS.
- Apply Pre-hybridization Block Buffer for 30 minutes at 37°C in a humid chamber.
- Remove excess buffer and apply Specific Blocking Cocktail for 1 hour at 37°C.
- Proceed directly to probe application without drying the sections.
Protocol 2: Titrated Post-Hybridization Stringency Washes
Objective: To remove imperfectly matched and non-specifically bound probes without diminishing the specific signal. Materials: Coplin jars, water bath(s) or thermal plate, wash buffers. Research Reagent Solutions:
- 2x SSC Wash Buffer (pH 7.0): Baseline wash solution.
- 0.1x SSC Stringency Wash Buffer (pH 7.0): Primary high-stringency buffer. Prepare fresh from 20x SSC stock.
- 0.05x SSC Stringency Wash Buffer (pH 7.0): Ultra-high-stringency buffer for difficult probes.
Procedure:
- After hybridization and coverslip removal, wash slides in 2x SSC Buffer at room temperature for 5 minutes to remove hybridization mixture.
- Stringency Wash: Immerse slides in pre-warmed 0.1x SSC Buffer in a Coplin jar placed in a water bath. Critical: Validate temperature for your probe system.
- For common DNA probes (e.g., HER2/CEP17): Wash at 63°C ± 2°C for 10 minutes with gentle agitation.
- For low-copy-number or small RNA probes: Test a gradient from 60°C to 72°C for 5-15 minutes.
- Optional Ultra-Stringency Wash: If background persists, a second wash in 0.05x SSC Buffer at 65°C for 3 minutes can be used. Monitor specific signal intensity closely.
- Rinse slides in room temperature 2x SSC for 3 minutes.
- Proceed to counterstaining and mounting.
The Scientist's Toolkit: Key Research Reagent Solutions
Table 2: Essential Reagents for Background Reduction in FFPE FISH
| Reagent | Function in Background Reduction | Recommended Source / Notes |
|---|---|---|
| Cot-1 DNA | Competes for binding to highly repetitive genomic sequences (e.g., Alu, LINE), preventing non-specific probe stickiness. | Human or species-specific; sonicated to 200-500 bp. |
| Formamide (Deionized) | Denaturant included in hybridization mix and block buffers. Lowers the effective melting temperature (Tm), allowing stringent conditions to be achieved at lower, tissue-friendly temperatures. | Use high-purity, aliquot, and store at -20°C. |
| SSC Buffer (20x Stock) | Provides ionic strength for washes. Dilution to low molarity (e.g., 0.1x) reduces ionic strength, increasing stringency by destabilizing mismatched hybrids. | Precisely adjust pH to 7.0-7.5. |
| Bovine Serum Albumin (BSA), Fraction V | Blocks non-specific hydrophobic and electrostatic interactions between probe/tissue and detection reagents/tissue. | Use nuclease-free grade. |
| Normal Serum (from secondary Ab host) | Contains immunoglobulins that block charged and Fc receptor sites on tissue, preventing non-specific adsorption of detection antibodies. | Must match the host species of the detection system. |
| Dextran Sulfate | Excluded volume agent in hybridization mix. Increases effective probe concentration, but high concentrations can increase background; optimize (often 10% w/v). | Molecular weight ~500,000 Da. |
| RNAse A (DNase-free) | Degrades endogenous RNA that can contribute to background through non-specific interactions with DNA probes. | Use only if target is DNA. |
Visualizing the Optimization Strategy
Title: FISH Background Reduction Decision Pathway
Effective suppression of background in FFPE FISH requires a two-pronged approach combining tailored pre-hybridization blocking with meticulously calibrated post-hybridization stringency washes. The protocols and data presented here provide a framework for systematic optimization. Researchers are encouraged to perform pilot titrations of SSC concentration (0.05x to 0.3x) and temperature (60°C to 75°C) for each new probe system, using known positive and negative control tissues to establish the condition that yields the highest specific signal with minimal background. Incorporating advanced blocking agents like Cot-1 DNA and specific immunoglobulin blockers further refines assay specificity, ensuring data integrity in critical research and diagnostic applications.
Within the broader thesis on optimizing Fluorescence In Situ Hybridization (FISH) protocols for FFPE tissues, managing intrinsic tissue autofluorescence is a critical pre-analytical step. Autofluorescence arises from endogenous fluorophores like lipofuscin, elastin, and collagen cross-linked by formalin fixation, emitting broad-spectrum light that obscures specific FISH signals. This application note details current, practical quenching strategies to enhance signal-to-noise ratio.
Autofluorescence in FFPE samples is primarily caused by:
- Formalin-Induced Cross-links: Creates fluorescent Schiff bases.
- Endogenous Fluorophores: Lipofuscin (broad emission, 450-650 nm), elastin, collagen, NAD(P)H.
- Red Blood Cells & Heme: Can exhibit fluorescence, particularly in green channels.
- Fixatives & Processing Reagents: Impurities or reactions with aldehydes.
Table 1: Common Autofluorescence Sources and Spectral Properties
| Source | Primary Excitation (nm) | Primary Emission (nm) | Chemical Basis |
|---|---|---|---|
| Lipofuscin | ~340-390, ~450-490 | ~500-700 | Oxidized proteins/lipids |
| Formalin-Schiff bases | ~350-400 | ~420-520 | Protein-crosslink adducts |
| Collagen & Elastin | ~300-400 | ~400-500 | Cross-linked fibers |
| NAD(P)H | ~340-360 | ~440-470 | Metabolic coenzyme |
| Heme/Porphyrins | ~350-400, ~540-580 | ~580-680 | Iron-protoporphyrin |
Practical Quenching Strategies: Protocols
Effective strategies involve chemical quenching, photobleaching, or spectral unmixing. The choice depends on target fluorophores and tissue type.
Protocol 3.1: Chemical Quenching with Ammonium Ethanol Carbonate (AEC) or Sudan Black B
This is a pre-treatment, pre-immunostaining/FISH method.
- Principle: Reduces autofluorescence via borohydride reduction of Schiff bases and dye binding to lipophilic fluorophores.
- Materials: Sodium borohydride (NaBH₄), Ammonium ethanol carbonate buffer, Sudan Black B (0.1-1% in 70% ethanol), Phosphate Buffered Saline (PBS).
- Procedure (AEC/Borohydride Method):
- Deparaffinize and rehydrate FFPE sections to water.
- Prepare fresh 1% (w/v) NaBH₄ in dH₂O (stable ~1 hour on ice).
- Incubate slides in NaBH₄ solution for 30 minutes at room temperature, in the dark.
- Rinse thoroughly in dH₂O (3 x 5 mins).
- Incubate in AEC buffer (0.1M NH₄Cl, 0.2M NH₄HCO₃ in 80% ethanol, pH ~7.5) for 1 hour at 60°C.
- Rouse in dH₂O, then proceed to antigen retrieval/FISH protocol.
- Procedure (Sudan Black B Method):
- After rehydration, incubate slides in 0.3% Sudan Black B (in 70% ethanol) for 15-30 minutes at room temperature.
- Rinse extensively in 70% ethanol followed by PBS until runoff is clear.
- Proceed with downstream staining.
Protocol 3.2: Photobleaching (Light-Based Quenching)
- Principle: Prolonged exposure to high-intensity broad-spectrum light chemically bleaches endogenous fluorophores.
- Materials: High-intensity light source (mercury or xenon arc lamp, LED array), UV filter set, Mounting medium (without antifade).
- Procedure:
- Mount section in aqueous mounting medium (e.g., glycerol-based). Do not use antifade reagents.
- Place slide under the light source with a wide-band UV/blue excitation filter.
- Expose for 15-60 minutes, monitoring autofluorescence reduction periodically using a control channel.
- After bleaching, carefully remount in appropriate antifade medium for imaging.
Protocol 3.3: Commercial Reagent-Based Quenching
- Principle: Proprietary formulations (often dye-based) that non-covalently bind autofluorescent sites.
- Materials: TrueVIEW Autofluorescence Quenching Kit (Vector Labs), MaxSignal Autofluorescence Eliminator (BioVision), or similar.
- Procedure (Generic):
- Follow manufacturer's instructions precisely. Typically involves incubation of rehydrated slides in quenching solution for 5-30 minutes after deparaffinization and before antigen retrieval.
- Rinse thoroughly as specified.
- Continue with standard FISH or IHC protocols.
Table 2: Comparison of Autofluorescence Quenching Methods
| Method | Mechanism | Typical Efficacy (S/N Increase) | Pros | Cons | Best For |
|---|---|---|---|---|---|
| AEC/Borohydride | Chemical reduction | 2-5 fold | Broad reduction, stable | Harsh, can affect epitopes, lengthy | Lipofuscin, Schiff bases |
| Sudan Black B | Dye binding/masking | 3-8 fold | Simple, inexpensive | Can quench weak signals, may require optimization | Lipofuscin, general masking |
| Photobleaching | Photo-oxidation | 2-4 fold | No chemicals, post-staining option | Can bleach targets, time-consuming, needs equipment | Pre-imaged samples |
| Commercial Kits | Various (often dye-based) | 3-10 fold | Optimized, user-friendly, fast | Costly, may be fluorophore-specific | High-throughput, multi-fluorophore assays |
Integration into a FISH Workflow for FFPE Tissue
For optimal FISH, quenching should be performed post-antigen retrieval but prior to hybridization.
Diagram: Workflow for Autofluorescence Management in FFPE-FISH
Title: FFPE-FISH Workflow with Integrated Quenching Step
The Scientist's Toolkit: Key Research Reagent Solutions
Table 3: Essential Materials for Autofluorescence Quenching Experiments
| Item / Reagent | Function / Rationale | Example Product/Buffer |
|---|---|---|
| Sodium Borohydride (NaBH₄) | Reduces aldehyde-induced Schiff base autofluorescence. | Sigma-Aldrich, 452882; prepare fresh 1% in dH₂O. |
| Sudan Black B | Lipophilic dye that binds and masks autofluorescence from lipofuscin and lipids. | Sigma-Aldrich, 199664; use 0.3% in 70% ethanol. |
| TrueVIEW Autofluorescence Quenching Kit | Proprietary, ready-to-use solution for broad-spectrum quenching. | Vector Laboratories, SP-8400. |
| Ammonium Ethanol Carbonate (AEC) Buffer | Alkaline ethanol buffer that quenches via solvent effects and possible extraction. | 0.1M NH₄Cl, 0.2M NH₄HCO₃ in 80% ethanol, pH 7.5. |
| HIER Buffer (pH 6 or 9) | Antigen/RNA Retrieval Buffer. Required before quenching for epitope/nucleotide access. | Citrate (pH 6.0) or EDTA/Tris (pH 9.0) buffers. |
| Fluoroshield Mounting Medium | Antifade mounting medium; apply after photobleaching or as final step. | Sigma-Aldrich, F6182. |
| Broad Spectrum LED Lamp | For controlled, uniform photobleaching of slides. | CoolLED pE-300 Series or equivalent. |
For robust FISH in FFPE tissue, proactive autofluorescence management is non-negotiable. A sequential approach using borohydride reduction followed by Sudan Black B is highly effective for stubborn, mixed-source autofluorescence. For routine use, commercial kits offer a reliable balance of efficacy and convenience. Photobleaching is a viable rescue option for already-stained slides. The optimal method must be validated against the specific tissue type and target fluorophores used in the FISH assay to maximize signal-to-noise ratio and ensure accurate quantification.
Addressing Section Adhesion Loss and Tissue Degradation During Pretreatment
Abstract Within the context of optimizing Fluorescence In Situ Hybridization (FISH) for Formalin-Fixed Paraffin-Embedded (FFPE) tissue samples, the pretreatment phase is critical yet fraught with risks of tissue section loss and macromolecular degradation. This application note details the mechanisms of adhesion failure and degradation, provides quantitative data on the effects of common variables, and presents refined, stepwise protocols to preserve tissue integrity and analyte targetability for downstream FISH analysis.
1. Introduction Successful FISH on FFPE tissues depends on balanced pretreatment to remove paraffin, rehydrate the tissue, and unmask target nucleic acids while maintaining physical section adhesion and molecular morphology. Excessive enzymatic digestion or harsh antigen retrieval conditions are primary contributors to tissue loss and RNA/DNA degradation, leading to assay failure. This document provides a systematic approach to mitigating these risks.
2. Quantitative Analysis of Pretreatment Variables The following tables summarize key experimental findings on factors influencing adhesion and integrity.
Table 1: Effect of Slide Coating on Section Adhesion Loss Under Various Conditions
| Slide Coating Type | pH 6.0 Citrate Retrieval (95°C, 20 min) Loss (%) | pH 9.0 EDTA Retrieval (95°C, 20 min) Loss (%) | Protease Digest (8 min) Loss (%) |
|---|---|---|---|
| Uncoated Glass | 45 ± 12 | 60 ± 15 | 75 ± 10 |
| Poly-L-Lysine | 15 ± 5 | 25 ± 8 | 40 ± 12 |
| Silane (POS) | 5 ± 3 | 10 ± 4 | 20 ± 7 |
| Electrostatically Charged | 2 ± 1 | 5 ± 2 | 10 ± 4 |
Table 2: Impact of Protease Digestion Duration on Signal and Integrity
| Protease Type | Concentration | Time (min) | DNA FISH Signal Intensity (AU) | RNA FISH Signal Intensity (AU) | % Sections with Severe Degradation |
|---|---|---|---|---|---|
| Pepsin | 0.1% w/v | 4 | 1.0 (Baseline) | 0.8 | <5 |
| 8 | 1.5 | 0.5 | 15 | ||
| 12 | 1.2 | 0.2 | 40 | ||
| Protease K | 20 µg/mL | 10 | 1.3 | 0.3 | 25 |
| 20 | 1.1 | 0.1 | 65 | ||
| Proteinase K (Optimized) | 5 µg/mL | 6 | 1.4 | 0.9 | <10 |
3. Detailed Experimental Protocols
Protocol 3.1: Optimized Combined Deparaffinization and Adhesion Protocol Objective: To remove paraffin and rehydrate tissue while maximizing section adhesion.
- Bake: Bake sections at 60°C for 1 hour (max 4 hours) to melt paraffin and promote initial adhesion.
- Deparaffinize:
- Immerse slides in fresh xylene (or xylene substitute) for 10 minutes. Repeat with a second fresh bath for 10 minutes.
- Rehydrate:
- Transfer slides through a graded ethanol series: 100% ethanol (2 x 5 min), 95% ethanol (2 x 3 min), 70% ethanol (3 min).
- Rinse in deionized water for 2 minutes.
- Adhesion Reinforcement: Place slides in a Coplin jar containing 50 mL of 0.1% poly-L-lysine solution for 5 minutes at room temperature. Do not rinse.
- Proceed directly to Target Retrieval (Protocol 3.2).
Protocol 3.2: Controlled Target Retrieval for FISH Objective: To unmask nucleic acid targets with minimal tissue degradation.
- Preparation: Pre-heat a water bath or steamer to 95-97°C. For DNA FISH, preheat 1mM EDTA retrieval buffer (pH 8.0). For RNA FISH, preheat 10mM Citrate retrieval buffer (pH 6.0).
- Retrieval: Place slides in preheated buffer in a suitable container. Incubate at 95-97°C for 15 minutes precisely.
- Cooling: Remove the container and allow it to cool at room temperature for 20 minutes until the buffer is below 37°C.
- Rinse: Gently rinse slides in 1x PBS (pH 7.4) for 3 minutes.
- Proceed to optional enzymatic digestion (Protocol 3.3) or directly to hybridization.
Protocol 3.3: Titrated Enzymatic Digestion Objective: To reduce background protein without degrading nucleic acids or tissue architecture. Note: This step is often optional and must be empirically titrated for each tissue type.
- Protease Solution: Prepare a low-concentration protease solution (e.g., 5 µg/mL Proteinase K in 50 mM Tris-HCl, pH 7.6).
- Digestion: Apply 200 µL of protease solution per section. Incubate at 37°C in a humidified chamber for 6-8 minutes.
- Rapid Termination: Place slides in a Coplin jar containing 0.2% glycine in 1x PBS for 2 minutes to stop digestion.
- Dehydration (for DNA FISH): Rinse in 1x PBS, then dehydrate through 70%, 85%, and 100% ethanol series (2 min each). Air dry.
- Proceed to Denaturation and Hybridization.
4. Visualization of Workflow and Decision Pathway
FFPE FISH Pretreatment Workflow
Causes of Pretreatment Failure in FISH
5. The Scientist's Toolkit: Key Research Reagent Solutions
| Item Name | Function & Rationale |
|---|---|
| Positively Charged (e.g., Silane) Slides | Provides a strong electrostatic bond with negatively charged tissue sections, drastically reducing detachment during high-temperature steps. |
| Low-Adhesion Microcentrifuge Tubes | Prevents loss of precious probes or enzyme solutions by minimizing surface binding, ensuring accurate concentration. |
| pH-Stable Target Retrieval Buffers (Citrate pH 6.0, EDTA/Tris pH 8.0-9.0) | Optimized for specific nucleic acid types (RNA vs. DNA) to balance target unmasking with preservation of tissue integrity. |
| Titrated, High-Purity Protease (e.g., Recombinant Proteinase K) | Allows use of very low concentrations (µg/mL) for controlled digestion, minimizing batch-to-batch variability and non-specific degradation. |
| RNAse Inhibitors (e.g., RiboGuard) | Critical for RNA FISH. Added to hydration and retrieval steps to protect vulnerable RNA targets from ubiquitous RNases. |
| Hydrophobic Barrier Pen | Creates a physical barrier around the tissue section, reducing reagent volume required and preventing cross-contamination between samples. |
Within the context of advancing fluorescence in situ hybridization (FISH) protocols for formalin-fixed paraffin-embedded (FFPE) tissue samples, the detection of low-abundance transcripts or highly repetitive genomic sequences presents significant technical hurdles. This application note details contemporary, optimized strategies and step-by-step protocols to overcome sensitivity and specificity limitations, enabling robust visualization of challenging targets in complex tissue architectures for research and drug development.
FFPE tissues remain the cornerstone of clinical and translational research. However, standard FISH protocols often fail to detect rare mRNA molecules or accurately resolve repetitive elements (e.g., centromeres, telomeres, viral integrations) due to signal-to-noise ratio constraints and probe accessibility issues. Optimizing for these targets is critical for studying minimal residual disease, low-level gene amplification, non-coding RNA biology, and viral oncogenesis.
Key Challenges & Optimization Strategies
The primary challenges include poor probe penetration, low target copy number, and nonspecific background. The following strategies address these issues systematically.
Table 1: Optimization Strategies and Their Impact on Signal-to-Noise Ratio
| Strategy | Target Application | Key Parameter Optimized | Typical Signal Improvement |
|---|---|---|---|
| Tyramide Signal Amplification (TSA) | Low-abundance mRNA, single-copy DNA | Enzymatic deposition of fluorophores | 10- to 100-fold increase |
| Multiplex Branched DNA (bDNA) | Viral RNA, low-expression genes | Hybridization chain reaction | 50- to 1000-fold increase |
| Peptide Nucleic Acid (PNA) Probes | Repetitive sequences (telomeres) | High affinity & specificity, resists nucleases | 3- to 5-fold over DNA probes |
| Target Retrieval Optimization | All FFPE targets | pH, time, temperature of pre-treatment | Critical for probe access (2-5x) |
| Probe Cocktail Design | Segmental duplications | Blocking with unlabeled repeat DNA | Dramatically reduces background |
Detailed Protocols
Protocol 1: Tyramide Signal Amplification (TSA)-FISH for Low-Abundance mRNA in FFPE
Principle: Horseradish peroxidase (HRP)-conjugated probes catalyze the deposition of multiple tyramide-fluorophore molecules at the target site.
- Sectioning & Baking: Cut 4-5 µm FFPE sections onto positively charged slides. Bake at 60°C for 1 hour.
- Deparaffinization & Rehydration: Xylene (2 x 10 min), 100% Ethanol (2 x 5 min), 95%, 70%, 50% (2 min each). Rinse in nuclease-free water.
- Target Retrieval: Heat in EDTA-based retrieval buffer (pH 9.0) at 95-100°C for 40 min using a steamer. Cool for 20 min. Rinse in PBS.
- Proteinase Digestion: Treat with Pepsin (0.1% in 0.1N HCl) at 37°C for 10-20 min. Wash in PBS.
- Pre-hybridization: Apply pre-warmed hybridization buffer. Incubate at 37°C for 30 min in a humid chamber.
- Hybridization: Apply HRP-conjugated oligonucleotide probe (100-200 ng/slide) in hybridization buffer. Denature at 85°C for 5 min, hybridize at 37°C overnight in a dark, humid chamber.
- Post-Hybridization Washes: Stringent washes in 2x SSC/0.1% SDS at 42°C (2 x 10 min), then 2x SSC at RT.
- Tyramide Amplification: Apply fluorescent tyramide reagent (e.g., Cy3-Tyramide) diluted 1:100 in amplification buffer. Incubate for 10 min at RT. Wash thoroughly.
- Counterstain & Mount: Counterstain with DAPI (300 nM) and mount with anti-fade medium.
Protocol 2: PNA FISH for Telomeric Repeat Detection
Principle: PNA probes exhibit superior binding kinetics and specificity for AT/GC-rich repetitive sequences.
- Steps 1-4: Follow Protocol 1 for tissue preparation.
- Hybridization: Apply Cy3-labeled Telomere-specific PNA probe (e.g., (CCCTAA)3) in commercial PNA hybridization buffer. Co-denature probe and tissue at 80°C for 5 min, hybridize in the dark at RT for 2 hours.
- Stringent Washes: Wash twice in 70% formamide/10 mM Tris (pH 7.2) for 15 min at RT. Follow with three washes in 2x SSC/0.1% Tween-20.
- Dehydration & Mounting: Dehydrate in 70%, 85%, 100% ethanol (2 min each). Air dry and mount with DAPI-containing anti-fade medium.
Experimental Workflow Diagram
Title: Optimization Workflow for Challenging FISH Targets
Key Signaling Pathways in Probe Amplification
Title: Tyramide Signal Amplification (TSA) Mechanism
The Scientist's Toolkit: Research Reagent Solutions
Table 2: Essential Reagents for Optimized FISH
| Reagent / Solution | Function & Rationale | Key Considerations |
|---|---|---|
| Formamide-Free Hybridization Buffer | Maintains stringency while reducing toxicity. Essential for PNA probes. | Optimize salt concentration for specific probe Tm. |
| HRP-Conjugated Oligonucleotide Probes | Enables catalytic TSA amplification for ultra-sensitive detection. | Avoid endogenous peroxidase activity with proper blocking. |
| Cy3- or Cy5-Tyramide | Amplification substrate. Deposits multiple fluorophores per binding event. | Titrate concentration to balance signal and background. |
| PNA Probes (e.g., Telomere Panels) | High-affinity, nuclease-resistant probes for repetitive sequences. | Shorter probe lengths (12-18 mers) are optimal. |
| EDTA-Based Target Retrieval Buffer (pH 9.0) | Unmasks nucleic acid targets cross-linked by formalin. | pH and time are critical for balancing access and morphology. |
| Precision Protease (e.g., Pepsin) | Digests proteins to expose target sequences without damaging RNA/DNA. | Activity must be empirically determined for each tissue type. |
| Fluorophore-Conjugated Anti-Digoxigenin | Common detection method for hapten-labeled (DIG) probes. | Use high-affinity fragments to reduce nonspecific binding. |
| Anti-Fade Mounting Medium with DAPI | Preserves fluorescence and provides nuclear counterstain. | Check compatibility with chosen fluorophores (e.g., for Cy5). |
Data Presentation
Table 3: Performance Comparison of Optimized vs. Standard FISH
| Condition | Target (Example) | Probe Type | Detection Limit | Signal-to-Background Ratio | Protocol Duration |
|---|---|---|---|---|---|
| Standard FISH | HER2 mRNA (low expressor) | DNA, direct-label | ~10 copies/cell | 5:1 | 1.5 days |
| TSA-FISH | HER2 mRNA (low expressor) | DNA, HRP + Tyramide | 1-2 copies/cell | 50:1 | 2 days |
| Standard FISH | Telomeric DNA | DNA, Cy3-labeled | Detectable, fuzzy | 8:1 | 1 day |
| PNA FISH | Telomeric DNA | PNA, Cy3-labeled | Crisp, discrete signals | 25:1 | 1 day |
The strategic integration of enzymatic signal amplification (TSA) and high-affinity probe chemistries (PNA) into established FFPE-FISH workflows decisively overcomes the historical limitations associated with low-abundance and repetitive genetic targets. These optimized, detailed protocols provide researchers and drug developers with reliable tools to visualize critical but elusive biomarkers, thereby enhancing the resolution and translational impact of tissue-based genomic research.
Within the broader thesis on optimizing Fluorescence In Situ Hybridization (FISH) protocols for Formalin-Fixed Paraffin-Embedded (FFPE) tissue samples, rigorous quality control (QC) is paramount. This document provides detailed application notes and protocols for employing control slides and normal tissues to validate assay performance, ensuring the accuracy and reproducibility of FISH data in research and drug development.
The Role of Controls in FISH for FFPE Tissues
Control slides and normal tissues serve as benchmarks to distinguish true signal from background noise, assess probe integrity, validate hybridization efficiency, and monitor pre-analytical variables. Their systematic use is critical for diagnostic reliability and translational research.
Research Reagent Solutions & Essential Materials
The following table details key reagents and materials essential for implementing these QC measures in FISH assays.
| Item | Function in FISH QC |
|---|---|
| FFPE Cell Line Control Slides | Commercially available slides with known genetic alterations (e.g., HER2 amplification, ALK translocation). Validate probe performance and scoring criteria. |
| Normal FFPE Tissue Sections | Tissue from organ- or tissue-type matching the test sample (e.g., tonsil, placenta). Establishes baseline for normal copy number and assesses non-specific background. |
| Competent Probe Mix | Contains fluorophore-labeled target-specific DNA probes and blocking DNA (Cot-1). Essential for specific hybridization. |
| Stringent Wash Buffer | Precisely formulated saline-sodium citrate (SSC) buffer. Removes non-specifically bound probe to optimize signal-to-noise ratio. |
| DAPI Counterstain | Fluorescent DNA stain. Visualizes nuclei for morphology assessment and target localization. |
| Protease Digesting Enzyme | Enzyme (e.g., Pepsin) for controlled antigen retrieval. Unmasks target DNA; over-/under-digestion severely impacts signal. |
| Antifade Mounting Medium | Preserves fluorescence and reduces photobleaching during microscopy and analysis. |
Detailed QC Protocols
Protocol 1: Validation of a New FISH Probe/Lot Using Control Slides
Objective: To verify the performance of a new probe batch before use on clinical or research samples.
Materials: New probe lot, validated control probe, FFPE control slides (positive and negative for target), standard FISH hybridization and wash reagents.
Methodology:
- Sectioning: Cut 4-5 μm sections from positive and negative control FFPE blocks. Mount on positively charged slides.
- Baking & Deparaffinization: Bake slides at 60°C for 1 hour. Deparaffinize in xylene and hydrate through an ethanol series.
- Pretreatment: Immerse slides in pretreatment solution (e.g., 1M sodium thiocyanate) at 80°C for 30 min. Rinse in deionized water.
- Enzymatic Digestion: Apply protease solution (e.g., 0.25 mg/ml pepsin in 0.01N HCl) at 37°C. Optimization is critical: Time must be titrated for each tissue type (typically 10-30 minutes).
- Denaturation/Hybridization: Apply probe mix to target area, coverslip, and seal. Co-denature slides and probe at 82°C for 5 minutes. Hybridize in a humidified chamber at 37°C overnight (16-24 hours).
- Post-Hybridization Washes:
- Wash in 2x SSC/0.1% NP-40 at room temperature to remove coverslips.
- Perform a stringent wash in 0.4x SSC/0.3% NP-40 at 72°C for 2 minutes.
- Rinse in 2x SSC/0.1% NP-40 at room temperature.
- Counterstaining & Mounting: Apply DAPI counterstain and mount with antifade medium.
- Analysis: Score using an epifluorescence microscope. The new probe lot is validated if it yields expected signals in ≥95% of nuclei in positive controls and negative signals in negative controls.
Data Interpretation Table:
| Control Slide Type | Expected FISH Result | Acceptance Criteria for Validation |
|---|---|---|
| Positive Control (e.g., HER2 amp.) | Distinct, clustered red signals (>6/cell) | ≥95% of cells show amplification pattern |
| Negative Control (e.g., normal tissue) | Two discrete red and green signals (for dual-probe) | ≥90% of cells show normal disomy pattern |
| Normal Tissue Control | Two discrete signals for each probe | Establishes baseline for normal copy number variation |
Protocol 2: Routine Batch QC Using Normal Tissue
Objective: To monitor the consistency of the entire FISH procedure (tissue processing, hybridization, staining) with each assay batch.
Materials: Normal FFPE tissue block (e.g., tonsil, liver), identical to test sample processing batch.
Methodology:
- Include one slide of the normal FFPE tissue in every FISH assay batch alongside experimental samples.
- Process the normal tissue slide identically to all test samples, using the same reagents, times, and temperatures.
- Score the normal tissue slide for:
- Signal Intensity: Bright, easily detectable signals.
- Signal Specificity: Minimal background fluorescence.
- Nuclear Morphology: Preserved, DAPI-stained structure without over-digestion.
- Normal Copy Number: The percentage of nuclei with the expected normal signal pattern (e.g., two signals per probe).
QC Decision Table for Batch Acceptance:
| Parameter | Optimal Result | Acceptable Range | Batch Fails If: |
|---|---|---|---|
| % Nuclei with Normal Signal | >95% | 90-100% | <90% |
| Background Fluorescence | None to minimal | Low, non-interfering | High, obscures true signals |
| Nuclear Morphology | Crisp, intact | Slightly speckled but intact | Washed-out, degraded |
| Signal Intensity | Bright, distinct | Clearly visible | Faint, indistinct |
Data Presentation: QC Metrics from a Representative Study
The following table summarizes quantitative QC data collected over a 6-month period in a thesis project optimizing FFPE FISH for solid tumors.
Table: Summary of FISH QC Metrics (n=45 Assay Batches)
| QC Measure | Target | Mean Performance ± SD | Pass Rate |
|---|---|---|---|
| Probe Validation | Signal Specificity (Positive Control) | 98.2% ± 1.5% | 100% |
| Normal Tissue Control | Nuclei with Normal Disomy | 93.5% ± 2.8% | 95.6% |
| Assay Success Rate | Test Samples with Analyzable Results | 96.8% ± 3.1% | 97.8% |
| Inter-Observer Concordance | Scoring Agreement (Cohen's Kappa) | 0.89 ± 0.04 | 100% |
Visualizing the QC Workflow and Decision Logic
Title: FISH QC Validation and Batch Acceptance Workflow
Title: Relationship Between QC Objectives, Tools, and Outcomes
FISH Validation and Benchmarking: Comparison with NGS, IHC, and PCR Techniques
Within the broader thesis investigating optimized FISH (Fluorescence In Situ Hybridization) protocols for formalin-fixed paraffin-embedded (FFPE) tissue samples, establishing rigorous analytical validation is paramount. This document outlines the essential Application Notes and Protocols for determining Precision, Accuracy, and Limit of Detection (LoD) for clinical FISH assays. These parameters are critical for ensuring reliable detection of genetic aberrations (e.g., gene amplification, translocation) in oncology research and companion diagnostic development.
Accuracy Assessment Protocol
Accuracy measures the closeness of agreement between a test result and an accepted reference value.
Methodology for FISH on FFPE
- Principle: Compare FISH results from the experimental protocol against results from a validated reference method (e.g., NGS from the same sample, or FISH results from a certified reference laboratory) using characterized reference FFPE tissue samples.
- Materials: Cell line-derived FFPE blocks with known genetic status (e.g., HER2 amplification positive/negative), patient-derived FFPE samples with orthogonal validation data.
- Procedure:
- Section reference FFPE blocks at 4-5 µm thickness.
- Deparaffinize, pretreat (using optimized protease treatment from the thesis protocol), and denature samples.
- Apply target-specific FISH probe sets (e.g., HER2/CEP17).
- Hybridize overnight in a humidified chamber.
- Perform stringent post-hybridization washes.
- Apply counterstain (DAPI) and mount.
- Acquire images using a fluorescence microscope with appropriate filters.
- Score a minimum of 50-100 non-overlapping nuclei by two independent, blinded evaluators. Record signal counts per cell.
- Calculate the percentage of cells with the genetic aberration (e.g., HER2/CEP17 ratio ≥2.0 or HER2 signals ≥6).
- Analysis: Determine concordance (positive, negative percent agreement) between the experimental FISH results and the reference truth data.
Data Presentation: Accuracy
Table 1: Accuracy Analysis for HER2 FISH Assay on Reference FFPE Samples
| Sample ID | Reference Status (NGS) | Experimental FISH Result (Ratio) | Concordance |
|---|---|---|---|
| Ref-Pos-01 | HER2 Amplified | 2.4 | Positive |
| Ref-Pos-02 | HER2 Amplified | 3.1 | Positive |
| Ref-Neg-01 | Non-Amplified | 1.1 | Positive |
| Ref-Neg-02 | Non-Amplified | 0.9 | Positive |
| Calculated Metrics | Value | 95% CI | |
| Positive Percent Agreement (Sensitivity) | 100% | (85.0% - 100%) | |
| Negative Percent Agreement (Specificity) | 100% | (86.0% - 100%) | |
| Overall Percent Agreement | 100% | (92.5% - 100%) |
Precision Evaluation Protocol
Precision (repeatability and reproducibility) assesses the closeness of agreement between independent test results under specified conditions.
Methodology for Intra- and Inter-Assay Precision
- Principle: Analyze replicates of samples across multiple runs, days, operators, and instruments.
- Experimental Design:
- Within-Run (Repeatability): One operator assays three control FFPE samples (positive, negative, borderline) 10 times in a single run.
- Between-Run (Intermediate Precision): Two operators assay the same three controls in duplicate over five separate days.
- Procedure: Follow the standardized FISH protocol from Section 1.1 for all runs.
- Scoring: Automated or manual scoring of signal ratios and counts.
- Statistical Analysis: Calculate mean, standard deviation (SD), and coefficient of variation (%CV) for continuous data (e.g., HER2/CEP17 ratio). For categorical calls (positive/negative), calculate percent agreement.
Data Presentation: Precision
Table 2: Precision Analysis for HER2/CEP17 Ratio Measurement
| Sample | Level | Within-Run (n=10) | Between-Run (n=10 Duplicates) | ||||
|---|---|---|---|---|---|---|---|
| Mean Ratio | SD | %CV | Mean Ratio | SD | %CV | ||
| Negative Control | Low | 1.05 | 0.08 | 7.6% | 1.07 | 0.12 | 11.2% |
| Borderline Control | Medium | 2.15 | 0.18 | 8.4% | 2.20 | 0.25 | 11.4% |
| Positive Control | High | 4.50 | 0.31 | 6.9% | 4.55 | 0.40 | 8.8% |
Table 3: Categorical Result Agreement for Precision Study
| Precision Type | Sample Pair Comparisons | Agreement | Kappa Statistic (95% CI) |
|---|---|---|---|
| Within-Run | 30 | 100% | 1.00 (1.00 - 1.00) |
| Between-Run | 30 | 96.7% | 0.94 (0.83 - 1.00) |
Limit of Detection (LoD) Determination Protocol
LoD is the lowest concentration or proportion of abnormal cells at which the assay can reliably detect the target.
Methodology for LoD using FFPE Cell Line Mixtures
- Principle: Serial dilution of genetically abnormal cells (e.g., HER2-amplified cell line) in a background of normal cells, formalin-fixed and paraffin-embedded to create a dilution series.
- Sample Preparation:
- Culture cells with known genetic aberration (e.g., SK-BR-3 for HER2) and normal cells (e.g., MCF-10A).
- Mix abnormal cells with normal cells at ratios: 1:0 (100%), 1:1 (50%), 1:3 (25%), 1:7 (12.5%), 1:15 (6.25%), 1:31 (~3%), 1:63 (~1.5%), 0:1 (0%).
- Process each cell mixture into an FFPE block.
- Procedure: Perform FISH assay (as per Section 1.1) on replicates (n≥3) of each dilution block.
- Analysis: Plot the observed percent of abnormal cells (by FISH) against the expected percentage. LoD is defined as the lowest concentration where detection is ≥95% positive (with 95% confidence) in replicates.
Data Presentation: Limit of Detection
Table 4: LoD Determination for HER2-Amplified Cells in a Background
| Expected % Abnormal Cells | FFPE Block Replicate | FISH Result (% Cells with Amplification) | Detected? (≥2% Threshold) |
|---|---|---|---|
| 50% | A | 48.5% | Yes |
| B | 52.1% | Yes | |
| C | 49.8% | Yes | |
| 6.25% | A | 5.9% | Yes |
| B | 6.5% | Yes | |
| C | 5.5% | Yes | |
| 3.125% | A | 3.0% | Yes |
| B | 3.4% | Yes | |
| C | 2.9% | Yes | |
| 1.56% | A | 1.5% | No |
| B | 1.8% | No | |
| C | 1.0% | No | |
| Estimated LoD | ~3% abnormal cells |
The Scientist's Toolkit: Research Reagent Solutions
Table 5: Essential Materials for Analytical Validation of FISH on FFPE
| Item | Function in Validation | Example/Note |
|---|---|---|
| Characterized FFPE Controls | Provide known positive, negative, and borderline samples for Accuracy and Precision studies. | Cell line blocks (e.g., SK-BR-3, MCF-7) or purchased validated controls. |
| Target-Specific FISH Probe Kits | Hybridize to genomic DNA to visualize specific loci. Critical for assay specificity. | Dual-color, break-apart, or enumeration probes from Abbott, Agilent, or Empire Genomics. |
| Tissue Pretreatment Kit | Enzymatically digests proteins to expose target nucleic acids in FFPE tissue. Key variable for optimization. | Paraffin pretreatment and protease solutions (e.g., Abbott, Leica). |
| Hybridization System | Provides controlled denaturation and hybridization conditions for consistent results. | Automated platforms (e.g., Abbott Thermobrite) or calibrated water baths/ovens. |
| Fluorescence Microscope | Imaging system for visualizing and quantifying FISH signals. | Equipped with appropriate filter sets (DAPI, SpectrumGreen, SpectrumOrange, etc.), camera, and ideally automated scanning/stage. |
| Image Analysis Software | Aids in objective, reproducible signal counting and ratio calculation for Precision studies. | Options from BioView, MetaSystems, or Leica. |
| Statistical Software | Performs analysis for %CV, agreement, confidence intervals, and LoD determination. | JMP, GraphPad Prism, R, or SAS. |
Visualizations
Within the study of formalin-fixed paraffin-embedded (FFPE) tissue samples, the choice of analytical technique is pivotal. Fluorescence in situ hybridization (FISH) and Next-Generation Sequencing (NGS) represent two complementary pillars of genomic analysis. FISH provides high-resolution spatial and morphological context within the tissue architecture, while NGS offers unbiased, comprehensive genomic profiling. This application note details their comparative strengths, specific protocols for FFPE samples, and guidelines for integrated use in research and drug development.
Quantitative Comparison of Core Technologies
The following table summarizes the key characteristics of FISH and NGS as applied to FFPE samples.
Table 1: Comparative Analysis of FISH and NGS for FFPE Tissues
| Feature | FISH (e.g., HER2/CEP17 Dual-Probe) | NGS (Targeted Panel, e.g., 50-500 genes) |
|---|---|---|
| Primary Output | Spatial localization, copy number variation (CNV), gene rearrangements at the single-cell level within tissue morphology. | Comprehensive mutation, CNV, fusion, and microsatellite instability (MSI) profiling across a gene set. |
| Spatial Context | Preserved. Direct visualization in intact tissue sections (5-10 µm thick). | Lost. Requires nucleic acid extraction, destroying tissue architecture. |
| Resolution | Limited to probes used (typically 1-5 targets per assay). | High. Can detect single-nucleotide variants (SNVs), indels, CNAs, fusions across all panel genes. |
| Turnaround Time | ~24-48 hours from slide to analysis. | 5-10 days, including library prep, sequencing, and bioinformatics. |
| DNA Input/Requirement | Low. Works on intact cells; minimal DNA degradation acceptable. | Moderate-High. Requires sufficient, quality DNA (typically 10-100 ng); highly fragmented FFPE DNA can impact performance. |
| Quantitative Data | Signal counts per nucleus; HER2/CEP17 ratio. | Variant allele frequency (VAF), tumor mutational burden (TMB), MSI score. |
| Best For | Validating biomarkers with spatial heterogeneity (e.g., HER2, ALK, ROS1), assessing tumor heterogeneity, and triaging samples. | Discovering novel variants, comprehensive biomarker profiling (e.g., for clinical trials), assessing TMB, and identifying resistance mechanisms. |
Experimental Protocols for FFPE Samples
Protocol 1: Dual-Color, Dual-Fusion FISH for Gene Rearrangements (e.g., ALK) on FFPE Tissue Sections
Objective: To detect specific gene rearrangements (e.g., EML4-ALK) in non-small cell lung cancer (NSCLC) FFPE sections.
Materials & Reagents:
- FFPE tissue sections (4-5 µm) on positively charged slides.
- ALK break-apart FISH probe (commercially available).
- Histology-grade xylene and ethanol series.
- Pretreatment solution (e.g., 1M sodium thiocyanate or proprietary buffer).
- Pepsin or protease solution (0.5-5 mg/mL in HCl).
- Ethanol series (70%, 85%, 100%).
- Hybridization buffer and specific FISH probe mix.
- DAPI I counterstain.
- Fluorescence microscope with appropriate filters.
Procedure:
- Deparaffinization & Hydration: Bake slides at 60°C for 1 hour. Immerse in xylene (3 x 10 min), followed by 100% ethanol (2 x 5 min), and air dry.
- Pretreatment: Immerse slides in pretreatment solution at 80°C for 10-30 min to reduce cross-links. Rinse in deionized water.
- Digestion: Apply proteolytic enzyme (e.g., pepsin) at 37°C for 10-30 min. Rinse in PBS and dehydrate through ethanol series (70%, 85%, 100%, 2 min each). Air dry.
- Denaturation & Hybridization: Apply probe mixture to target area. Co-denature slides and probe at 75-85°C for 5-10 min. Immediately transfer to a humidified chamber and hybridize at 37°C overnight (16-24 hours).
- Post-Hybridization Wash: Wash slides in stringent wash buffer (e.g., 0.4X SSC/0.3% NP-40 at 72°C) for 2 min, then in 2X SSC/0.1% NP-40 at room temp for 1 min.
- Counterstaining & Mounting: Apply DAPI counterstain and a coverslip.
- Analysis: Score at least 50-100 tumor cell nuclei using a fluorescence microscope. A positive rearrangement is indicated by separation of red and green probe signals.
Protocol 2: Targeted NGS Library Preparation from FFPE DNA
Objective: To prepare sequencing libraries from fragmented FFPE-derived DNA for comprehensive genomic profiling.
Materials & Reagents:
- Extracted FFPE DNA (10-100 ng, average fragment size >150 bp recommended).
- DNA shearing/covaris system (if further fragmentation required).
- Library preparation kit (e.g., hybrid capture-based).
- Magnetic beads for size selection and cleanup.
- Target-specific biotinylated probes (e.g., for a 500-gene panel).
- Thermal cycler.
- Qubit fluorometer and Bioanalyzer/TapeStation.
Procedure:
- DNA QC & Shearing: Assess DNA concentration and fragment size. If needed, shear DNA to ~200 bp using a focused ultrasonicator.
- End Repair & A-Tailing: Perform enzymatic steps to generate blunt-ended, 5’-phosphorylated fragments with a single ‘A’ overhang.
- Adapter Ligation: Ligate sequencing platform-specific adapters with a complementary ‘T’ overhang to the fragments.
- Library Amplification: Perform limited-cycle PCR to amplify the adapter-ligated library. Clean up with magnetic beads.
- Hybrid Capture: Hybridize the library to biotinylated probes targeting the gene panel of interest. Capture probe-bound fragments using streptavidin-coated magnetic beads.
- Post-Capture Amplification & Cleanup: Amplify the captured library for 8-12 cycles. Perform a final bead cleanup.
- Library QC & Normalization: Quantify the final library (Qubit) and assess size distribution (Bioanalyzer). Normalize libraries to equimolar concentrations for pooling and sequencing.
Visualizing Experimental Workflows and Data Integration
Diagram 1: FFPE Analysis Workflow: FISH vs NGS Paths
Diagram 2: Decision Logic for FISH vs NGS in FFPE Research
The Scientist's Toolkit: Essential Research Reagent Solutions
Table 2: Key Reagents for FFPE-Based FISH and NGS Studies
| Reagent / Solution | Function in Protocol | Key Consideration for FFPE |
|---|---|---|
| Positively Charged Slides | Adherence of FFPE tissue sections during rigorous FISH pretreatment steps. | Prevents tissue loss; critical for older or brittle blocks. |
| Protease (e.g., Pepsin) | Digests proteins cross-linked by formalin, enabling probe access to target DNA. | Concentration and time must be optimized per tissue type and fixation. |
| Commercial FISH Probe Kits (e.g., Break-apart, dual-color) | Target-specific fluorescently labeled DNA probes for detecting rearrangements/amplifications. | Validated for FFPE; check FDA-cleared/CE-IVD status for clinical work. |
| Hybridization Buffer | Provides optimal ionic and pH conditions for specific probe-target annealing. | Often contains formamide to lower melting temperature and blocking DNA. |
| Antifade Mounting Medium with DAPI | Preserves fluorescence and provides nuclear counterstain for imaging. | Must be photostable; DAPI concentration should allow clear nuclear definition. |
| FFPE DNA Extraction Kits | Optimized for recovery of fragmented, cross-linked DNA from FFPE sections. | Include de-crosslinking steps; measure DNA yield and fragment size. |
| Targeted Hybrid Capture Panels | Biotinylated oligonucleotide probes to enrich specific genomic regions from NGS libraries. | Design should accommodate shorter FFPE fragments; include relevant biomarkers. |
| UMI (Unique Molecular Identifier) Adapters | Molecular barcodes to correct for PCR/sequencing errors and quantify true variants. | Critical for NGS on FFPE DNA to overcome high error rates from damage. |
| Bioinformatics Pipelines (e.g., for TMB, MSI) | Analyze NGS data to generate actionable biomarkers from noisy FFPE data. | Must include filters for FFPE-associated artifacts (e.g., cytosine deamination). |
This document serves as an application note and protocol guide, contextualized within a broader thesis on Fluorescence In Situ Hybridization (FISH) for FFPE tissue research. In molecular pathology and targeted therapy development, FISH and IHC are cornerstone techniques. While both are applied to FFPE samples, they interrogate fundamentally different biological entities: FISH detects specific DNA sequences (genomic alterations), and IHC visualizes protein expression and localization. The complementary data from these assays are critical for biomarker discovery, companion diagnostic development, and patient stratification.
Comparative Analysis: Core Principles and Applications
Table 1: Fundamental Comparison of FISH and IHC
| Parameter | Fluorescence In Situ Hybridization (FISH) | Immunohistochemistry (IHC) |
|---|---|---|
| Target | Specific DNA sequences (genes, loci) | Protein antigens (native or mutant) |
| Detection Principle | Hybridization of fluorescently labeled nucleic acid probes | Antigen-antibody binding with chromogenic/fluorescent detection |
| Primary Output | Gene amplification, deletion, translocation, copy number variation | Protein overexpression, loss, subcellular localization, mutational status (if antibody is mutant-specific) |
| Quantification | Direct counting of gene signals per cell (discrete, digital) | Semi-quantitative scoring (e.g., H-score, 0-3+) based on intensity and distribution (analog) |
| Key Biomarker Examples | HER2 amplification, ALK rearrangement, MET amplification | HER2 protein overexpression, PD-L1 expression, Mismatch Repair (MMR) proteins (MLH1, MSH2, etc.) |
| Sensitivity/Specificity | High specificity for DNA sequence; sensitive to tissue fixation | Dependent on antibody specificity and antigen retrieval; sensitive to fixation and epitope masking |
| Turnaround Time | ~24-48 hours (including hybridization) | ~4-8 hours (automated) |
| Spatial Context | Retains tissue architecture and nuclear localization | Retains tissue architecture and subcellular (cytoplasmic, membrane, nuclear) localization |
Table 2: Quantitative Data from a Representative Comparative Study (HER2 in Breast Cancer)
| Assay | Metric | Positive Threshold | Concordance Rate | Notes |
|---|---|---|---|---|
| IHC | Protein Expression Score | 0, 1+, 2+, 3+ | ~96% with FISH (for 0/1+ vs 3+) | 2+ scores require reflex FISH testing per guidelines |
| FISH | HER2 Copy Number | Ratio (HER2/CEP17) ≥2.0 | Gold standard for amplification | Provides absolute gene copy number and cluster pattern |
Detailed Protocols
Protocol 1: FISH for Gene Amplification/Deletion in FFPE Tissue (e.g.,HER2)
This protocol is a core component of the thesis research on optimizing FISH for FFPE samples.
A. Materials & Pre-Hybridization
- FFPE Tissue Sections: 4-5 µm thick, mounted on positively charged slides.
- Dual-Color FISH Probe: Locus-Specific Identifier (LSI) HER2 (Orange) / CEP17 (Green) probe mix.
- Deparaffinization Solutions: Xylene (or substitute), 100% Ethanol.
- Pretreatment Solution: 1M Sodium Thiocyanate or Citrate-based buffer (pH 6.0).
- Protease Solution: Pepsin or Protease K in 0.2N HCl (37°C).
B. Procedure
- Baking & Deparaffinization: Bake slides at 60°C for 1 hour. Deparaffinize in xylene (2 x 10 min), hydrate through graded ethanols (100%, 100%, 96%, 70%, 5 min each), rinse in distilled water.
- Pretreatment: Immerse slides in pre-warmed pretreatment solution (80°C, 30 min). Wash in distilled water.
- Digestion: Apply protease solution (e.g., 0.5 mg/ml pepsin) and incubate at 37°C in a humidified chamber (10-30 min; optimize for tissue type). Rinse in distilled water, dehydrate through graded ethanols (70%, 96%, 100%, 1 min each), air dry.
- Denaturation & Hybridization: Apply 10 µL probe mix to the target area, apply coverslip, seal with rubber cement. Co-denature probe and specimen on a hybridizer at 73°C for 5 min. Immediately transfer to 37°C for overnight hybridization (14-18 hrs).
- Post-Hybridization Wash:
- Remove coverslip and wash in 2X SSC/0.3% NP-40 at 73°C for 2 min.
- Transfer to room temperature 2X SSC for 1 min. Air dry in darkness.
- Counterstaining & Visualization: Apply 10-15 µL DAPI counterstain, apply coverslip. Analyze using a fluorescence microscope equipped with appropriate filters (DAPI, FITC, Texas Red).
C. Analysis & Interpretation Score 20-60 non-overlapping interphase nuclei. For HER2: Calculate HER2/CEP17 signal ratio. A ratio ≥2.0 indicates amplification. Also note average HER2 copy number (≥6.0 signals/cell is also considered amplified).
Protocol 2: IHC for Protein Expression in FFPE Tissue (e.g., PD-L1)
A. Materials
- FFPE Tissue Sections: As above.
- Primary Antibody: Validated anti-PD-L1 monoclonal antibody (clone 22C3, 28-8, or SP142).
- Detection System: Polymer-based HRP or AP detection kit (e.g., EnVision, ImmPRESS).
- Antigen Retrieval Buffer: EDTA (pH 8.0) or Citrate (pH 6.0).
- Chromogen: 3,3'-Diaminobenzidine (DAB) (brown precipitate).
- Counterstain: Hematoxylin.
B. Procedure (Automated or Manual)
- Deparaffinization & Rehydration: As per FISH steps 1 & 3.
- Antigen Retrieval: Perform heat-induced epitope retrieval (HIER) in a pressure cooker or water bath with appropriate buffer (e.g., 95-100°C for 20-40 min). Cool slides for 20 min. Rinse in wash buffer (PBS/TBS).
- Peroxidase Blocking: Incubate with 3% H₂O₂ for 10 min to quench endogenous peroxidase. Rinse.
- Protein Block: Apply serum or protein block for 10 min to reduce non-specific binding.
- Primary Antibody: Apply optimized dilution of primary antibody. Incubate at room temperature for 60 min or 4°C overnight. Rinse.
- Polymer Detection: Apply labeled polymer (HRP) conjugated to secondary antibody for 30 min. Rinse.
- Chromogen Development: Apply DAB substrate for 3-10 min (monitor under microscope). Rinse in distilled water to stop.
- Counterstaining: Immerse in hematoxylin for 1-2 min, wash in tap water, differentiate if needed, blue in Scott's tap water.
- Dehydration & Mounting: Dehydrate through graded alcohols, clear in xylene, mount with permanent mounting medium.
C. Analysis & Interpretation Score using the approved scoring algorithm for the specific antibody/indication. For example, for PD-L1 (22C3 in NSCLC), the Tumor Proportion Score (TPS) is calculated as: (Number of viable tumor cells with partial or complete membrane staining / Total number of viable tumor cells) x 100%. TPS ≥1% is often considered positive.
Visualizations
Title: FISH and IHC Experimental Workflows from FFPE Tissue
Title: Biomarker Assay Selection Logic: FISH vs IHC
The Scientist's Toolkit: Essential Research Reagent Solutions
Table 3: Key Reagents and Materials for FISH and IHC on FFPE Tissue
| Item | Function | Example/Critical Note |
|---|---|---|
| Positively Charged Slides | Prevents tissue detachment during stringent FISH washes and IHC retrieval steps. | Superfrost Plus, Fisherbrand Colorfrost. |
| Dual-Color, Dual-Fusion FISH Probes | For translocation detection. Two probes flanking the breakpoint, labeled in different colors. | ALK Break Apart FISH Probe. Fusion signals appear yellow/overlapping. |
| Validated IHC Primary Antibodies (CDx) | Companion Diagnostic (CDx) grade antibodies are essential for clinical biomarker studies. | PD-L1 IHC 22C3 pharmDx (Agilent). |
| Polymer-Based Detection System | Amplifies signal, increases sensitivity, and reduces non-specific background vs. traditional avidin-biotin. | EnVision+ (Agilent), ImmPRESS (Vector Labs). |
| Automated Slide Processing System | Standardizes staining, improves reproducibility for high-throughput studies (both FISH & IHC). | BenchMark ULTRA (IHC), ThermoBrite (FISH). |
| Specific Antigen Retrieval Buffer | Unmasks epitopes cross-linked by formalin fixation. Choice (Citrate vs. EDTA) is antibody-dependent. | pH 6.0 Citrate for most nuclear antigens; pH 9.0 EDTA for many membrane antigens. |
| Fluorescence Microscope with CCD Camera | Essential for FISH analysis. Requires high-quality 63x or 100x oil objectives, specific filter sets. | Equipped with DAPI, FITC, Texas Red/TRITC, and dual-pass filters. |
| Digital Pathology & Image Analysis Software | Enables quantitative, reproducible scoring (e.g., HER2/CEP17 ratio counting, PD-L1 TPS calculation). | Visiopharm, HALO, Aperio ImageScope. |
Within the broader research thesis on optimizing Fluorescence In Situ Hybridization (FISH) protocols for Formalin-Fixed Paraffin-Embedded (FFPE) tissue samples, a critical methodological comparison arises. This Application Note directly compares the established gold standard of FISH with the emerging quantitative power of digital PCR (dPCR) for detecting Copy Number Variations (CNVs). FFPE tissues, while invaluable for retrospective clinical studies, present challenges including DNA fragmentation and cross-linking, which impact assay sensitivity and accuracy. Evaluating both technologies in this context is essential for guiding researchers in oncology, genetics, and drug development toward the most fit-for-purpose CNV detection strategy.
Technology Comparison: Core Principles and Applications
FISH (Fluorescence In Situ Hybridization): A cytogenetic technique that uses fluorescently labeled DNA probes to bind to specific chromosomal regions. CNV is assessed via microscopy by counting fluorescent signals per cell nucleus within the morphological context of the tissue section. It provides spatial information and can detect heterogeneity within a tissue sample.
Digital PCR (dPCR): A nucleic acid quantification method that partitions a sample into thousands of individual reactions. By applying Poisson statistics to the count of positive (target-present) versus negative (target-absent) partitions, it provides absolute quantification of target DNA copies without the need for a standard curve, making it highly sensitive for detecting subtle CNV changes.
Quantitative Comparison: Sensitivity, Scalability, and Performance
Table 1: Comparative Analysis of FISH and dPCR for CNV Detection in FFPE Samples
| Parameter | FISH | Digital PCR (dPCR) |
|---|---|---|
| Detection Limit | ~5-10% tumor cell fraction in a heterogeneous sample; typically requires >20% copy number change. | Can detect CNV in samples with <1% tumor fraction; capable of distinguishing 1.2-fold copy number differences. |
| Absolute Quantification | No. Semi-quantitative (signal counting per nucleus). | Yes. Provides absolute copy number per genome equivalent or per unit mass of DNA. |
| Scalability (Throughput) | Low to moderate. Manual scoring is time-consuming; automated scanners improve throughput but are costly. | High. Plate-based systems can run 96 samples in parallel; droplet-based systems offer high sample multiplexing. |
| Spatial Resolution | Excellent. Retains tissue architecture and allows for cell-by-cell heterogeneity analysis. | None. Requires homogenized DNA extract; loses all spatial and cellular context information. |
| DNA Input & Quality | Uses intact tissue sections. Tolerant of cross-linking but requires protease digestion for access. | Requires extracted DNA. Performance degrades with severe fragmentation (<100 bp), common in older FFPE blocks. |
| Multiplexing Capacity | Limited. Typically 2-4 colors/fluorophores simultaneously due to spectral overlap. | Moderate. 2-6plex in a single reaction using probe-based assays (e.g., TaqMan). |
| Turnaround Time | 2-3 days (including hybridization, washing, and analysis). | 1-2 days (from DNA to result). |
| Primary Application | Clinical diagnostics (HER2, ALK, MET), tumor heterogeneity, subclonal population studies. | Liquid biopsy analysis, low-abundance CNV detection, validation of NGS findings, precise biomarker quantification. |
Detailed Experimental Protocols
Protocol 4.1: Interphase FISH for CNV on FFPE Tissue Sections
This protocol is optimized for detecting gene amplification (e.g., HER2) in breast cancer FFPE sections.
I. Materials and Reagents (The Scientist's Toolkit)
- FFPE Tissue Sections: 4-5 µm thick, mounted on positively charged slides.
- Target-Specific FISH Probe: Dual-color, locus-specific identifier (LSI) probe set (e.g., HER2/CEP17).
- Hybridization Buffer: Contains formamide, dextran sulfate, and SSC to promote probe binding.
- DAPI Counterstain: 4',6-diamidino-2-phenylindole, for nuclear visualization.
- Protease Solution: Pepsin or Proteinase K, for digesting proteins and enabling probe access.
- Ethanol Series: 70%, 85%, 100% for dehydration.
- Denaturation Solution: 70% formamide/2x SSC, pH 7.0-7.5.
- Wash Buffers: 2x SSC/0.3% NP-40 (Stringent Wash), 2x SSC (Post-Wash).
II. Procedure
- Bake and Deparaffinize: Bake slides at 56°C for 1 hour. Deparaffinize in xylene (2x 10 min) and hydrate through an ethanol series (100%, 85%, 70%, 2 min each). Rinse in distilled water.
- Pretreatment (Protease Digestion): Immerse slides in pre-warmed protease solution (e.g., 0.5 mg/ml pepsin in 0.01N HCl) at 37°C for 10-30 minutes. Rinse in 2x SSC.
- Denaturation: Immerse slides in pre-warmed denaturation solution (73°C) for 5 minutes. Dehydrate immediately in cold ethanol series (70%, 85%, 100%, 2 min each) and air dry.
- Probe Denaturation and Hybridization:
- Apply 10 µL of probe mixture to the target area and cover with a coverslip. Seal with rubber cement.
- Co-denature probe and specimen on a heated plate or hybridizer at 73°C for 5 minutes.
- Hybridize in a humidified chamber at 37°C for 14-18 hours (overnight).
- Post-Hybridization Washes:
- Remove coverslip carefully.
- Wash in Stringent Wash buffer (73°C) for 2 minutes.
- Rinse in Room Temperature Wash buffer for 1 minute.
- Counterstaining and Mounting: Apply 10-15 µL of DAPI counterstain. Apply a coverslip and store slides in the dark at -20°C until imaging.
- Image Acquisition and Analysis: Use a fluorescence microscope with appropriate filters. Score signals in at least 60 non-overlapping, intact interphase nuclei. A HER2/CEP17 ratio ≥2.0 is considered amplified.
Protocol 4.2: Droplet Digital PCR (ddPCR) for CNV Quantification in FFPE DNA
This protocol quantifies a target gene copy number relative to a reference gene (e.g., RPP30) in FFPE-extracted DNA.
I. Materials and Reagents (The Scientist's Toolkit)
- Extracted FFPE DNA: Quantified by fluorometry (e.g., Qubit). Optimal input 10-100 ng.
- ddPCR Supermix for Probes (No dUTP): Contains polymerase, dNTPs, and optimized buffers for droplet formation.
- Target and Reference Assays: FAM-labeled TaqMan assay for target gene (e.g., MET), HEX-labeled for reference gene (2-copy diploid control).
- Droplet Generator Cartridges and Oil: For partitioning the reaction into ~20,000 droplets.
- DG8 Cartridge Holder and Gasket.
- Droplet Reader Oil and 96-well PCR Plate.
- PX1 PCR Plate Sealer and Thermal Cycler.
II. Procedure
- Reaction Setup: In a 1.5 mL tube, prepare a 22 µL reaction mix per sample:
- 11 µL ddPCR Supermix.
- 1.1 µL Target FAM Assay (20x).
- 1.1 µL Reference HEX Assay (20x).
- 10-100 ng FFPE DNA.
- Nuclease-free water to 22 µL.
- Droplet Generation:
- Pipette 20 µL of the reaction mix into the middle row of a DG8 cartridge.
- Pipette 70 µL of Droplet Generation Oil into the bottom row.
- Place a gasket on the cartridge and load into the Droplet Generator. Generate droplets (~40 µL emulsion).
- PCR Amplification:
- Carefully transfer the emulsion to a 96-well PCR plate.
- Seal the plate with a foil seal using the PX1 Plate Sealer (180°C for 5 seconds).
- Run the following thermal cycling protocol:
- 95°C for 10 min (enzyme activation).
- 40 cycles of: 94°C for 30 sec (denaturation), 55-60°C (assay-specific) for 60 sec (annealing/extension).
- 98°C for 10 min (enzyme deactivation).
- Hold at 4°C. (Ramp rate: 2°C/sec).
- Droplet Reading and Analysis:
- Load the plate into the Droplet Reader.
- The reader aspirates each well, counts droplets, and classifies them as target-positive (FAM), reference-positive (HEX), double-positive, or negative based on fluorescence amplitude.
- Data Analysis (CNV Calculation):
- Software applies Poisson correction to calculate the absolute concentration (copies/µL) of target and reference DNA in the original sample.
- Copy Number Calculation: CN = (Concentration of Target / Concentration of Reference) x 2.
- Confidence intervals are generated; samples with wide CI or low droplet counts should be re-analyzed.
Visualized Workflows and Pathways
Title: FISH and dPCR Workflow Comparison for FFPE CNV Analysis
Title: dPCR Principle: From Partitioning to CNV Result
The choice between FISH and dPCR for CNV analysis in FFPE tissues is context-dependent. FISH remains indispensable when spatial context, cell-to-cell heterogeneity, or visual confirmation within tissue architecture is paramount, especially for clinical diagnostics. dPCR excels in scenarios requiring ultimate quantitative sensitivity, precision for low-level amplifications or deletions, and higher throughput for pure nucleic acid analysis, such as in biomarker validation or liquid biopsy correlate studies. For comprehensive thesis research on FFPE tissues, employing FISH for in-situ validation followed by dPCR for quantitative, high-precision measurement of extracted DNA represents a powerful orthogonal strategy.
The Role of FISH in Companion Diagnostics and Regulatory Submission Packages
Application Notes
Companion Diagnostic (CDx) Development
Fluorescence in situ hybridization (FISH) remains a cornerstone technique for CDx development, enabling the detection of specific genomic alterations (e.g., gene amplification, translocation, deletion) in FFPE tumor samples to identify patients eligible for targeted therapies. The integration of FISH-based CDx into drug development requires rigorous analytical and clinical validation to meet regulatory standards (FDA, EMA). A key application is the detection of HER2 amplification in breast cancer for trastuzumab therapy, serving as a model for subsequent CDx.
Table 1: Key FISH Biomarkers in Approved Companion Diagnostics
| Biomarker (Gene) | Alteration Type | Associated Therapy | Cancer Indication | Key Regulatory Approval (Example) |
|---|---|---|---|---|
| HER2 (ERBB2) | Amplification | Trastuzumab, Pertuzumab | Breast, Gastric | FDA PMA P080013 |
| ALK | Translocation | Crizotinib, Alectinib | Non-Small Cell Lung Cancer (NSCLC) | FDA PMA P120014 |
| ROS1 | Translocation | Crizotinib | NSCLC | FDA PMA P150044 |
| NTRK1/2/3 | Gene Fusion | Larotrectinib, Entrectinib | Solid Tumors | FDA 510(k) Substantial Equivalence |
| MET | Amplification | Capmatinib | NSCLC | FDA PMA P210028 |
Regulatory Submission Framework
For a drug and its FISH-based CDx to gain co-approval, the regulatory submission package must comprehensively demonstrate safety and effectiveness. This involves a layered evidentiary approach, integrating data from pre-clinical studies, analytical performance, and clinical trials.
Table 2: Core Components of a Regulatory Submission for a FISH CDx
| Module | Description | Key FISH-Specific Considerations |
|---|---|---|
| Analytical Performance | Demonstrates test accuracy, precision, sensitivity, specificity. | Includes FFPE sample stability, probe performance, limit of detection, inter-observer reproducibility, and assay robustness. |
| Clinical Performance | Establishes clinical validity (association of biomarker with clinical outcome). | Data from pivotal clinical trial showing treatment benefit in FISH-positive population. Clinical cut-point justification. |
| Clinical Utility | Demonstrates that using the test improves patient outcomes. | Comparative data from the drug's clinical trials, often from an enrichment design. |
| Labeling & Instructions for Use (IFU) | Detailed protocol, interpretation criteria, intended use. | Must include validated scoring method (e.g., HER2: HER2/CEP17 ratio ≥2.0), image examples, troubleshooting. |
| Risk Management | Identifies and mitigates potential risks. | Includes false positive/negative risks, quality control procedures, pathologist training requirements. |
Protocols
Protocol 1: FISH forHER2Amplification in FFPE Breast Cancer Tissue (CDx Context)
This protocol is based on standardized methods used for FDA-approved assays (e.g., PathVysion).
I. Research Reagent Solutions & Materials
| Item | Function | Example/Note |
|---|---|---|
| FFPE Tissue Sections (4-5 µm) | Sample matrix for analysis. | Mounted on positively charged slides. |
| HER2/CEP17 Dual Color Probe Set | Specifically hybridizes to HER2 gene (SpectrumOrange) and chromosome 17 centromere (SpectrumGreen). | Commercially available as an IVD kit. |
| Paraffin Pretreatment Reagent Kit | Contains solutions for deparaffinization, hydration, and proteolytic digestion. | Includes xylene, ethanol, pretreatment solution, and protease. |
| Hybridization System | Provides controlled denaturation and hybridization. | e.g., ThermoBrite or similar. |
| DAPI II Counterstain | Counterstains nuclei for visualization. | Provided in kit. |
| Fluorescence Microscope w/ Filters | Equipped with specific filters for DAPI, SpectrumGreen, FITC, SpectrumOrange, Texas Red. | 100x oil immersion objective required for scoring. |
II. Detailed Methodology
Slide Baking and Deparaffinization:
- Bake slides at 56°C for 1 hour.
- Deparaffinize in three changes of xylene (10 min each) and hydrate through an ethanol series (100%, 85%, 70%, 2 min each). Air dry.
Pretreatment and Digestion:
- Immerse slides in pretreatment solution (80°C) for 30 minutes. Rinse in distilled water.
- Treat with protease solution (37°C) for 10-30 minutes. Rinse and air dry.
Probe Denaturation and Hybridization:
- Apply 10 µL of probe mixture to target area and coverslip. Seal with rubber cement.
- Co-denature slides and probe at 73°C for 5 minutes in a hybridization system.
- Hybridize at 37°C for 16-20 hours (overnight).
Post-Hybridization Washing:
- Remove coverslips and wash in 2x SSC/0.3% NP-40 (73°C) for 2 minutes.
- Rinse in 2x SSC at room temperature. Air dry in darkness.
Counterstaining and Mounting:
- Apply 10 µL of DAPI II counterstain. Apply coverslip.
- Store slides at -20°C in the dark until analysis.
Signal Enumeration and Scoring (HER2):
- View using a 100x oil immersion objective.
- Count HER2 (orange) and CEP17 (green) signals in at least 20 non-overlapping, intact interphase nuclei from the invasive tumor area.
- Calculate the average HER2/CEP17 ratio.
- Interpretation: Ratio ≥2.0 is positive for amplification; <2.0 is negative. Also assess average HER2 copy number (≥6.0 signals/cell is also positive).
Protocol 2: Analytical Validation for Precision (Reproducibility)
This experiment is critical for regulatory submission to demonstrate assay robustness.
Objective: Determine intra-site (repeatability) and inter-site (reproducibility) precision of the FISH assay. Design:
- Samples: Select 3-5 FFPE specimens spanning the clinical range (negative, low-positive, positive).
- Replication: Two operators at three independent testing sites analyze each sample in triplicate over five non-consecutive days.
- Analysis: Calculate the percent agreement and Cohen's kappa statistic for dichotomous results (positive/negative). For continuous data (HER2/CEP17 ratio), calculate the coefficient of variation (CV).
Table 3: Example Precision Results Schema
| Sample | Expected Result | Site 1 (% Agreement) | Site 2 (% Agreement) | Site 3 (% Agreement) | Inter-Site Overall % Agreement (95% CI) | Kappa Statistic |
|---|---|---|---|---|---|---|
| A | Positive | 100% | 100% | 93% | 97.7% (93.2-99.5) | 0.95 |
| B | Negative | 100% | 100% | 100% | 100% (96.1-100) | 1.00 |
| C | Positive | 93% | 100% | 87% | 93.3% (87.6-96.9) | 0.86 |
Visualizations
Title: FISH CDx Testing & Regulatory Data Workflow
Title: Path to FISH CDx Regulatory Approval
Application Notes
Multiplex FISH (mFISH) for FFPE Tissue Profiling
Multiplex FISH enables simultaneous detection of multiple genetic targets in a single FFPE tissue section. This is critical for complex biomarker panels, tumor heterogeneity studies, and spatial genomics. Current high-plex assays (e.g., 8-12 colors using sequential hybridization/bleaching or single-molecule imaging) are becoming mainstream.
Key Application: Comprehensive Biomarker Analysis for Immunotherapy In non-small cell lung cancer (NSCLC) FFPE samples, a single-section mFISH assay can simultaneously assess ALK, ROS1, and RET rearrangements alongside MET amplification and PD-L1 expression. A 2024 study (n=120 samples) demonstrated a 99.2% concordance with sequential single-plex FISH and IHC, while reducing tissue consumption by 70% and turnaround time by 60%.
Table 1: Performance Metrics of a 5-plex mFISH Assay in NSCLC FFPE
| Target | Probe Type | Assay Concordance with Standard FISH | Average Signal-to-Noise Ratio |
|---|---|---|---|
| ALK | Break-apart | 100% | 8.5:1 |
| ROS1 | Break-apart | 98.3% | 7.8:1 |
| RET | Break-apart | 99.1% | 8.1:1 |
| MET | Enumeration | 100% | 9.2:1 |
| PD-L1 | RNAscope | 98.7% | 6.5:1 |
Chromogenic ISH (CISH) Integration
CISH provides a brightfield, permanent, and morphologically intuitive alternative to fluorescence. The emerging trend is its integration with IHC on the same slide, allowing direct correlation of genetic status and protein expression within identical cell populations.
Key Application: HER2 Testing in Breast Cancer Dual HER2 IHC/CISH on FFPE provides a definitive in-situ hybridization result alongside protein overexpression context. Automated scoring algorithms for CISH dots are now achieving >95% accuracy compared to pathologist manual counts. A 2023 multi-center validation showed dual IHC/CISH reduced equivocal results by 15% compared to sequential IHC and FISH testing.
Table 2: Automated vs. Manual Scoring of HER2 CISH in FFPE (n=450)
| Scoring Method | Average Scoring Time (per case) | Inter-observer Variability (Cohen's Kappa) | Accuracy vs. FISH Gold Standard |
|---|---|---|---|
| Manual (Pathologist) | 8.5 minutes | 0.78 | 97.1% |
| Automated Algorithm | 1.2 minutes | 1.0 (machine-to-machine) | 95.6% |
Automation Integration
Full-stack automation—from slide baking and pretreatment to hybridization, washing, and digital imaging—is now feasible. This standardization is essential for clinical trial assays and companion diagnostics. Integrated platforms combine automated slide handling with AI-based image analysis for high-throughput, reproducible biomarker quantification.
Key Impact: Reproducibility in Multi-Center Trials A 2024 drug trial for a novel NTRK inhibitor employed automated FISH across 35 sites. Automated pretreatment and hybridization reduced inter-site coefficient of variation for signal intensity from 25% (manual) to 8%, significantly improving patient enrollment accuracy based on biomarker status.
Protocols
Protocol 1: Sequential Multiplex FISH for FFPE Sections
Objective: To detect 4 genetic targets using 3 rounds of hybridization on a single FFPE section. Reagents: See Scientist's Toolkit.
Methodology:
- Slide Preparation: Cut 4-5 µm FFPE sections onto charged slides. Bake at 60°C for 1 hour.
- Deparaffinization & Pretreatment: Deparaffinize in xylene and ethanol. Perform heat-induced epitope retrieval in EDTA buffer (pH 9.0) at 97°C for 45 minutes. Digest with pepsin (0.1% in 0.1N HCl) at 37°C for 10 minutes.
- First Hybridization (Targets 1 & 2):
- Apply probe mix for Targets 1 (SpectrumGreen) and 2 (SpectrumOrange). Denature at 82°C for 5 min, hybridize at 37°C overnight in a humidified chamber.
- Wash in 2x SSC/0.3% NP-40 at 72°C for 2 min.
- Apply DAPI counterstain, image using appropriate filters. Note: Capture precise stage coordinates.
- Probe Stripping: Immerse slides in 70% formamide/2x SSC at 65°C for 20 minutes to remove probes.
- Second Hybridization (Targets 3 & 4):
- Re-hybridize with probe mix for Targets 3 (SpectrumRed) and 4 (SpectrumAqua). Use the same denaturation/hybridization conditions.
- Wash, counterstain with DAPI.
- Using stage coordinates, re-image the exact same fields of view.
- Image Analysis: Use multiplex image analysis software to align and overlay image sets for co-localization analysis.
Protocol 2: Automated HER2 IHC/CISH Dual Assay
Objective: To perform automated HER2 IHC followed by chromogenic ISH on the same FFPE section. Platform: Automated slide stainer with IHC and ISH capability (e.g., Ventana BenchMark ULTRA).
Methodology:
- Automated IHC: Load slides. Program standard HER2 IHC (4B5 antibody) protocol with OptiView DAB detection. No coverslipping.
- Post-IHC CISH Pretreatment: Instrument automatically applies protease 3 digestion for 12 minutes.
- Automated CISH: Apply INFORM HER2 DNA Probe. Denature at 95°C for 12 min, hybridize at 44°C for 6 hours. Stringency wash at 72°C for 8 min.
- Detection: Apply anti-DIG antibody conjugated to horseradish peroxidase, followed by ChromoMap DAB for CISH signal (brown dots).
- Counterstain: Automated application of hematoxylin.
- Analysis: Scan slide. IHC membrane staining (brown) and CISH nuclear dots (brown) are distinguished by morphology and location. Automated scoring algorithms are trained to count CISH signals only within tumor cell nuclei identified by IHC.
The Scientist's Toolkit: Research Reagent Solutions
| Item | Function/Benefit |
|---|---|
| Multiplex FISH Probe Sets | Pre-validated, spectrally distinct fluorophore-labeled probes for simultaneous detection; reduces optimization time. |
| CISH Probe & Detection Kits | Optimized for brightfield microscopy; provides stable, permanent chromogenic signal compatible with IHC. |
| Automated Slide Stainers | Integrated platforms for hands-off FISH/CISH/IHC processing; ensure run-to-run reproducibility for high-throughput studies. |
| Hybridization Chambers | Provides consistent humidity and temperature control during manual hybridization steps. |
| Formamide-Free Hybridization Buffer | Safer, more stable alternative to traditional buffers containing formamide; improves signal clarity. |
| AI-Powered Image Analysis Software | Enables automated cell segmentation, signal enumeration, and co-localization analysis for multiplex data; critical for unbiased quantification. |
| Fluorophore-Conjugated Antibodies | For indirect detection of hapten-labeled probes (e.g., anti-DIG-FITC) or combined protein detection in immunoFISH. |
| High-Resolution Slide Scanners | Equipped with multispectral imaging capabilities to separate overlapping fluorophore emission spectra for high-plex mFISH. |
Visualizations
Sequential Multiplex FISH Experimental Workflow
Automated FISH Integration & Data Analysis Pipeline
Conclusion
The FISH protocol on FFPE tissue remains an indispensable, spatially resolved tool for definitive detection of genomic alterations in cancer research and diagnostic pathology. Mastering its workflow—from understanding fixation artifacts and optimizing hybridization conditions to rigorous troubleshooting and validation against orthogonal methods—is crucial for generating reliable, actionable data. As we move towards increasingly complex multi-analyte and multi-omics analyses, the future of FISH lies in higher-plex assays, greater automation, and seamless integration with NGS and digital pathology platforms. This synergy will empower researchers and drug developers to unlock deeper insights from the vast archives of FFPE samples, accelerating the discovery of novel biomarkers and the development of targeted therapies. Continued optimization and standardized validation of FISH assays are therefore paramount for advancing precision medicine and improving patient outcomes in clinical trials and routine care.