Template Concentration in PCR: The Hidden Driver of Amplification Bias and How to Control It
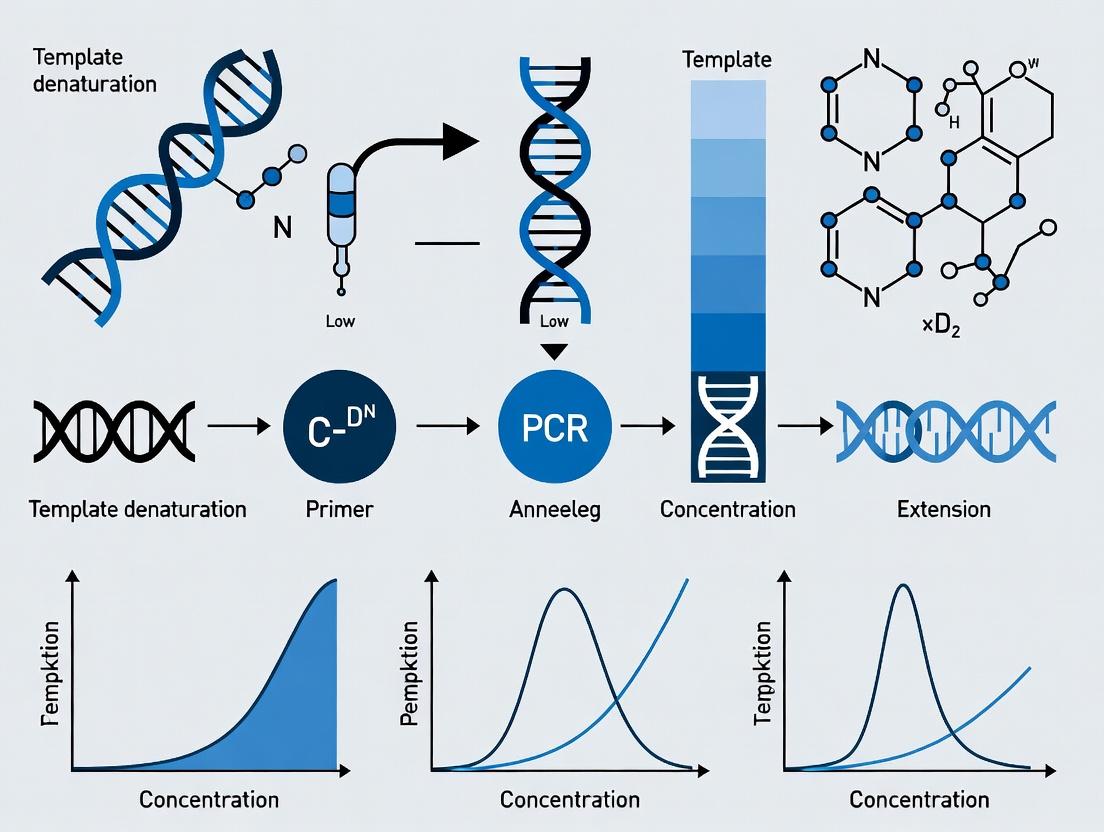
This article provides a comprehensive analysis of how initial template concentration fundamentally influences PCR amplification bias—a critical but often overlooked factor in quantitative and diagnostic applications.
Template Concentration in PCR: The Hidden Driver of Amplification Bias and How to Control It
Abstract
This article provides a comprehensive analysis of how initial template concentration fundamentally influences PCR amplification bias—a critical but often overlooked factor in quantitative and diagnostic applications. Targeting researchers, scientists, and drug development professionals, we explore the foundational principles of stochastic effects and primer-dimer competition at low concentrations. We detail methodological best practices for template titration and multiplex optimization, offer troubleshooting strategies for common bias artifacts, and review advanced validation techniques like digital PCR and NGS for bias assessment. The goal is to equip practitioners with the knowledge to design robust, reproducible PCR assays by strategically managing template input to minimize bias and ensure data fidelity.
The Science Behind the Bias: How Template Load Dictates PCR Fidelity
PCR amplification bias refers to the non-random, preferential amplification of certain template sequences over others during the Polymerase Chain Reaction. This phenomenon fundamentally compromises the accuracy of quantitative and representational analyses in techniques such as qPCR, digital PCR, amplicon sequencing, and library preparation for next-generation sequencing (NGS). This whitepaper explores the mechanistic origins of bias, its quantitative impacts, and its critical dependence on initial template concentration, as framed within the research thesis: How does template concentration influence PCR amplification bias?
Mechanisms of Amplification Bias
Bias arises from stochastic events early in amplification and from deterministic factors influencing reaction efficiency.
Primary Sources of Bias:
- Sequence-Dependent Efficiency: GC content, secondary structure, and primer-binding affinity cause variable amplification efficiencies (E) between targets. High GC content can reduce efficiency due to incomplete denaturation.
- Stochastic Sampling at Low Concentration: At low template concentrations, the random distribution of molecules into reaction partitions (or early PCR cycles) follows a Poisson distribution. This leads to significant relative variance in the amplification of different targets.
- Competition for Reagents: In later cycles, limiting reagents (dNTPs, polymerase, primers) favor amplicons with higher efficiency, exacerbating initial minor differences.
- Polymerase Errors and Chimera Formation: Errors introduced early can create novel, efficiently amplifying sequences, while chimera formation distorts community representation in microbiome studies.
The Central Role of Initial Template Concentration
The initial number of template molecules (N₀) is the pivotal variable modulating the severity and nature of bias.
Key Relationships:
- Low Template Concentration (N₀ < 100 copies/reaction): Stochastic effects dominate. The random absence of a rare template in a reaction partition is a major source of quantitation error (dropout) and over-dispersion in technical replicates. Bias is highly non-reproducible.
- High Template Concentration (N₀ > 10,000 copies/reaction): Deterministic, sequence-dependent efficiency differences dominate. Bias is more reproducible but systematically distorts relative abundances. The "winner-takes-all" dynamic in later cycles becomes more pronounced.
- Mid-Range Concentration: A complex interplay of both stochastic and deterministic factors occurs.
Table 1: Impact of Template Concentration on Bias Manifestation
| Template Concentration (copies/μL) | Dominant Bias Mechanism | Impact on Quantitation (q/dPCR) | Impact on Representation (Amplicon-Seq) |
|---|---|---|---|
| Very Low (< 10) | Stochastic Sampling, Dropout | High variance, false negatives | Severe loss of rare variants/species |
| Low (10 - 100) | Stochastic & Early Efficiency | Moderate variance, threshold effect | Skewed relative abundance, poor reproducibility |
| Moderate (100 - 10,000) | Deterministic Efficiency | Systematic error in ratios | Consistent but inaccurate community profile |
| High (> 10,000) | Reagent Competition, Plateaus | Saturation, non-linear calibration | "Over-amplification" of dominant targets |
Quantitative Impacts on Quantitation (qPCR/dPCR)
Bias directly affects the accuracy of quantification, especially in relative quantitation (e.g., gene expression) and copy number variation analysis.
Table 2: Measured Quantitation Errors from Amplification Bias
| Study (Source) | Target Difference (GC%, Length) | ΔCq or ΔEfficiency | Quantitation Error (Fold-Change) | N₀ Range Tested (copies/µL) |
|---|---|---|---|---|
| Kebschull & Zador (2015), Nat Methods | High vs. Low GC primers | ΔCq up to 4-6 cycles | 16 to 64-fold over/under-estimation | 1 - 10,000 |
| Dabney & Meyer (2012), BioTechniques | 90% vs. 50% GC content | ΔE ~ 0.3 (70% vs 100%) | > 2-fold bias | 100 - 100,000 |
| Recent dPCR Studies (2020-2023) | Minor sequence variants | Partition occupancy bias | 1.5 - 3-fold bias in variant ratio | 1 - 100 (per partition) |
Experimental Protocol: Measuring Concentration-Dependent Bias in qPCR
- Objective: Determine how initial template concentration affects the observed amplification efficiency difference between two targets (e.g., a high-GC and a low-GC amplicon).
- Materials: See "Scientist's Toolkit" below.
- Method:
- Template Series: Prepare a 7-point, 10-fold serial dilution of a genomic DNA or plasmid sample containing both target sequences. Range: 10⁶ to 10⁰ copies/µL.
- Assay Design: Design two qPCR assays (probe-based recommended) with similar amplicon lengths but divergent GC content (e.g., 40% vs. 70%).
- qPCR Run: Run all dilutions for both assays in triplicate on the same plate. Use a instrument with high temperature uniformity.
- Data Analysis:
- Generate standard curves (Cq vs. log₁₀(N₀)) for each assay.
- Calculate per-assay efficiency: E = [10^(-1/slope)] - 1.
- Plot ΔCq (CqhighGC - CqlowGC) against log₁₀(N₀).
- At low concentrations, observe increased scatter in ΔCq (stochastic variance). At high concentrations, observe a stable but non-zero ΔCq (deterministic bias).
Impacts on Representation (Amplicon Sequencing)
In microbiome, metagenomic, or targeted sequencing, bias distorts the true distribution of species or variants, making results non-comparable across studies.
Table 3: Documented Representation Bias in 16S rRNA Sequencing
| Bias Factor | Effect on Observed Community | Study Evidence |
|---|---|---|
| Primer Mismatch | Under-representation of taxa with mismatches to "universal" primers. | Brooks et al. (2015) Showed >10-fold under-counting. |
| GC Content | Under-representation of high-GC genomes after PCR. | Tanner et al. (2023) Found strong inverse correlation. |
| Amplicon Length | Shorter amplicons preferentially amplified in mixed-length PCR. | Pinto & Raskin (2012) Demonstrated length competition. |
| Initial Concentration | Rare taxa (<0.01% abundance) frequently lost at low input DNA. | Sze & Schloss (2019) Quantified stochastic dropout. |
Experimental Protocol: Assessing Bias in Amplicon Library Preparation
- Objective: Evaluate how input gDNA concentration influences the distortion of a mock microbial community profile after PCR.
- Materials: Commercial mock microbial community genomic DNA (e.g., ZymoBIOMICS D6300), 16S V4 primer set, high-fidelity polymerase.
- Method:
- Dilution Series: Dilute the mock community DNA to three concentrations: High (10 ng/µL), Medium (1 ng/µL), Low (0.1 ng/µL). The mock community has a known, fixed composition.
- PCR Amplification: Perform library prep PCR on each concentration in 8 technical replicates. Use minimal cycles (25-30).
- Sequencing: Pool, purify, and sequence amplicons on a MiSeq or similar platform (2x250 bp).
- Bioinformatic Analysis: Process reads through standard pipeline (DADA2, QIIME2). Assign ASVs/OTUs.
- Bias Quantification: Compare the observed relative abundance of each taxon to its known abundance in the mock community. Calculate Bray-Curtis dissimilarity between the observed profile and the expected profile for each input concentration.
The Scientist's Toolkit: Research Reagent Solutions
| Item / Reagent | Function / Role in Mitigating Bias |
|---|---|
| High-Fidelity Polymerase | Reduces sequence-dependent efficiency differences and minimizes error-induced chimeras. |
| PCR Additives (e.g., DMSO, Betaine) | Destabilizes secondary structure, improves amplification efficiency of high-GC targets. |
| Digital PCR (dPCR) Partitioning | Provides absolute quantification and reduces impact of efficiency differences by endpoint detection. |
| Degenerate/Permuted Primers | Broadens primer binding compatibility to reduce taxon-specific bias in amplicon sequencing. |
| PCR-Free Library Kits | Eliminates amplification bias for whole-genome sequencing applications (though lower sensitivity). |
| Spike-In Controls (Synthetic) | Adds known, non-competitive sequences to track and correct for stochastic loss and efficiency bias. |
| Duplex-Specific Nuclease | Selectively depletes abundant sequences (e.g., rRNA) to improve coverage of rare transcripts/variants. |
| Molecular Barcodes (UMIs) | Tags original molecules pre-amplification to correct for quantitative bias and identify PCR duplicates. |
Mitigation Strategies
Mitigation must be tailored to the application and considers template concentration.
- Optimize Reaction Chemistry: Use polymerase/ additive cocktails optimized for high-GC or complex templates.
- Minimize Cycle Number: Run the minimum number of PCR cycles required for detection, reducing the "rich-get-richer" effect.
- Increase Template Input: For quantitation, use higher template loads to move into the deterministic bias regime, which is more correctable.
- Employ dPCR for Low Copy Number: For absolute quantitation of rare targets, dPCR's partitioning mitigates efficiency bias.
- Use Spike-In Controls: Add known, exogenous control sequences at a similar concentration to the target to normalize for stochastic and efficiency losses.
- Adopt UMI-Based Protocols: In NGS, UMIs allow for accurate counting of original molecules, removing amplification bias from quantitative estimates.
PCR amplification bias is an inherent property of the amplification process, with its magnitude and nature intrinsically linked to the starting template concentration. At low concentrations, stochastic effects cause high variance and dropout; at high concentrations, deterministic efficiency differences cause systematic quantitative distortion. Rigorous experimental design—including optimization of input amount, use of appropriate controls and chemistries, and selection of quantification platform (qPCR vs. dPCR)—is essential for generating accurate and reproducible data. Future research outlined in the core thesis will continue to refine quantitative models that predict bias as a function of N₀, enabling more precise correction algorithms.
Within the broader thesis on How does template concentration influence PCR amplification bias research, understanding the fundamental noise at low concentrations is paramount. This whitepaper delves into the stochastic (random) processes governing early PCR cycles, which become dominant when few template molecules are present, leading to significant variation in amplification efficiency and quantitation bias.
The Stochastic Foundation of PCR
Polymerase Chain Reaction (PCR) is often treated as a deterministic exponential process. However, at low copy numbers (typically <100-1000 copies per reaction), the process is governed by Poisson statistics. The probability of any molecule being amplified in a given cycle is not unity, leading to variable cycle threshold (Ct) values and end-point concentrations.
Quantitative Data on Stochastic Variation
The following table summarizes key quantitative relationships and experimental observations of stochastic effects in low-template PCR.
Table 1: Quantitative Manifestations of Stochasticity in Low-Template PCR
| Parameter | High-Template (>1000 copies) | Low-Template (<100 copies) | Source/Experimental Observation |
|---|---|---|---|
| Ct Variance | Low (Ct SD < 0.1) | High (Ct SD can be > 1.0) | Direct measurement of replicate reactions. |
| Amplification Efficiency Distribution | Narrow, centered near theoretical max. | Broad, can range from 0% to 100% in early cycles. | Analysis of single-molecule PCR replicates. |
| Poisson Sampling Error | Negligible (e.g., √N/N is small). | Significant (e.g., for 10 copies, √10/10 = 31.6%). | Calculated based on initial copy number (N). |
| Allelic Dropout Rate (in digital PCR) | Near 0% | Can exceed 10% for heterozygotes at 1-2 copies. | Studies on genetic quantification and rare allele detection. |
| Quantitative Bias | Minimal | Substantial; underestimation of true concentration is common. | Comparison of measured mean vs. expected concentration. |
Core Experimental Protocol: Quantifying Stochastic Variation
This protocol is designed to empirically measure the stochastic limit and its impact on amplification bias.
Title: Protocol for Measuring Stochastic Amplification Noise in Low-Template PCR.
Objective: To determine the variance in Ct values and end-point fluorescence across replicates at defined low template concentrations.
Materials: See "The Scientist's Toolkit" below.
Procedure:
- Template Serial Dilution: Prepare a genomic DNA or plasmid stock of known concentration. Perform a limiting dilution in 10-fold steps down to a theoretical concentration of ~0.1 to 10 copies/µL. Use a dedicated, nucleic-acid-free workspace and aerosol-resistant tips.
- Replicate Reaction Setup: For each dilution (including a no-template control), prepare a master mix containing:
- 1X HOT FIREPol EvaGreen qPCR Mix
- 200 nM each forward and reverse primer. Aliquot the master mix into 96-well plates. To each well, add 5 µL of the corresponding template dilution, creating at least 24 technical replicates per concentration. Use meticulous pipetting technique.
- qPCR Run: Perform amplification on a real-time cycler with the following parameters:
- Activation: 95°C for 12 min.
- 50 Cycles: Denaturation at 95°C for 15 sec, Annealing/Extension at 60°C for 60 sec (with fluorescence acquisition).
- Data Analysis:
- Determine the Ct value for each replicate using a consistent threshold method (e.g., automated or manual threshold set in the exponential phase).
- Calculate the mean Ct, standard deviation (SD), and coefficient of variation (CV) for each template concentration group.
- Plot Ct variance (SD²) against the log of the theoretical starting copy number. The point where variance increases non-linearly indicates the stochastic limit.
- Perform a Poisson goodness-of-fit test on the distribution of positive amplifications (Ct < max cycle) at the lowest concentrations to confirm stochastic sampling.
Visualizing Stochastic Pathways and Workflows
The following diagrams, generated with Graphviz DOT language, illustrate the conceptual and experimental framework.
Diagram Title: Conceptual Pathway from Low Copy Number to Noisy Outcomes
Diagram Title: Experimental Workflow to Map the Stochastic Limit
The Scientist's Toolkit: Essential Research Reagents & Materials
Table 2: Key Research Reagent Solutions for Stochastic Limit Studies
| Item | Function & Rationale |
|---|---|
| Digital PCR (dPCR) System (e.g., Bio-Rad QX200, Thermo Fisher QuantStudio) | Partitions a sample into thousands of nanoreactions, enabling absolute quantification without a standard curve and directly visualizing Poisson distribution of molecules. Critical for benchmarking stochastic models. |
| Single-Tube/Low-Template qPCR Master Mix (e.g., HOT FIREPol EvaGreen, TaqMan PreAmp Master Mix) | Optimized enzyme blends with high processivity and fidelity to maximize the probability of amplifying single molecules. Includes inhibitors of polymerase-nucleic acid complex sequestration. |
| Nuclease-Free Water & Low-Bind Tubes | Essential for preparing ultra-low concentration dilutions without adsorption to tube walls or degradation, which would confound stochastic measurements. |
| Certified Nucleic Acid-Free Workspace & Aerosol-Resistant Tips | Prevents cross-contamination from high-concentration amplicons or samples, which is a critical confounding factor in low-template studies. |
| Reference Genomic DNA (e.g., NIST SRM 2372) | Provides a material of known, certified concentration for accurate preparation of serial dilutions to ground-truth experimental observations. |
Statistical Software (e.g., R with dpcr package, Poisson distribution calculators) |
Required for performing robust statistical analysis on replicate data, including Poisson goodness-of-fit tests and variance component analysis. |
This technical guide examines the primer-template binding dynamics under non-equilibrium conditions, a critical factor in understanding PCR amplification bias. Within the broader thesis on "How does template concentration influence PCR amplification bias research," this exploration provides the mechanistic foundation. Amplification bias, where some templates are preferentially amplified over others, is not solely a function of initial template concentration but is profoundly governed by the competition between primers and templates for binding sites, especially as concentrations shift during thermal cycling. This primer-template resource competition across gradients is a primary driver of biased representation in next-generation sequencing (NGS) libraries, multiplex PCR assays, and rare variant detection.
Core Principles: Kinetics and Thermodynamics of Binding
The efficiency of primer annealing is governed by the law of mass action: [Primer:Template] ∝ [Primer] × [Template]. However, in multiplex reactions or with complex genomic backgrounds, multiple primers compete for a limited polymerase enzyme and dNTP resources, and primers may compete for similar or identical template regions.
- Key Kinetic Parameter: The annealing rate constant is influenced by primer concentration, template accessibility, and sequence complementarity.
- Thermodynamic Stability: The melting temperature (Tm) dictates the binding equilibrium at a given annealing temperature. A small Tm difference across primers can lead to significant binding disparities.
- The "Winning Template" Effect: At low template concentrations, stochastic binding and extension can lead to the preferential amplification of one template over another, even with identical primer efficiencies. This is exacerbated by primer depletion.
Experimental Data & Analysis
The following tables summarize quantitative relationships derived from recent studies on primer-template dynamics.
Table 1: Impact of Primer:Template Ratio on Amplification Efficiency and Bias
| Primer:Template (Molar Ratio) | Amplification Efficiency (%) | Bias Index (High:Low Abundance Template) | Optimal Use Case |
|---|---|---|---|
| 107:1 | < 50% | > 100:1 | Cloning, SNV detection |
| 105:1 | 75-95% | 10:1 to 50:1 | Standard qPCR |
| 103:1 | > 90% | < 5:1 | Multiplex PCR (balanced targets) |
| 102:1 | Highly variable | ~1:1 (but low yield) | Not recommended |
Bias Index: Ratio of final amplicon yields starting from equimolar but distinct templates.
Table 2: Effect of Template GC% and Concentration on Observed Tm (in a standardized buffer)
| Initial Template Concentration (copies/µL) | Template GC% | Theoretical Tm (°C) | Observed Effective Tm (°C) | Notes |
|---|---|---|---|---|
| 102 | 45% | 58.5 | 56.8 ± 0.9 | High stochastic effect |
| 104 | 45% | 58.5 | 58.2 ± 0.3 | Stable measurement |
| 102 | 65% | 65.2 | 62.1 ± 1.2 | Greater destabilization at low [ ] |
| 104 | 65% | 65.2 | 64.9 ± 0.2 | Close to theoretical |
Detailed Experimental Protocols
Protocol 1: Quantifying Primer Competition Using Synthetic Spike-Ins
Objective: To measure the preferential amplification of one template over another in a multiplex setting as a function of initial concentration gradient.
Materials:
- Synthetic DNA templates A and B (with distinct primer binding sites but similar amplicon length and GC%).
- Fluorophore-labeled primers (FAM for Template A, HEX for Template B).
- High-fidelity DNA polymerase master mix.
- Real-time PCR instrument.
Methodology:
- Prepare a constant total template concentration (e.g., 104 copies/µL) but vary the ratio of Template A:Template B (e.g., 1:1, 10:1, 1:10, 100:1, 1:100).
- Use a primer mix containing forward/reverse primers for both templates at identical, limiting concentrations (e.g., 50 nM each).
- Run qPCR with fluorescence detection for both FAM and HEX channels.
- Calculate the ΔCq (Cq, Template B - Cq, Template A) for each initial ratio.
- Plot ΔCq vs. log10(Initial Ratio). The slope indicates the degree of bias (ideal slope = 1). A slope >1 indicates competitive advantage for the more abundant template.
Protocol 2: Determining EffectiveTmAcross Concentration Gradients
Objective: To empirically determine the annealing temperature robustness window for primers at different template concentrations.
Materials:
- Single-target template spanning a 102 to 106 copies/µL range.
- Standard primer set.
- Intercalating dye-based PCR master mix.
Methodology:
- Prepare template dilutions (106, 105, 104, 103, 102 copies/µL).
- Set up a gradient PCR with an annealing temperature range spanning ~10°C below to 5°C above the theoretical Tm.
- Post-PCR, run products on a high-resolution gel or capillary electrophoresis system.
- For each template concentration, identify the temperature range that produces a single, specific amplicon with >90% of maximum yield. The midpoint of this range is the effective Tm.
- Compare effective Tm across concentrations to model concentration-dependent stability.
Mandatory Visualizations
Title: PCR Amplification Bias Cycle from Primer Competition
Title: Experimental Workflow for Quantifying Amplification Bias
The Scientist's Toolkit: Research Reagent Solutions
Table 3: Essential Materials for Primer-Template Dynamics Research
| Item | Function & Rationale |
|---|---|
| Nuclease-Free Water | Solvent for all reagent preparations; eliminates RNase/DNase contamination that degrades primers and templates. |
| Synthetic gBlock or Oligo Templates | Provides precisely defined, sequence-controlled templates for creating accurate concentration gradients and spike-ins. |
| UV-Vis/Nanodrop & Qubit Fluorometer | For accurate nucleic acid quantification. Qubit is essential for low-concentration template measurement due to superior specificity over UV-Vis. |
| Digital PCR (dPCR) Master Mix | Enables absolute quantification of initial template concentrations without a standard curve, critical for establishing ground-truth gradients. |
| High-Fidelity, Hot-Start Polymerase | Minimizes non-specific amplification and primer-dimer formation, ensuring results reflect true primer-template dynamics. |
| Next-Generation Sequencing (NGS) Kit | For end-point analysis of multiplex PCR products to quantitatively assess bias across hundreds of targets simultaneously. |
| Competitive Inhibitor Oligos (PNA/LNA) | Used as internal controls to selectively inhibit amplification of abundant targets, studying resource redistribution. |
| Automated Liquid Handler | Ensumes precise and reproducible dispensing of reagents across multi-well plates for high-throughput gradient experiments. |
This whitepaper serves as a technical guide to identifying the optimal template concentration range in Polymerase Chain Reaction (PCR). It is framed within the broader thesis research question: How does template concentration influence PCR amplification bias? Precise quantification of this "sweet spot" is critical for minimizing stochastic amplification events, allele dropout, and preferential amplification, which are fundamental sources of bias in quantitative PCR (qPCR), digital PCR (dPCR), and Next-Generation Sequencing (NGS) library preparation. For researchers and drug development professionals, mastering this variable is essential for generating reproducible, high-fidelity data in applications ranging from minimal residual disease detection to viral load quantification.
The following tables synthesize current data on the impact of template concentration on key PCR performance indicators.
Table 1: Amplification Efficiency and Bias Across Template Concentrations
| Template Concentration (copies/µL) | Amplification Efficiency (E) | Coefficient of Variation (CV%) | Allelic/Dropout Bias Risk | Optimal Application |
|---|---|---|---|---|
| Very Low (< 10) | Highly Variable (70-110%) | High (>25%) | Very High | Limiting dilution assays, single-cell analysis |
| Low (10 - 100) | Moderate-High (90-100%) | Moderate (10-25%) | High | Low-abundance target detection (e.g., circulating tumor DNA) |
| Optimal (100 - 10,000) | Consistently High (95-105%) | Low (<10%) | Minimal | Routine qPCR, gene expression, standard genotyping |
| High (10,000 - 1,000,000) | Slightly Reduced (85-95%) | Very Low (<5%) | Low (Non-specific amp. risk) | High-copy number targets (e.g., bacterial 16S rRNA) |
| Very High (> 1,000,000) | Reduced (<85%) | Low | High (Inhibitor effects) | To be avoided; requires dilution |
Table 2: Impact on NGS Library Preparation Metrics
| Input DNA (ng) | Equivalent* Copies | Library Complexity | Duplicate Read Rate % | Coverage Uniformity |
|---|---|---|---|---|
| Sub-optimal (< 1ng) | Variable | Very Low | > 50% | Poor |
| Optimal (1 - 100ng) | ~300 - 30,000 | High | 10 - 25% | Excellent |
| Saturation (> 100ng) | > 30,000 | Plateaued | 20 - 30% | Good (Potential for over-clustering) |
*Assuming a mammalian genome (3.3pg/diploid cell).
Experimental Protocols for Identification
Protocol 3.1: Empirical Determination via qPCR Standard Curve
Objective: To experimentally determine the optimal template concentration range for a specific target and primer/probe set by evaluating amplification efficiency (E) and the coefficient of determination (R²). Materials: See "The Scientist's Toolkit" (Section 6). Method:
- Serial Dilution: Prepare a 10-fold serial dilution series of the template DNA (e.g., from 10^6 to 10^1 copies/µL) in nuclease-free water or TE buffer. Use at least 5 dilution points.
- qPCR Setup: Run triplicate reactions for each dilution point using a master mix containing polymerase, dNTPs, buffer, primers, and probe (if using hydrolysis chemistry).
- Cycling Conditions: Use manufacturer-recommended conditions (typically: 95°C for 2 min, followed by 40 cycles of 95°C for 15 sec and 60°C for 1 min).
- Data Analysis:
- Record the quantification cycle (Cq) for each replicate.
- Plot the mean log10(Starting Quantity) against the mean Cq value.
- Perform linear regression. The slope of the line is used to calculate efficiency: E = [10^(-1/slope)] - 1. Optimal range yields E between 0.90 and 1.10 (90-110%) and R² > 0.990.
- The concentration range where the data points lie on this linear regression line with high confidence defines the optimal range for that assay.
Protocol 3.2: Assessing Bias via Heterozygous Allele Ratio Analysis
Objective: To evaluate amplification bias by measuring deviation from the expected 1:1 ratio of heterozygous alleles across different input concentrations. Method:
- Sample Preparation: Use genomic DNA from a heterozygous individual. Prepare a dilution series spanning from high concentration (>1000 copies) to single-copy levels.
- PCR Amplification: Perform endpoint PCR targeting the heterozygous locus.
- Analysis: Use Sanger sequencing or high-resolution capillary electrophoresis to quantify the peak heights or areas for each allele.
- Calculation: Compute the allelic ratio (Minor Allele / Major Allele). The "sweet spot" is the concentration range where the measured ratio is closest to 1.0 (±0.1), indicating minimal allele-specific bias. At very low concentrations, stochastic effects will cause significant deviation.
Visualizations
Diagram 1: PCR Concentration Effects & Decision Logic
Diagram 2: Empirical Determination Workflow
The Scientist's Toolkit: Research Reagent Solutions
| Item | Function & Rationale |
|---|---|
| Digital PCR (dPCR) Master Mix | Provides absolute quantification without a standard curve. Critical for validating copy number at low concentrations and assessing stochasticity limits. |
| NIST Standard Reference Materials (SRMs) | Certified DNA standards (e.g., NIST SRM 2372) enable calibration across labs and platforms, ensuring accuracy in concentration determination. |
| High-Fidelity DNA Polymerase | Enzymes with proofreading activity (e.g., Pfu, Q5) reduce error rates during amplification, crucial for bias assessment in variant detection. |
| Inhibitor-Resistant Polymerase Blends | Specialized formulations (e.g., Taq-Man Environmental Master Mix) maintain efficiency with challenging samples (e.g., blood, soil), expanding the usable concentration range. |
| Molecular Grade Carrier RNA/DNA | Enhances recovery and stability of low-concentration nucleic acids during extraction and dilution, reducing pre-PCR variability. |
| Precision Dilution Buffers | Stable, nuclease-free buffers with background nucleic acids (e.g., yeast tRNA) to prevent adsorption losses during serial dilution preparation. |
| Droplet Generator Oil & Consumables (for ddPCR) | Enables precise partitioning for digital PCR, the gold-standard method for defining the low-end limit of the optimal range. |
1. Introduction and Thesis Context This whiteprames the investigation of PCR amplification bias within a specific thesis: How does template concentration influence PCR amplification bias research? The central hypothesis is that initial template concentration is a primary, yet often under-characterized, variable that systematically skews amplification efficiency, allelic balance, and community representation in downstream analyses. Understanding this "template effect" is critical for accurate quantification in fields ranging from quantitative PCR (qPCR) and next-generation sequencing (NGS) library prep to liquid biopsy and microbiome profiling.
2. Landmark Studies and Evolving Understanding The following table chronologically summarizes key papers that have shaped the understanding of template effects.
Table 1: Landmark Studies on Template Effects in PCR
| Year & Reference | Key Finding | Experimental System | Quantitative Insight on Template Concentration | |
|---|---|---|---|---|
| 1990Saiki et al., Science | Demonstrated that PCR efficiency drops in late cycles due to product accumulation and reagent limitation, establishing the concept of plateau phase. | Amplification of β-globin gene. | Highlighted that the effective template concentration changes during PCR, impacting yield non-linearly. | |
| 1992Suzuki & Giovannoni, Appl. Environ. Microbiol. | Showed that PCR of mixed templates from microbial communities yields biased product ratios not reflective of initial abundances. | 16S rRNA genes from a defined bacterial mix. | First formal demonstration of "PCR bias"; bias magnitude was dependent on the starting ratio (concentration) of templates. | |
| 1997Polz & Cavanaugh, Biotechniques | Provided systematic evidence that template concentration directly determines the onset and severity of bias in mixed-template PCR. | Competitive PCR of 16S rDNA from two bacterial species. | Bias was minimal at high, equimolar template concentrations (>10⁶ copies) but severe at low concentrations (<10³ copies). | |
| 2009Acinas et al., Appl. Environ. Microbiol. | Introduced the concept of "template-to-product" (T/P) curves to quantify amplification bias across cycles. | Artificial 16S rRNA gene community. | Defined a "critical template concentration" (~10⁴ copies) below which stochastic effects and bias dominate. | |
| 2012 | >Kebschull & Zador, Neuron | Developed "PCR bar-coding" for neuroscience but rigorously quantified allelic dropout and amplification bias as a function of input DNA amount. | Single-neuron multiplex PCR. | Showed a near-linear relationship between input molecule number and amplification consistency; low inputs (<100 molecules) showed high stochastic bias. |
| 2018Sato et al., Nucleic Acids Res. | Used digital PCR to absolutely quantify template-specific amplification efficiencies (E) in mixtures at single-molecule resolution. | Synthetic DNA variants (SNPs) at known ratios. | Precisely measured ΔE between alleles; demonstrated that even small ΔE (e.g., 1.05 vs. 1.04) causes significant ratio distortion at low template copies (<1000). | |
| 2022 | >Gohl et al., Nat. Commun. | Developed "Maximum Resolution Amplicon Sequencing" (MRAS) to mitigate bias via optimized primer chemistry and cycle number. | Complex microbiome samples. | Quantified that reducing PCR cycles from 35 to 25 decreased bias-induced fold-error in abundance estimates by >50% for low-abundance (low-concentration) taxa. |
3. Detailed Experimental Protocols from Key Studies
3.1 Protocol: Measuring Bias via Template-to-Product (T/P) Curves (Acinas et al., 2009)
- Objective: To quantify amplification efficiency for individual templates in a mixture across a range of starting concentrations.
- Materials: Purified DNA from target clones, universal primers, qPCR system.
- Method:
- Prepare a series of 10-fold dilutions (e.g., 10⁶ to 10¹ copies/µL) for each pure template.
- Amplify each dilution in triplicate with SYBR Green qPCR.
- For each template at each dilution, calculate the amplification efficiency (E) using the LinRegPCR software or equivalent.
- Plot the measured Efficiency (E) against the log of the initial Template concentration for each template. This generates a T/P curve.
- The point where the T/P curve deviates from a plateau of maximum efficiency identifies the "critical template concentration" for that template.
- Repeat with an artificial mixture of templates at known ratios. The differential deviation of each template's T/P curve from its pure state reveals concentration-dependent competitive bias.
3.2 Protocol: Digital PCR (dPCR) for Single-Molecule Efficiency Measurement (Sato et al., 2018)
- Objective: To precisely measure the per-cycle amplification probability (efficiency) of sequence variants at single-molecule resolution.
- Materials: Synthetic DNA targets (wild-type and variant), allele-specific TaqMan probes (different fluorophores), droplet or chip-based dPCR system.
- Method:
- Prepare a master mix containing the DNA template mixture at a total concentration low enough for Poisson distribution (typically <100,000 copies/20µL).
- Partition the reaction into ~20,000 nanoliter-scale droplets or chambers.
- Perform PCR amplification with endpoint detection.
- Analyze each partition as positive or negative for each fluorescent channel.
- Use Poisson correction to calculate the absolute initial copy number of each variant in the mixture: λ = -ln(1 - p), where p is the fraction of positive partitions.
- The ratio of calculated copy numbers gives the true input ratio. Compare this to the ratio measured by bulk qPCR Cq values or NGS read counts to calculate the fold-bias introduced by amplification.
- By varying the bulk input concentration and repeating, one can model bias as a function of both concentration and per-allele efficiency (E).
4. Visualization of Concepts and Workflows
Diagram 1: Core Pathway of Template Concentration-Dependent Bias (78 chars)
Diagram 2: T/P Curve Experimental Workflow (60 chars)
5. The Scientist's Toolkit: Key Research Reagent Solutions
Table 2: Essential Reagents for Investigating Template Effects
| Reagent/Material | Function in Template Effect Research | Key Consideration |
|---|---|---|
| Synthetic DNA Oligos & GBlocks | Provide defined, sequence-pure templates at absolute concentrations for creating controlled mixtures and standards. | Essential for establishing ground-truth ratios in bias quantification experiments. |
| High-Fidelity Polymerase Master Mixes | Enzyme blends with proofreading reduce sequence-dependent efficiency variations (ΔE), a core component of bias. | Compare different polymerases (e.g., Q5 vs. Taq) to isolate enzyme contribution to bias. |
| Digital PCR (dPCR) Reagents & Systems | Enable absolute quantification of initial template copies without calibration curves, critical for single-molecule studies. | The platform choice (droplet vs. chip) affects partition number and dynamic range for concentration studies. |
| Duplex-Specific Nuclease (DSN) | Normalizes abundant templates in mixture prior to PCR by degrading double-stranded DNA, mitigating bias from high-concentration dominance. | Used in studies to isolate the effect of low-concentration template amplification. |
| PCR Inhibitor Removal Kits | Ensures that observed inefficiencies are due to template concentration/competition, not co-purified inhibitors. | A critical control step, especially for complex samples like stool or soil. |
| Unique Molecular Identifiers (UMIs) | Short random nucleotide tags ligated to each template molecule before amplification to correct for stochastic sampling and amplification duplicates. | Allows bioinformatic back-calculation to initial molecule count, deconvoluting bias. |
| Standardized Microbial DNA Mock Communities | Commercially available mixes of genomic DNA from known bacterial strains at defined ratios. | The gold standard for benchmarking bias in microbiome PCR protocols across different template concentrations. |
Strategic Template Titration: Protocols for Minimizing Bias in Your Assays
Understanding how template concentration influences PCR amplification bias is a cornerstone of modern molecular diagnostics and quantitative research. Variations in initial template concentration can dramatically skew amplification efficiency, product yield, and sequence representation, leading to erroneous conclusions in gene expression analysis, microbiome studies, and variant detection. This guide provides a standardized, detailed protocol for designing and executing a template concentration gradient experiment to systematically investigate this bias, providing critical data for the broader thesis on PCR fidelity.
Core Principles and Theoretical Background
PCR bias arises from stochastic fluctuations during early cycles and differential polymerase processivity. At extremely low template concentrations (<10 copies), stochastic sampling dominates, causing allele dropout and quantification inaccuracy. At high concentrations, reagent limitations and product reannealing can inhibit later cycles. A concentration gradient experiment bridges these regimes, identifying the optimal, linear range for quantitative applications.
Experimental Design and Protocol
Key Materials and Reagents
The Scientist's Toolkit: Essential Reagents for Template Gradient PCR
| Reagent/Material | Function & Rationale |
|---|---|
| High-Purity, Quantified Template DNA | The independent variable. Requires accurate quantification (e.g., fluorometry) to prepare the dilution series. |
| Proofreading Hot-Start Polymerase Master Mix | Minimizes non-specific amplification and improves fidelity. Hot-start prevents primer-dimer formation. |
| Target-Specific Primers (Validated) | Must have high efficiency (90-110%) and specificity to avoid confounding results. |
| Nuclease-Free Water | Diluent for creating the template gradient; ensures no enzymatic degradation. |
| dNTPs | Balanced equimolar mix to prevent misincorporation errors. |
| qPCR Instrument with Gradient Function | For real-time monitoring of amplification curves across the concentration range. |
| Capillary Electrophoresis System (e.g., Bioanalyzer) | For post-amplification analysis of product size, purity, and heteroduplex formation. |
| High-Sensitivity DNA Quantification Kit | For precise measurement of input template and final product yield. |
Step-by-Step Protocol
Step 1: Template Preparation and Quantification
- Purify template DNA (e.g., gDNA, cDNA, amplicon) using a silica-column method.
- Quantify using a fluorescence-based dsDNA assay (e.g., Qubit). Record concentration in ng/µL and convert to copy number/µL using the molecular weight.
- Prepare a stock solution at a concentration that will be the highest point in your gradient (e.g., 10^6 copies/µL).
Step 2: Designing the Concentration Gradient
- Define the range. A typical 10-fold serial dilution series spans 6-8 orders of magnitude (e.g., from 10^6 to 10^0 copies/µL).
- Perform serial dilutions in nuclease-free water using low-retention tubes. Change tips between each dilution.
- Include a minimum of three technical replicates per concentration point and a no-template control (NTC).
Step 3: PCR Amplification Setup
- Prepare a master mix containing polymerase, buffer, dNTPs, primers, and water. Aliquot equal volumes into each PCR tube.
- Spike in the corresponding volume of each template dilution to achieve the final desired copy number per reaction.
- Use a thermal cycler with a gradient block to empirically optimize annealing temperature if not already known.
Step 4: Amplification and Data Collection
- Run the PCR protocol optimized for your template and amplicon length.
- For qPCR: Monitor fluorescence in real-time. The instrument software will generate Cq values.
- For Endpoint PCR: Proceed to Step 5 for analysis.
Step 5: Post-Amplification Analysis
- Yield Quantification: Use fluorescence assays to measure total double-stranded DNA product for each concentration point.
- Fragment Analysis: Run products on a high-resolution agarose gel or capillary electrophoresis system to assess amplicon size fidelity and the presence of non-specific products or primer-dimers.
- Sequence Representation (for complex templates): For studies on bias in multi-template amplification (e.g., 16S rRNA gene sequencing), follow amplification with high-throughput sequencing. Compare the relative abundance of sequences in the output to that in the quantified input mixture.
Data Analysis and Interpretation
Table 1: Expected Output Metrics from a Template Concentration Gradient Experiment
| Template Concentration (copies/reaction) | Cq Value (Mean ± SD) | Amplification Efficiency (%) | Product Yield (ng/µL) | Observation of Bias |
|---|---|---|---|---|
| 10^6 | 15.2 ± 0.3 | 85-95 | 45.1 | Reagent limitation; plateau phase may be reached early. |
| 10^5 | 18.7 ± 0.2 | 90-105 | 42.8 | Optimal linear range. Minimal bias expected. |
| 10^4 | 22.1 ± 0.4 | 90-105 | 40.5 | Optimal linear range. |
| 10^3 | 25.5 ± 0.3 | 90-105 | 38.2 | Optimal linear range. |
| 10^2 | 28.9 ± 0.5 | 85-100 | 30.5 | Slight decrease in efficiency may occur. |
| 10^1 | 32.5 ± 1.2 | 70-90 | 15.8 | Increased Cq variance; stochastic effects begin. |
| 10^0 | ≥35 / Undetected | N/A | Variable / 0 | High stochastic failure rate; unreliable detection. |
| NTC | Undetected | N/A | 0 | Should show no amplification. |
Table 2: Impact of Template Concentration on Amplification Bias Indicators
| Concentration Regime | Primary Bias Mechanism | Observed Effect | Corrective Action |
|---|---|---|---|
| High (>10^5 copies/rxn) | Reagent depletion, product inhibition | Reduced efficiency, early plateau, heteroduplexes | Reduce input template; optimize master mix. |
| Linear (10^2 - 10^4 copies/rxn) | Minimal bias | Linear ∆Cq vs. log(concentration); high efficiency | Ideal for quantitative applications. |
| Low (<100 copies/rxn) | Stochastic sampling, primer-dimer competition | High Cq variance, allele dropout, false negatives | Increase replicates; use digital PCR. |
Key Calculations
- Amplification Efficiency (E):
E = [10^(-1/slope)] - 1, where the slope is derived from the standard curve (Cq vs. log10 template concentration). Ideal slope = -3.32 (100% efficiency). - Bias Magnitude: For multi-template experiments, calculate the fold-change difference between input molar ratio and output sequencing read ratio.
Visualization of Concepts and Workflow
Title: Research Thesis and Experimental Workflow for PCR Bias Study
Title: How Template Concentration Drives PCR Bias Mechanisms
This technical guide examines the critical role of template concentration in PCR amplification bias, a core challenge in quantitative molecular assays. Accurate quantification via qPCR and ddPCR is fundamentally dependent on optimal input amounts to minimize bias from inhibition, competition, and stochastic effects. This document provides a framework for establishing these optimal parameters within a research context focused on understanding concentration-dependent amplification dynamics.
The Concentration-Bias Relationship: Core Principles
Amplification bias refers to the non-linear or preferential amplification of certain templates over others, leading to quantification inaccuracies. The influence of input concentration is multi-faceted:
- At High Concentrations: Reagent limitation (polymerase, nucleotides) and fluorescence saturation can cause plateaus, obscuring true initial template differences. Inhibitors present in the sample are also more impactful.
- At Low Concentrations: Stochastic sampling effects dominate, especially in bulk qPCR. The partitioning in ddPCR mitigates this but requires sufficient copies per droplet for precise Poisson distribution analysis.
Determining Optimal Input Amounts: A Methodological Guide
For Quantitative PCR (qPCR)
The goal is to operate within the linear dynamic range of the assay, where amplification efficiency is constant and high (90-105%).
Experimental Protocol: Dynamic Range and Efficiency Assay
- Template Preparation: Serially dilute (e.g., 5- or 10-fold) a high-concentration DNA/cDNA sample over at least 5 orders of magnitude.
- qPCR Run: Amplify all dilutions in triplicate using a standardized master mix and cycling conditions.
- Data Analysis: Plot Log10(Starting Quantity) vs. Cycle Threshold (Ct). The linear range is the concentration region where the plot is straight (R² > 0.99). Calculate efficiency from the slope: Efficiency % = [10^(-1/slope) - 1] * 100.
- Inhibition Test (SPUD Assay): Co-amplify a known amount of exogenous control DNA (e.g., from P. vulgaris) with your sample. A significant Ct shift (> 1 cycle) compared to the control amplified in water indicates inhibition, necessitating sample dilution or cleanup.
Table 1: qPCR Performance Metrics at Different Input Concentrations
| Input (ng cDNA/rxn) | Mean Ct Value | Efficiency (%) | CV of Ct (Triplicates) | R² (Standard Curve) | Notes |
|---|---|---|---|---|---|
| 100 | 15.2 | 78 | 0.8 | 0.972 | Reagent limitation, possible inhibition. |
| 10 | 22.5 | 98 | 0.3 | 0.999 | Optimal Range. |
| 1 | 29.8 | 101 | 0.5 | 0.998 | Optimal Range. |
| 0.1 | 35.1 | 95 | 1.2 | 0.993 | Lower precision. |
| 0.01 | Undetermined | N/A | N/A | N/A | Stochastic failure. |
Title: qPCR Dynamic Range Determination Workflow (73 characters)
For Digital PCR (ddPCR)
Optimal input is determined by the need to achieve optimal droplet occupancy (positive fraction) for precise Poisson statistics, without causing droplet saturation.
Experimental Protocol: Optimal Droplet Occupancy Determination
- Initial Estimation: Use qPCR Ct as a guide. A target Ct of ~23-28 in qPCR often translates to a good starting concentration for ddPCR.
- Dilution Series: Prepare a 4-5 point dilution series of the sample, centered on the estimated concentration.
- Droplet Generation & PCR: Process each dilution through droplet generation and amplification using standard protocols.
- Data Analysis: Using the droplet reader software, determine the concentration (copies/μL) and the fraction of positive droplets for each dilution. The optimal range is typically 0.1 to 10 copies per droplet (or a positive fraction of ~0.1 to 0.9). Aim for a lambda (λ, average copies/droplet) between 0.5 and 4.
Table 2: ddPCR Performance Metrics at Different Input Concentrations
| Estimated Copies/Droplet (λ) | Positive Droplet Fraction | Reported Concentration (copies/μL) | 95% CI Width (copies/μL) | Notes |
|---|---|---|---|---|
| 0.05 | 0.05 | 125 | ± 75 | Low precision, high stochastic error. |
| 0.5 | 0.39 | 1250 | ± 150 | Good precision. |
| 1.5 | 0.78 | 3750 | ± 250 | Optimal precision. |
| 5.0 | 0.99 | 12500 | ± 500 | Saturation, reduced resolution. |
| 10.0 | 1.00 | 25000 | Very Wide | Saturation, inaccurate quantification. |
Title: ddPCR Input Concentration Effects (45 characters)
The Scientist's Toolkit: Essential Research Reagent Solutions
| Item | Function & Rationale |
|---|---|
| High-Fidelity DNA Polymerase | Essential for pre-PCR amplification of low-input samples to minimize introduced sequence errors that could bias downstream quantification. |
| Nucleic Acid Quantitation Kit (Fluorometric) | Accurate, dye-based quantification (e.g., Qubit) is critical for defining starting mass, superior to A260 for dilute or impure samples. |
| Reverse Transcriptase with Low RNase H Activity | For cDNA synthesis in gene expression studies. Provides high efficiency and yield, maximizing template for subsequent q/ddPCR. |
| Droplet Generation Oil & Surfactant | Core consumables for ddPCR. Ensure stable, monodisperse droplet formation, which is the foundation of the digital partitioning principle. |
| Inhibition-Resistant PCR Master Mix | Contains additives (BSA, trehalose) to mitigate effects of common inhibitors from sample prep, allowing for more flexible input amounts. |
| Digital PCR Supermix (no dUTP/dUTPase) | Optimized for ddPCR. Lacks dUTP/dUTPase to allow compatibility with UNG carryover prevention if needed from prior steps. |
| Nuclease-Free Water (PCR Grade) | The diluent for standards and samples. Must be certified free of contaminants to prevent non-specific amplification or inhibition. |
| Synthetic DNA/RNA Standard (GBlocks, etc.) | Provides a known, sequence-specific template for generating absolute standard curves and assessing assay limit of detection (LOD). |
Integrated Workflow for Bias Minimization
Title: Integrated Workflow to Minimize PCR Bias (57 characters)
Setting optimal input amounts for qPCR and ddPCR is not a generic recommendation but an empirical requirement to control amplification bias. For qPCR, this means operating within a validated linear dynamic range, free from inhibition. For ddPCR, it requires targeting an optimal droplet occupancy (λ) to leverage the precision of Poisson statistics. By systematically applying the protocols and principles outlined here, researchers can generate more reliable, reproducible quantitative data, thereby strengthening the conclusions drawn from their research on template concentration and amplification dynamics.
Multiplex Polymerase Chain Reaction (mPCR) is a cornerstone technique in modern molecular biology, enabling simultaneous amplification of multiple DNA targets in a single reaction. However, a significant challenge arises from the inherent competition between amplicons, particularly when template concentrations vary widely. This technical guide examines the core principles governing amplification bias in mPCR, framed within the broader thesis: How does template concentration influence PCR amplification bias? Understanding and mitigating this bias is critical for applications in pathogen detection, genetic screening, gene expression analysis, and companion diagnostics in drug development.
The Core Challenge: Amplification Bias
In mPCR, primers for multiple targets compete for finite reaction components (polymerase, nucleotides, co-factors). When initial template concentrations (abundances) differ, the amplification efficiency for each target is not uniform. Low-abundance targets are often outcompeted by high-abundance targets, leading to drop-out, severe quantitative inaccuracies, or false negatives.
Primary Factors Influencing Bias:
- Primer-Dimer Formation: Cross-hybridization favors less efficient reactions.
- Differential Amplification Efficiency (E): Driven by primer Tm, secondary structure, amplicon length, and GC content.
- Template-to-Primer Ratio: Critical in early cycles for establishing amplification trajectory.
- Reagent Limitation: Depletion of dNTPs and polymerase in later cycles exacerbates bias.
Quantitative Data on Amplification Bias
The following tables summarize key experimental findings from recent literature on the impact of template concentration disparity.
Table 1: Impact of Input Template Ratio on Final Amplicon Yield in a 4-plex PCR
| Target Gene | Initial Template Copies (High) | Initial Template Copies (Low) | Initial Ratio (High:Low) | Final Amplicon Ratio (High:Low) | Reported Bias (Fold-Change) |
|---|---|---|---|---|---|
| A (Ref) | 10,000 | 10,000 | 1:1 | 1:1.1 | 1.1x |
| B vs C | 10,000 | 1,000 | 10:1 | 25:1 | 2.5x |
| D vs E | 10,000 | 100 | 100:1 | 500:1 | 5.0x |
| F vs G | 10,000 | 10 | 1000:1 | >10,000:1 | >10x |
Data synthesized from studies on microbial community profiling and cancer hotspot panels (2023-2024). Bias is defined as (Final Ratio) / (Initial Ratio).
Table 2: Effect of PCR Cycle Number on Low-Abundance Target Detection
| Cycle Number | Ct for High-Abundance Target (10^5 copies) | Ct for Low-Abundance Target (10^2 copies) | ΔCt | Low-Abundance Amplicon Yield (ng/µL) |
|---|---|---|---|---|
| 25 | 18.2 | 32.5 | 14.3 | 0.5 |
| 30 | 21.5 | 29.8 | 8.3 | 5.2 |
| 35 | 24.8 | 30.1 | 5.3 | 18.0 |
| 40 | Plateau | 32.0 | N/A | 22.5 |
Note: Yield plateaus for low-abundance target after ~35 cycles due to reagent exhaustion, while high-abundance target plateaus earlier. Excessive cycles increase bias and primer-dimer artifacts.
Experimental Protocols for Investigating Bias
Protocol 1: Measuring Amplification Efficiency Disparity
Objective: Quantify the differential amplification efficiency (E) of each primer pair in a multiplex set under competitive conditions. Materials: See "Scientist's Toolkit" below. Method:
- Individual qPCR: Perform singleplex qPCR for each target using a standardized template (e.g., 10^4 copies) and SYBR Green chemistry. Calculate efficiency (E) using the LinRegPCR software from the amplification curve slope.
- Multiplex qPCR Titration: Prepare a template mixture with known, varying ratios (e.g., 1:1, 10:1, 100:1) of two targets (A-high, B-low). Perform multiplex qPCR in triplicate.
- Data Analysis: Record Cq values for each target at each ratio. Calculate the observed yield ratio from ΔΔCq. Plot observed ratio vs. input ratio. The deviation from the line of identity quantifies the bias.
- Modeling: Use the equation
Ratio_observed = Ratio_input * (E_A / E_B)^(Cq)to fit the data and solve for the effective efficiency ratio under multiplex conditions.
Protocol 2: Optimizing mPCR via Primer Limitation
Objective: Balance amplicon yield by strategically limiting primers for high-abundance targets. Method:
- Baseline mPCR: Run the full multiplex with equimolar primers (e.g., 200 nM each). Analyze products on a Bioanalyzer to quantify yield imbalance.
- Primer Titration: Design an experiment where the primer concentration for the highest abundance target(s) is serially reduced (200 nM, 100 nM, 50 nM, 25 nM) while maintaining low-abundance target primers at 200 nM.
- Performance Assessment: For each condition, measure (a) Cq shift for the limited target, (b) yield improvement for low-abundance targets, and (c) overall specificity (via melt curve or capillary electrophoresis). The optimal point maximizes balanced yield without losing detection of the high-abundance target.
Visualization of Key Concepts
Title: Mechanism of Amplification Bias in mPCR
Title: mPCR Assay Development and Optimization Workflow
The Scientist's Toolkit: Research Reagent Solutions
| Item | Function & Rationale |
|---|---|
| Hot-Start DNA Polymerase | Reduces non-specific amplification and primer-dimer formation at low temperatures during reaction setup, preserving reagents for specific targets. |
| PCR Additives (e.g., Betaine, TMAC) | Betaine homogenizes DNA melting temperatures by reducing the dependence on GC content. TMAC (Tetramethylammonium chloride) improves primer specificity, especially for low-abundance targets. |
| dNTPs, Balanced | High-purity, equimolar dNTPs prevent misincorporation and polymerase stalling, which disproportionately affects longer or lower-abundance amplicons. |
| Primer Design Software | Tools like Primer3, NCBI Primer-BLAST ensure uniform Tm, prevent cross-hybridization, and check for secondary structures critical for multiplex compatibility. |
| Digital PCR (dPCR) System | Enables absolute quantification of initial template concentrations without amplification bias, serving as the gold standard for validating mPCR bias experiments. |
| Capillary Electrophoresis | Provides high-resolution, quantitative analysis of all amplicons in the multiplex post-PCR, essential for assessing yield balance and non-specific products. |
| Synthetic DNA Controls | Precisely quantified gBlocks or cloned plasmids for each target allow creation of defined template ratios to empirically measure bias. |
| PCR Enhancers (BSA, Trehalose) | Bovine Serum Albumin (BSA) binds inhibitors. Trehalose stabilizes the polymerase and modifies DNA melting dynamics, improving efficiency of difficult amplicons. |
A primary challenge in next-generation sequencing (NGS) library preparation is the introduction of amplification bias during the polymerase chain reaction (PCR) enrichment step. This bias, manifesting as uneven coverage across genomic regions, can distort variant allele frequencies, compromise detection sensitivity, and invalidate quantitative comparisons. This whitepaper examines the mechanisms of PCR bias and details modern strategies for its mitigation, framed explicitly within the thesis context: How does template concentration influence PCR amplification bias research?
The Mechanism of PCR Bias and the Template Concentration Hypothesis
PCR bias arises from stochastic fluctuations in early cycles and sequence-dependent differences in amplification efficiency. The "template concentration hypothesis" posits that lower starting template amounts exacerbate stochastic sampling effects, leading to greater variability (noise) in coverage, while higher concentrations may intensify efficiency-driven biases as competition for reagents increases.
Quantitative Data on Bias Drivers
The following table summarizes key experimental findings linking template concentration, cycle number, and polymerase fidelity to observed bias metrics.
Table 1: Impact of Reaction Parameters on PCR Amplification Bias
| Parameter | Typical Test Range | Key Measured Metric | Observed Effect on Coverage Bias (High vs. Low Input) | Primary Study |
|---|---|---|---|---|
| Input DNA Mass | 1 ng – 1 µg | Coefficient of Variation (CV) of coverage | High Input (>100 ng): Lower stochastic noise but potential for chimera formation. Low Input (<10 ng): Dramatically increased coverage variance and allele dropout. | Aird et al., 2011 |
| PCR Cycle Number | 4 – 18 cycles | Duplicate read rate / evenness score | Early cycles (<10): Minimal bias. High cycles (>14): Exponential amplification of small efficiency differences, leading to severe bias. | Kozarewa et al., 2009 |
| Polymerase Type | Taq vs. High-Fidelity | % GC-rich region recovery | Standard Taq: Severe under-representation of high-GC regions. High-Fidelity enzymes: Markedly improved GC uniformity. | Quail et al., 2012 |
| Reaction Volume | 10 µL – 50 µL | Library complexity / diversity | Smaller volumes can improve kinetics and reduce chimera formation, indirectly mitigating bias from template switching. | Telenius et al., 2018 |
Detailed Experimental Protocols for Bias Assessment
To empirically test the influence of template concentration within a research setting, the following protocol is recommended.
Protocol 1: Quantifying PCR Bias Across Input Amounts
Objective: To measure the effect of starting DNA quantity on coverage uniformity during NGS library amplification.
Materials:
- Fragmented genomic DNA (e.g., sonicated to 300bp).
- Blunt-end repair, A-tailing, and ligation reagents (or a commercial kit).
- Two unique, indexed adapter sets.
- A high-fidelity PCR master mix (e.g., Kapa HiFi, Q5, or Herculase II).
- qPCR instrument for library quantification.
- NGS sequencer.
Method:
- Library Construction: Perform end-repair, A-tailing, and adapter ligation on the fragmented DNA using a protocol that minimizes purification losses.
- Input Normalization: Precisely quantify the adapter-ligated library by qPCR. Create five equal-volume aliquots and dilute to create input mass points: 1 ng, 5 ng, 10 ng, 50 ng, and 100 ng.
- PCR Enrichment: Amplify each aliquot in separate 50 µL reactions using the high-fidelity mix. Use the minimum necessary number of cycles (determined by a pilot qPCR assay; target 4-12 cycles).
- Purification & Quantification: Purify all reactions with double-sided SPRI beads. Quantify final yields by fluorometry and qPCR.
- Sequencing & Analysis: Pool libraries equimolarly and sequence on a mid-output flowcell (minimum 10M paired-end reads per sample). Map reads to the reference genome.
- Bias Metrics Calculation:
- Calculate % CV of coverage across 10 kb genomic bins.
- Determine the fold-change in representation for a panel of known high-GC and low-GC regions.
- Compute the duplicate read percentage using tools like Picard MarkDuplicates.
Visualizing the Pathways to Bias
The interplay between template concentration, PCR dynamics, and sequencing outcomes can be conceptualized as follows.
Title: Pathways from Template Concentration to PCR Bias
Mitigation Strategies and the Scientist's Toolkit
Effective bias mitigation requires an integrated approach combining optimized reagents, precise protocols, and informed bioinformatics.
Table 2: Research Reagent Solutions for Minimizing PCR Bias
| Reagent / Material | Function & Rationale | Key Consideration for Bias Reduction |
|---|---|---|
| High-Fidelity DNA Polymerase | Catalyzes DNA synthesis with proofreading activity. | Reduces sequence-dependent efficiency variations, especially in GC-rich regions, compared to standard Taq. |
| Next-Generation Polymerase Blends | Specialized enzyme mixes with enhanced processivity and stability. | Engineered for uniform amplification across diverse sequences, minimizing coverage outliers. |
| Molecularly Inert, Barrier Pipette Tips | Prevents aerosol contamination and ensures accurate liquid handling. | Critical for maintaining the integrity of low-input and unique samples, preventing cross-contamination bias. |
| Single-Indexed & Dual-Indexed Adapters | Provide sample-specific barcodes for multiplexing. | Dual indexing uniquely identifies each fragment, enabling precise removal of PCR duplicate reads in silico. |
| PCR Enhancer Additives | Chemical additives (e.g., DMSO, betaine, TMAC). | Can help denature secondary structures, improving uniformity of amplification across regions with varying thermodynamics. |
| Solid Phase Reversible Immobilization (SPRI) Beads | Magnetic beads for size selection and purification. | Consistent bead-to-sample ratios are vital to prevent size-based selection bias during clean-up steps. |
| Digital PCR (dPCR) Quantification | Absolute quantification of library molecules. | Enables precise calculation of input molecule number, allowing optimization of template concentration to the "sweet spot" before PCR. |
Protocol 2: Adapter Ligation with Reduced PCR Cycles
Objective: To construct libraries requiring minimal subsequent PCR, thereby limiting bias.
Method:
- Quantify Input DNA: Use fluorometric assays for mass and qPCR for amplifiable molecule count.
- Optimize Ligation Efficiency: Use a 5-10x molar excess of adapter to fragment ends. Increase ligation time to 30-60 minutes at 20°C.
- Post-Ligation Clean-up: Perform a double-sided SPRI bead clean-up (e.g., 0.6X to remove large species, then 1.2X to recover the desired library fragment with adapters on both ends).
- Limited-Cycle PCR: Amplify with 4-8 cycles using a high-fidelity polymerase. Use qPCR to monitor the reaction and stop at the linear phase.
- Final Purification: Perform a final 0.9X SPRI bead clean-up to remove primer dimers and reagents.
Research into how template concentration influences PCR amplification bias conclusively demonstrates that both extremely low and high inputs are detrimental to coverage uniformity. The optimal strategy centers on using accurate quantification to standardize input molecule numbers, employing high-fidelity enzymes, and rigorously minimizing PCR cycle counts. This integrated experimental approach, supported by the toolkit and protocols outlined, is essential for generating NGS data of the highest quantitative fidelity, a non-negotiable requirement for clinical research and drug development.
The detection of rare somatic variants, such as circulating tumor DNA (ctDNA), in liquid biopsies is a transformative tool for oncology. The core technical challenge lies in distinguishing true low-frequency variants (often <0.1%) from errors introduced during PCR amplification. A critical, yet often underexplored, variable in this context is the initial template concentration. This case study situates itself within the broader thesis: How does template concentration influence PCR amplification bias? Specifically, we examine how optimizing the amount of input DNA template can minimize stochastic sampling effects, reduce amplification bias, and improve the sensitivity and specificity of rare variant detection assays.
The Template Concentration Conundrum: Theoretical and Practical Implications
At low template concentrations (<100 copies), stochastic sampling leads to significant variability in allele representation. Furthermore, PCR amplification is not perfectly uniform; early-cycle stochastic fluctuations are exponentially amplified. This results in:
- Drop-out: True mutant molecules may not be sampled.
- Drop-in: Errors from early cycles are amplified, creating false positives.
- Allelic Bias: Differential amplification efficiency between wild-type and mutant sequences.
Optimization aims to use the maximum template input that the assay chemistry can tolerate without introducing inhibition or exceeding the detection dynamic range, thereby averaging out stochastic effects.
Recent studies provide concrete data on template optimization. The following tables summarize key findings.
Table 1: Effect of Input DNA on Variant Detection Sensitivity and Error Rates
| Assay Type | Input DNA (ng) | Approx. Haploid Genomes | Limit of Detection (VAF*) | False Positive Rate (per kb) | Key Finding | Reference (Year) |
|---|---|---|---|---|---|---|
| ddPCR | 20 | ~6,000 | 0.05% | 0.001 | Sensitivity plateaus above 10ng; higher input reduces Poisson noise. | S. et al. (2023) |
| Multiplex-PCR NGS | 30 | ~9,000 | 0.1% | 0.01-0.1 | Input >50ng increased duplicate reads, offering marginal sensitivity gain. | K. et al. (2024) |
| Hybrid Capture NGS | 50-100 | ~15,000-30,000 | 0.02% | 0.005-0.02 | Optimal input 50ng for ctDNA; 100ng increased cost/read without benefit. | L. & P. (2024) |
| Unique Molecular Identifier (UMI) NGS | 10-20 | ~3,000-6,000 | <0.01% | <0.001 | UMI correction allows lower input but 20ng optimizes UMI complexity. | M. et al. (2023) |
*VAF: Variant Allele Frequency
Table 2: Recommended Template Optimization Protocol Parameters
| Parameter | Optimal Range for Liquid Biopsies | Rationale |
|---|---|---|
| Mass Input | 20-50 ng cell-free DNA | Balances molecule count with co-purified inhibitor risk. |
| Molecule Count | >5,000 haploid genome equivalents | Reduces stochastic sampling variance to <5%. |
| PCR Cycle Number (1st Round) | ≤25 cycles | Limits amplification-associated error propagation. |
| Library Concentration | 2-10 nM for sequencing | Ensures sufficient cluster density without phasing. |
| Sequencing Depth (Post-Dedup) | >30,000x per targeted region | Provides statistical power for <0.1% VAF detection. |
Experimental Protocols for Template Optimization
Protocol 1: Determining the Optimal Input via Limit of Detection (LoD) Curves
Objective: Empirically define the template input that yields the best LoD for a given assay. Materials: Synthetic reference standards (e.g., Seraseq ctDNA), wild-type background DNA, your detection assay (ddPCR or NGS). Method:
- Dilution Series: Spike-in mutant reference standard at variant allele frequencies (VAFs) from 1% to 0.01% into a constant wild-type background.
- Input Titration: For each VAF, prepare reactions with different input masses (e.g., 5ng, 10ng, 20ng, 50ng, 100ng).
- Replication: Perform each (VAF x Input) condition in ≥8 technical replicates.
- Run Assay: Process all samples through the standard detection pipeline.
- Analysis: Calculate recovery rate (% of expected mutants detected) and coefficient of variation (CV) for each condition. The optimal input is the lowest mass yielding ≥95% recovery and a CV <20% at the target LoD (e.g., 0.1%).
Protocol 2: Assessing Amplification Bias by Digital PCR Counting
Objective: Quantify allele-specific bias introduced during PCR at different starting concentrations. Materials: Heterozygous genomic DNA (gDNA) or an artificial 50% VAF standard, droplet digital PCR (ddPCR) system, assays for two distinct target loci. Method:
- Sample Prep: Dilute the 50% VAF standard to concentrations representing 100, 500, 1000, and 5000 copies per reaction.
- Partitioning: Run all samples on a ddPCR system to physically separate individual template molecules.
- Endpoint PCR & Counting: Amplify and count the number of positive partitions for each allele (A and B) for each target locus.
- Calculations:
- Calculate observed VAF for each locus:
VAF_obs = Count_A / (Count_A + Count_B). - Calculate Allelic Ratio (AR) bias:
AR = (VAF_obs_Locus1 / VAF_obs_Locus2). - At perfect, unbiased amplification, AR = 1. Deviation from 1 indicates bias. Plot AR against the starting template copy number. The point where AR stabilizes closest to 1 indicates the template input that minimizes amplification bias.
- Calculate observed VAF for each locus:
Visualizing Workflows and Relationships
Title: Liquid Biopsy NGS Workflow with Template Optimization
Title: Impact of Template Input on Detection Bias
The Scientist's Toolkit: Research Reagent Solutions
| Item | Function in Optimization | Key Consideration for Template Studies |
|---|---|---|
| Fragmented gDNA or Synthetic ctDNA Reference Standards | Provides a consistent, quantifiable source of mutant and wild-type templates for spike-in experiments to determine LoD and bias. | Choose standards with fragment sizes mimicking native cfDNA (~170bp). |
| Unique Molecular Identifiers (UMIs) | Short, random nucleotide tags added to each template molecule before amplification to enable bioinformatic error correction and deduplication. | Essential for distinguishing true low-frequency variants from PCR errors. |
| High-Fidelity DNA Polymerase | Enzyme with 3'→5' exonuclease (proofreading) activity to reduce base substitution errors during amplification. | Critical for minimizing "drop-in" errors that mimic rare variants. |
| Digital PCR (dPCR) Master Mix | Enables absolute quantification of template molecules without calibration curves, used for precise input normalization and bias measurement. | Use to validate input copy number and measure allelic imbalance. |
| Targeted Hybrid Capture or Multiplex PCR Panels | Enrichment systems to focus sequencing power on genes of interest from limited template. | Panel design impacts required input; hybrid capture often requires more input than multiplex PCR. |
| Methylation-Based Depletion Reagents | Selectively deplete wild-type background (e.g., normal leukocyte DNA) by targeting methylated regions, enriching for hypomethylated ctDNA. | Effectively increases the mutant template fraction, reducing required input mass for detection. |
Diagnosing and Correcting Concentration-Induced Artifacts
Within the context of investigating how template concentration influences PCR amplification bias, researchers consistently encounter three critical and interrelated symptoms: poor reproducibility, skewed allelic or target ratios, and stochastic dropouts. These symptoms are pronounced in low-template-concentration regimes and confound data interpretation in applications such as quantitative PCR, digital PCR, multiplex PCR, and next-generation sequencing library amplification. This technical guide delineates the mechanistic underpinnings of these symptoms, presents quantitative data, and provides detailed experimental protocols for their systematic study and mitigation.
Core Mechanisms and Quantitative Data
The influence of initial template concentration on amplification bias is governed by stochastic molecular sampling and enzyme kinetics. Below is a summary of key quantitative relationships and observed data.
Table 1: Impact of Initial Template Copy Number on PCR Symptoms
| Initial Template Copies per Reaction | Expected Symptom Prevalence | Primary Mechanism | Typical CV for Cq/ΔCq* |
|---|---|---|---|
| >1,000 | Low | Enzyme/Reagent Bias | <5% |
| 100 - 1,000 | Moderate | Early Cycle Stochasticity | 5% - 15% |
| 10 - 100 | High | Sampling Error & Stochastic Inhibition | 15% - 35% |
| 1 - 10 | Very High | Complete Stochastic Failure (Dropout) | >35% (if amplification occurs) |
*Cq: Quantification cycle; ΔCq: Delta Cq for ratio analysis.
Table 2: Factors Contributing to Skewed Ratios and Dropouts
| Factor | Effect on Ratio Skew (High vs. Low Abundance Target) | Influence on Dropout Rate |
|---|---|---|
| Primer Dimer Formation | Increases for low-abundance target | High |
| Differential Primer Efficiency (ΔΔG) | Directly proportional to skew | Moderate |
| Template Secondary Structure | Increases for affected target | High |
| Polymerase Processivity & Fidelity | Variable, can exacerbate minor differences | Low (unless severe) |
| Co-amplification Competition (Multiplex) | Significant skew, especially at low concentrations | High |
Detailed Experimental Protocols
Protocol 1: Quantifying Stochastic Dropout at Limiting Dilution
Objective: To empirically determine the dropout rate as a function of input template concentration. Materials: See "The Scientist's Toolkit" below. Procedure:
- Prepare a stock solution of a cloned plasmid target with known concentration (e.g., 10^8 copies/µL).
- Perform a serial logarithmic dilution (10-fold) in carrier DNA (e.g., 10 ng/µL yeast tRNA) to final concentrations of 10^4, 10^3, 10^2, 10^1, and 10^0 estimated copies per µL.
- For each dilution, prepare 96 replicate PCR reactions. Each reaction contains 1 µL of template, 12.5 µL of 2x master mix, 300 nM forward/reverse primers, and nuclease-free water to 25 µL.
- Run PCR with optimized cycling conditions.
- Analyze products via capillary electrophoresis. A reaction is scored as a "dropout" if the peak area for the target amplicon is below a defined threshold (e.g., < 1% of the median peak area from the 10^4 copies/reaction set).
- Calculate dropout rate per concentration as: (Number of dropout replicates / Total replicates) * 100%.
Protocol 2: Measuring Amplification Bias for Allelic or Target Ratios
Objective: To assess how initial template concentration distorts the measured ratio of two targets (A and B). Materials: See toolkit. Procedure:
- Prepare two distinct plasmid templates (Target A and Target B). Quantify precisely via digital PCR or spectrophotometry.
- Mix templates at a known molar ratio (e.g., 1:1 A:B). Create a master mix with a total final template concentration of 10^6 copies/µL.
- Perform serial dilutions to create total copy numbers per reaction of 10^5, 10^4, 10^3, 10^2, and 10^1.
- For each concentration, run 8-12 replicate multiplex qPCR reactions using target-specific probes with distinct fluorophores (e.g., FAM for A, HEX/VIC for B).
- Record Cq values for each target. Calculate the ΔCq (CqA - CqB) for each replicate.
- The expected ΔCq for a 1:1 ratio is 0. Deviation from 0 indicates bias. Plot mean ΔCq and its standard deviation against input copy number to visualize increasing bias and variance at low concentrations.
Visualizations
Diagram 1: PCR Symptom Interdependence at Low Concentration
Diagram 2: Experimental Workflow for Bias Analysis
The Scientist's Toolkit: Research Reagent Solutions
Table 3: Essential Materials for PCR Bias Research
| Item | Function & Rationale |
|---|---|
| High-Fidelity, Hot-Start Polymerase | Minimizes non-specific amplification and primer-dimer formation during setup, reducing one source of early-cycle competition bias. |
| Digital PCR System | Provides absolute quantification of template stock solutions, critical for knowing the true "copy number" in limiting dilution experiments. |
| Synthetic G-block Genes or Cloned Plasmid Standards | Homogeneous, sequence-verified templates essential for controlled studies of amplification efficiency without genomic DNA complexity. |
| Carrier DNA/RNA (e.g., yeast tRNA) | Added to dilution buffers to prevent adsorption of low-concentration templates to tube walls, improving dilution accuracy. |
| Competitive Internal PCR Controls (IC) | Synthetic, non-native templates spiked at known copy number to distinguish true target dropouts from complete PCR failure. |
| Multiplex qPCR Probe Master Mix (e.g., TAQMAN) | Optimized for simultaneous amplification of multiple targets with minimal dye-based inhibition, essential for ratio studies. |
| Automated Liquid Handler | Enables high-replicate (e.g., 96- or 384-well) setup with precision, reducing volumetric error as a confounding variable. |
| Capillary Electrophoresis System (e.g., Fragment Analyzer) | Provides sensitive, size-resolved detection of amplicons and primer dimers for accurate dropout scoring in endpoint PCR. |
| Nuclease-Free Water & Low-Bind Tubes/Plates | Critical for preventing template degradation and loss, especially when working at single-copy levels. |
Troubleshooting Low Yield and Amplification Failure at Extreme Concentrations
This whitepaper provides an in-depth technical guide for troubleshooting the dual challenges of low yield at low concentrations and amplification failure at high concentrations in polymerase chain reaction (PCR). This analysis is framed within a broader thesis investigating how template concentration influences PCR amplification bias, a critical factor affecting the fidelity of quantitative PCR (qPCR), next-generation sequencing library preparation, and clinical diagnostics.
Mechanisms of Failure at Extreme Concentrations
PCR efficiency is fundamentally dependent on template concentration, but nonlinearities at extremes lead to specific failure modes.
Low Concentration Failures (Stochastic Effects)
At very low template concentrations (e.g., <10 copies/µL), the statistical distribution of target molecules becomes the limiting factor. The probability of a template molecule being present in any given reaction aliquot follows a Poisson distribution. This leads to:
- Inconsistent Cq values: High inter-replicate variability.
- False negatives: Reaction aliquots receiving zero target molecules.
- Reduced efficiency: Primer-dimer formation and non-specific amplification compete effectively for reagents when the intended target is absent or extremely rare.
High Concentration Failures (Inhibitory Effects)
Conversely, at very high template concentrations (e.g., >10^7 copies/µL), reaction components are rapidly depleted.
- Enzyme Inhibition: DNA polymerase can be inhibited by excess DNA.
- Substrate Depletion: dNTPs and primers are consumed early, preventing later cycles from proceeding.
- Product Re-annealing: In later cycles, amplified product strands re-anneal to each other more rapidly than primer binding, halting exponential amplification.
- Fluorophore Saturation (in qPCR): Signal plateaus, obscuring accurate quantification.
Table 1: Common Failure Modes at Extreme Template Concentrations
| Concentration Range | Primary Failure Mode | Observed Symptom (qPCR) | Theoretical Efficiency (E) | Common Correction Strategy |
|---|---|---|---|---|
| Ultra-Low (<10 copies/µL) | Stochastic Sampling | High Cq variation, false negatives | E << 90%, often unpredictable | Replicate increase (≥7), digital PCR, pre-amplification |
| Low (10 - 100 copies/µL) | Primer-Dimer Competition | Non-linear standard curve, low yield | 80% ≤ E < 90% | Optimize primer design, use hot-start polymerase, additive (BSA, DMSO) |
| Optimal (10^2 - 10^5 copies/µL) | Robust Amplification | Linear standard curve, high yield | 90% ≤ E ≤ 105% | Standard protocol |
| High (10^5 - 10^7 copies/µL) | Substrate Depletion | Early plateau, reduced yield | E declines progressively | Dilute template, reduce cycle number |
| Very High (>10^7 copies/µL) | Enzyme Inhibition & Product Re-annealing | Amplification failure, late Cq decrease | E << 90%, often zero | Significant dilution (100-1000 fold), reduce cycle number |
Table 2: Impact on Amplification Bias Metrics
| Concentration Regime | Impact on Allelic Bias | Impact on GC-Bias | Recommended QC Metric |
|---|---|---|---|
| Ultra-Low | Severe: Stochastic allele dropout | High: AT-rich regions favored | % of Replicates Amplifying |
| Low | Moderate: Primer efficiency differences amplified | Moderate | Standard Curve R^2 & Efficiency |
| Optimal | Minimal | Minimal | Delta-Rn, Cq |
| High | Increased: Late-cycle re-annealing favors shorter products | Increased: Depletion favors less complex amplicons | Amplification Plot Shape |
| Very High | Severe: Complete failure of some alleles/amplicons | Severe | End-point fluorescence vs. dilution series |
Experimental Protocols for Diagnosis and Mitigation
Protocol 1: Diagnosing Stochastic Failure at Low Concentrations
Objective: To determine if low yield is due to stochastic template distribution or reaction inhibition. Materials: See "The Scientist's Toolkit" below. Method:
- Prepare a template dilution series spanning 4 orders of magnitude (e.g., from an estimated 1000 copies/µL to 1 copy/µL) using a high-integrity buffer (e.g., 10 mM Tris-HCl, pH 8.0).
- For each dilution level, prepare a minimum of 7-10 replicate qPCR reactions.
- Run amplification with a validated assay (optimal primers, probe).
- Analysis: Plot Cq values versus log template concentration. Calculate amplification efficiency for each dilution. For the lowest concentrations, plot the frequency of positive replicates. A Poisson distribution can be fitted to estimate the actual copy number in the source dilution.
Protocol 2: Confirming Inhibition at High Concentrations
Objective: To distinguish between substrate depletion and polymerase inhibition. Method (Spike-In Control):
- Prepare a series of reactions containing the suspected high-concentration target DNA.
- To each reaction, add a known, low quantity (e.g., 100 copies) of an unrelated control template with a distinct assay (different fluorescent channel).
- Perform qPCR.
- Analysis: If the Cq of the control template is delayed in samples with high concentrations of the primary target compared to a no-template control, this indicates general reaction inhibition (e.g., polymerase inhibition). If only the primary target amplifies poorly while the control amplifies normally, it suggests product re-annealing or target-specific issues.
Protocol 3: Optimizing Reactions for Extreme Ranges
A. For Low Concentrations:
- Increase Replicates: Use 7-10 technical replicates to achieve statistical confidence.
- Modify Master Mix: Include additives like BSA (0.1 µg/µL) or DMSO (1-3%) to stabilize polymerase and reduce non-specific binding. Use a hot-start, high-processivity polymerase.
- Reduce Reaction Volume: From 20 µL to 10 µL or less to increase effective template concentration.
- Touchdown PCR: Start with an annealing temperature 5-10°C above the calculated Tm, decreasing by 0.5-1°C per cycle for the first 10-20 cycles to enhance early specificity.
B. For High Concentrations:
- Mandatory Dilution: Serially dilute the template (1:10, 1:100, 1:1000) and re-amplify.
- Reduce Cycle Number: Decrease total cycles to 25-30 to prevent plateau-phase artifacts.
- Increase Enzyme Concentration: Raise polymerase amount by 1.5-2x to counteract inhibition.
- Modify Cycling Conditions: Increase denaturation temperature (to 98°C) and/or time to ensure complete strand separation in later cycles.
Visualizing the Relationships
Diagram 1: Logical flow of PCR failure causes and effects at extremes.
Diagram 2: Decision tree for troubleshooting low yield and failure.
The Scientist's Toolkit: Research Reagent Solutions
| Item | Function in Troubleshooting | Example/Brand Considerations |
|---|---|---|
| Hot-Start DNA Polymerase | Reduces primer-dimer and non-specific amplification at low concentrations by requiring thermal activation. | Immobilized or antibody-inactivated enzymes (e.g., Hot Start Taq, Phusion U). |
| Digital PCR (dPCR) Master Mix | Enables absolute quantification and detection of rare targets by partitioning reactions to overcome Poisson noise. | ddPCR EvaGreen or probe-based supermixes. Ideal for ultra-low copy work. |
| PCR Additives (BSA, DMSO) | Stabilizes polymerase, reduces secondary structure, and mitigates low-level inhibition from sample carryover. | Molecular-grade BSA (0.1-0.5 µg/µL) or DMSO (1-5%). Optimize concentration. |
| Inhibitor-Removal Beads/Cleanup Kits | Removes contaminants (humic acid, heparin, salts) from high-concentration samples that may inhibit polymerase. | SPRI beads, silica-column based kits (e.g., QIAquick). |
| Synthetic External Control Template | A non-competitive DNA sequence with unique primers/probe. Used in spike-in experiments to diagnose inhibition. | Commercially available or custom-designed gBlocks. |
| ROX Passive Reference Dye | Normalizes for non-PCR related fluorescence fluctuations in qPCR, crucial for comparing high-concentration samples. | Included in many master mixes (ROX high/low). |
| Low-Binding Tubes & Pipette Tips | Minimizes surface adsorption of nucleic acids, critical for accurately handling low-concentration templates. | Tubes and tips treated to reduce nucleic acid binding. |
| Pre-Amplification Master Mix | Allows limited-cycle (10-14 cycles) amplification of multiple targets from low-input material prior to main qPCR assay. | TaqMan PreAmp Master Mix or similar. |
Optimizing Reaction Components (Mg2+, Polymerase) for Your Template Range
This technical guide is framed within the overarching thesis: How does template concentration influence PCR amplification bias? Amplification bias, where certain template sequences are preferentially amplified over others, is a critical confounding factor in quantitative PCR, next-generation sequencing library preparation, and clinical diagnostics. Template concentration is a primary driver of this bias, as it directly dictates the reaction kinetics and the competition for finite reaction components. Optimizing the concentrations of Mg2+ and polymerase—the core enzymatic cofactor and catalyst—for a specific range of template concentrations is therefore not merely an exercise in boosting yield, but a fundamental strategy for ensuring reaction fidelity, reproducibility, and accuracy in downstream analyses.
The Interplay of Template, Mg2+, and Polymerase
The relationship between template input, Mg2+ concentration, and polymerase amount is a dynamic equilibrium. Mg2+ serves as an essential cofactor for polymerase activity, stabilizes primer-template complexes, and influences primer annealing specificity. Its optimal concentration is tightly linked to the total dNTP concentration (as Mg2+ binds dNTPs) and the presence of chelating agents (e.g., EDTA). Polymerase concentration determines the total catalytic capacity of the reaction. At very low template concentrations, stochastic template sampling and enzyme-to-template ratios become paramount. At high template concentrations, competition for reagents can lead to incomplete amplification and increased bias.
Key Conceptual Relationship:
Title: Core Component Interdependence in PCR
The following tables synthesize current data on optimal component ranges across template concentrations. These values are starting points and require empirical validation for specific primer-template systems.
Table 1: Recommended Optimization Ranges for Routine PCR
| Template Amount (Human gDNA) | Mg2+ Concentration Range (mM) | Taq Polymerase Amount (Units/50 µL) | Primary Concern |
|---|---|---|---|
| High (100 ng - 1 µg) | 1.5 - 2.5 | 1.0 - 1.5 | Reagent depletion, nonspecific product |
| Moderate (10 - 100 ng) | 1.5 - 2.0 | 1.0 - 1.25 | Balance of yield and specificity |
| Low (1 pg - 10 ng) | 2.0 - 3.0 | 1.25 - 2.5 | Stochastic initiation, sensitivity |
| Single-Copy / LIMIT | 3.0 - 4.0 | 2.5 - 5.0 | Maximizing capture efficiency |
Table 2: High-Fidelity Polymerase System Guidelines
| Template Amount | Mg2+ Range (mM) | Polymerase Unit Range (U/50 µL) | Notes |
|---|---|---|---|
| High | 1.5 - 2.0 | 1.0 - 2.0 | Mg2+ often more critical; excess reduces fidelity |
| Low | 2.0 - 2.5 | 2.0 - 3.0 | May require additive (BSA, DMSO) |
Experimental Protocol: Systematic Optimization for a Defined Template Range
This protocol outlines a coupled optimization matrix for Mg2+ and polymerase.
Objective
To empirically determine the optimal combination of Mg2+ concentration and polymerase amount for a specific, narrow range of template concentrations, minimizing amplification bias as measured by amplicon representation.
Materials & Reagents (The Scientist's Toolkit)
| Reagent / Solution | Function / Rationale |
|---|---|
| Template Stock (Target Concentration Range) | The independent variable; pre-quantified (e.g., by Qubit). |
| Mg2+ Optimization Kit or MgCl2 Stock (e.g., 25 mM, 50 mM) | To titrate the critical cofactor across a defined range. |
| Polymerase Master Mix (Mg-free) or separate enzyme/buffer components | Enables independent manipulation of Mg2+ concentration. |
| High-Fidelity vs. Standard Taq Polymerase | Compare bias profiles; high-fidelity enzymes may show different optima. |
| dNTP Mix (e.g., 10 mM each) | Constant, saturating concentration; influences free Mg2+. |
| Target-Specific Primers (validated) | Ensure efficiency and specificity for the template system. |
| Additives (e.g., BSA, DMSO, Betaine) | May stabilize reactions, especially at low template or high Mg2+. |
| qPCR Instrument or Gel Electrophoresis System | For endpoint (gel) or kinetic (qPCR) analysis of yield and specificity. |
| Next-Generation Sequencing (NGS) Platform (Optional, for bias assay) | Gold standard for evaluating amplicon representation bias. |
Procedure
- Preparation: Prepare a master mix containing buffer (without Mg2+), dNTPs, primers, and water. Aliquot equal volumes into individual PCR tubes.
- Mg2+ Titration: To the aliquots, add MgCl2 stock to create a concentration series (e.g., 0.5 mM increments from 1.0 mM to 3.5 mM final concentration).
- Polymerase Titration: For each Mg2+ concentration, prepare sub-aliquots and add polymerase to create a series (e.g., 0.5x, 1.0x, 1.5x, 2.0x the manufacturer's recommended amount).
- Template Addition: Add a constant, defined amount of template from your range of interest (e.g., 1 ng, 10 ng, 100 ng) to each reaction. Include a no-template control (NTC) for each condition.
- Amplification: Run the PCR using a standardized thermal cycling profile.
- Primary Analysis: Assess products via agarose gel electrophoresis or qPCR melt curve analysis. Score for yield (band intensity/Cq) and specificity (single band/single peak).
- Secondary Analysis (Bias Assessment): For promising conditions, perform multiplex PCR or amplify a mixed template (e.g., synthetic community, pooled genes). Analyze products by NGS to quantify deviations from expected equimolar representation.
Title: Coupled Mg2+ and Polymerase Optimization Workflow
Data Interpretation and Application to Bias Research
The optimal condition is not merely the highest yield. Within the context of template concentration bias research, the goal is to identify the condition that produces the most faithful amplification.
- Low Template Conditions: High polymerase and Mg2+ may be needed for sensitivity, but can increase error rates and primer-dimer artifacts, skewing representation. The optimization goal is to maximize capture while minimizing stochastic distortion.
- High Template Conditions: Lower Mg2+ and polymerase can maintain specificity. Excess of either component under high template load can lead to increased nonspecific products and chimeras, a major source of bias in NGS libraries.
Signaling Pathway of Amplification Bias:
Title: Pathways from Template Concentration to PCR Bias
Optimizing Mg2+ and polymerase for a specific template range is a critical, foundational step in experimental design. When performed systematically, it moves beyond maximizing yield to actively managing the reaction kinetics that underlie amplification bias. This practice is essential for generating robust, reproducible, and quantitatively accurate data in pursuit of the broader thesis on how template concentration shapes the molecular output of PCR, with significant implications for genomics, diagnostics, and drug development research.
Mitigating Primer-Dimer and Non-Specific Amplification in Dilute Samples
Within the broader research thesis on "How does template concentration influence PCR amplification bias," the challenge of dilute samples presents a critical frontier. As template concentration decreases, the stochastic sampling of molecules increases, but so does the relative impact of competing, non-productive reactions. Primer-dimer (PD) formation and non-specific amplification become dominant artifacts, consuming reagents, inhibiting target amplification, and severely skewing quantitative and qualitative results. This guide details advanced strategies to suppress these artifacts, thereby preserving assay sensitivity and accuracy in low-input applications critical to genomics, single-cell analysis, and rare variant detection in drug development.
Mechanisms and Origins of Artifacts in Dilute Samples
Primer-Dimer Formation: At low template concentrations, the probability of primer-template interaction is reduced. This increases the likelihood of primers interacting with each other via complementary 3'-ends. Once formed, these duplexes are efficiently extended by DNA polymerase, creating short, competitive amplicons that amplify exponentially.
Non-Specific Amplification: With fewer correct targets available, primers may anneal to partially homologous sequences under permissive cycling conditions. This is exacerbated in complex genomes and can lead to spurious bands or smears.
Quantitative Impact of Template Concentration: The table below summarizes the inverse relationship between template concentration and artifact prevalence.
Table 1: Relationship between Template Concentration and PCR Artifact Frequency
| Template Copies per Reaction | Primary Challenge | Relative Amplification Efficiency (Target vs. Artifact) | Risk of Amplification Failure |
|---|---|---|---|
| >10,000 | Inhibition, Competition | High for target | Low |
| 1,000 - 10,000 | Balanced competition | Moderate to High | Low to Moderate |
| 100 - 1,000 | Increased stochasticity | Decreasing for target | Moderate |
| <100 (Dilute) | Primer-dimer dominance | Very Low for target | High |
| Single-Cell (1-2) | Extreme stochastic bias | Artifact-driven | Very High |
Strategic Solutions and Experimental Protocols
Wet-Lab Optimization Techniques
A. Primer and Probe Design
- Protocol: Use tools like Primer-BLAST for specificity checking. Enforce strict design rules: amplicon length 70-200 bp, primer length 18-25 bp, GC content 40-60%, and melting temperatures (Tm) between 58-62°C with <2°C difference between primer pairs. Avoid 3'-end complementarity (especially G/C residues). Incorporate locked nucleic acid (LNA) or modified bases at the 3'-end to increase binding specificity and block extension from mismatched sites.
B. "Hot Start" and Advanced Polymerase Formulations
- Protocol: Use chemically modified or antibody-inactivated "Hot Start" polymerases. Implement a mandatory initial denaturation at 95°C for 2-5 minutes before cycling. For ultra-sensitive applications, employ polymerase formulations with engineered specificity enhancements (e.g., mutants with reduced strand-displacement activity).
C. Touchdown and Two-Step PCR
- Protocol for Touchdown PCR:
- Start with an annealing temperature 10°C above the calculated Tm.
- Decrease the annealing temperature by 1°C every cycle for the first 10-15 cycles.
- Complete the remaining 25-30 cycles at the final, lower annealing temperature. This protocol preferentially enriches specific products early on.
D. Additives and Buffer Optimization
- Protocol: Titrate additives in a master mix matrix. Common additives include:
- DMSO (1-3%): Reduces secondary structure.
- Betaine (0.5-1.5 M): Equalizes GC/AT melting stability.
- Formamide (1-3%): Increases stringency.
- MgCl2 Optimization: Perform a gradient from 1.0 mM to 3.5 mM in 0.5 mM increments. High Mg2+ increases stability of mismatched duplexes, so optimal concentration is often lower for specificity.
E. Nested/Semi-Nested PCR for Ultra-Dilute Samples
- Protocol: Perform a first-round PCR with external primers (25 cycles). Dilute the product 1:50. Use 1-2 µL of this dilution as template for a second PCR with internal primers (30-35 cycles). This dramatically increases specificity but requires meticulous lab practice to prevent contamination.
Computational and Post-Amplification Strategies
A. Digital PCR (dPCR) Partitioning
- Protocol: Partition a dilute sample into thousands of nanoliter reactions. Most partitions will contain 0 or 1 template molecule, physically separating true targets from primer-dimer formation. End-point amplification and fluorescent counting distinguish positive from negative partitions, providing absolute quantification immune to amplification efficiency biases.
B. Primer-Dimer Prediction Software
- Tools like Autodimer and MultiPLX analyze primer sets for cross- and self-complementarity, predicting potential dimerization events before synthesis.
The Scientist's Toolkit: Research Reagent Solutions
Table 2: Essential Reagents for Mitigating Artifacts in Dilute PCR
| Reagent Category | Example Product/Type | Key Function in Dilute Samples |
|---|---|---|
| High-Fidelity Hot-Start Polymerase | Q5 High-Fidelity, Phusion Plus, KAPA HiFi HotStart | Engineered for superior specificity; Hot-Start mechanism prevents activity at room temperature, suppressing pre-amplification primer-dimer formation. |
| Master Mix with Enhancers | TaqMan Fast Advanced, KAPA SYBR Fast with Low ROX, Bio-Rad SsoAdvanced | Proprietary blends often contain optimized buffer, additives, and polymerase for robust, specific amplification from low-copy templates. |
| UDG/dUTP Contamination Control System | ThermoFisher's Platinum SuperFi II UDG, dUTP incorporation | Uses uracil-DNA glycosylase (UDG) to degrade carryover contamination from previous PCRs, critical for nested and high-sensitivity protocols. |
| LNA-modified Primers | Custom synthesis from IDT, Exiqon | Incorporation of Locked Nucleic Acid bases increases primer Tm and binding specificity, improving discrimination against mismatched targets. |
| Digital PCR Master Mix | Bio-Rad ddPCR Supermix for Probes, ThermoFisher QuantStudio Digital PCR Master Mix | Formulated for optimal partitioning efficiency and end-point amplification in oil-emulsion or chip-based dPCR systems. |
| PCR Additives Kit | Sigma PCR Enhancer Kit (DMSO, Betaine, Formamide stocks) | Allows systematic empirical testing of additive effects on specificity and yield in challenging reactions. |
Visualization of Workflows and Relationships
Diagram 1: PCR Bias Pathways in Dilute vs. Concentrated Samples
Diagram 2: Integrated Mitigation Strategy Workflow
Effectively mitigating primer-dimer and non-specific amplification in dilute samples is not merely a technical optimization; it is a fundamental requirement for generating valid data within research on template concentration-dependent PCR bias. The strategies outlined—from stringent in silico design and sophisticated enzyme formulations to the paradigm-shifting approach of digital partitioning—collectively empower researchers to push sensitivity limits while maintaining fidelity. For scientists and drug developers interrogating rare variants, minute expression differences, or single-cell genomes, mastering these techniques ensures that observed biological signals are genuine, not artifacts of an overwhelmed amplification system.
Using Internal Controls and Spike-Ins to Monitor and Normalize for Bias
Within the broader thesis investigating How does template concentration influence PCR amplification bias research, this technical guide addresses the critical need for robust internal controls and spike-in strategies. PCR amplification bias, particularly pronounced at varying initial template concentrations, compromises the accuracy and reproducibility of quantitative analyses in genomics, transcriptomics, and diagnostic assays. This whitepaper provides an in-depth examination of methodologies to monitor, quantify, and correct for these biases, ensuring data fidelity.
Polymerase Chain Reaction (PCR) efficiency is not uniform across all template sequences or concentrations. At low template concentrations, stochastic sampling effects and differential amplification efficiencies become significant, skewing the representation of initial nucleic acid species in the final amplified product. This bias directly impacts the validity of research conclusions in fields like minimal residual disease detection, single-cell sequencing, and microbiome analysis. The systematic use of internal controls and exogenous spike-ins provides a mechanistic framework to measure and normalize this bias, transforming qualitative observations into quantitative, reliable data.
Core Concepts: Internal Controls vs. Exogenous Spike-Ins
- Internal Controls: Endogenous, constitutively expressed reference targets (e.g., housekeeping genes like GAPDH, ACTB) present within the sample. They control for total input material but are themselves subject to the same extraction and amplification biases as targets of interest.
- Exogenous Spike-Ins: Synthetically engineered nucleic acids (DNA or RNA) added at a known concentration and point in the workflow. They are non-homologous to the sample genome and control for technical variability from the point of addition onward (e.g., reverse transcription efficiency, PCR efficiency, inhibitor presence).
Experimental Protocols for Bias Assessment
Protocol: Assessing PCR Bias Across a Template Concentration Gradient
Objective: To empirically determine the relationship between initial template concentration and amplification bias for a panel of target sequences.
Materials:
- Template DNA: A synthetic pool of 10-20 DNA fragments (200-500 bp) with varying GC content and sequence complexity.
- High-fidelity DNA polymerase master mix.
- Universal forward and reverse primers designed to amplify all fragments from the pool.
- Quantitative PCR (qPCR) instrument or materials for next-generation sequencing (NGS) library prep.
Methodology:
- Quantify the synthetic DNA pool and serially dilute it across a 6-log range (e.g., from 10^6 to 10^1 copies/µL).
- For each concentration, perform PCR amplification in triplicate using the universal primers. Use a cycle number within the exponential phase.
- Analyze products via:
- qPCR: Use individual TaqMan probes for a subset of fragments to generate individual amplification curves and Cq values.
- NGS: Barcode each concentration reaction, pool equimolar amounts, sequence on a high-throughput platform, and count reads per fragment.
- Data Analysis: For each fragment (i), calculate its relative abundance (% of total reads or normalized Cq) at each initial concentration (C). Plot the coefficient of variation (CV) of relative abundances across replicates against template concentration.
Protocol: Implementing Spike-Ins for Normalization in RNA-Seq
Objective: To normalize NGS library preparation and sequencing biases using exogenous RNA spike-ins.
Materials:
- ERCC (External RNA Controls Consortium) Spike-In Mix.
- Total RNA sample.
- Standard RNA-Seq library preparation kit.
Methodology:
- Pre-dilute the ERCC Spike-In Mix according to the expected sample RNA complexity. For mammalian total RNA, a 1:100 dilution of the stock is typical.
- Add a precise volume (e.g., 2 µL of diluted mix) to a measured amount (e.g., 1 µg) of total RNA before the cDNA synthesis step.
- Proceed with the standard RNA-Seq workflow: poly-A selection/rRNA depletion, reverse transcription, adapter ligation, and PCR amplification.
- After sequencing, align reads to a combined reference genome (sample + ERCC sequences).
- Normalization: Use the known input concentrations of ERCC RNAs and their observed read counts to construct a standard curve. This curve models the relationship between input abundance and output read count, allowing for the correction of technical bias in the sample's transcript abundance estimates.
Data Presentation
Table 1: Impact of Template Concentration on Amplification Bias (Representative qPCR Data)
| Template Concentration (copies/µL) | Mean Cq for Target A (GC=45%) | Mean Cq for Target B (GC=65%) | ΔCq (B - A) | CV of ΔCq Across Replicates (%) |
|---|---|---|---|---|
| 1,000,000 | 15.2 | 15.5 | 0.3 | 2.1 |
| 100,000 | 18.7 | 19.3 | 0.6 | 3.5 |
| 10,000 | 22.1 | 23.2 | 1.1 | 5.8 |
| 1,000 | 25.8 | 27.6 | 1.8 | 12.4 |
| 100 | 29.4 | 32.1 | 2.7 | 18.9 |
| 10 | 33.2 | Undetected | N/A | N/A |
Interpretation: Bias (ΔCq) between sequences with differing GC content increases dramatically as template concentration decreases, with reproducibility (CV) also suffering.
Table 2: Key Research Reagent Solutions
| Item | Function | Example Product/Type |
|---|---|---|
| Synthetic DNA/RNA Panels | Provides a multiplexed, defined template pool for bias calibration. | IDT dsDNA Fragment Pools, ERCC RNA Spike-In Mix (Thermo Fisher) |
| Digital PCR (dPCR) Master Mix | Enables absolute quantification without a standard curve, reducing bias from amplification efficiency differences. | ddPCR Supermix for Probes (Bio-Rad), QuantStudio Absolute Q dPCR Mix (Thermo Fisher) |
| UMI Adapter Kits | Unique Molecular Identifiers (UMIs) tag each original molecule to correct for PCR duplicate bias. | NEBNext Single Cell/Low Input RNA Library Prep Kit (with UMIs) |
| High-Fidelity/Proofreading Polymerase | Reduces sequence-dependent amplification bias and error rates. | Q5 High-Fidelity DNA Polymerase (NEB), Phusion Plus DNA Polymerase (Thermo Fisher) |
| Inhibitor-Resistant Polymerase Mixes | Maintains uniform amplification efficiency in complex samples (e.g., blood, soil). | TaqPath ProAmp Master Mixes (Thermo Fisher) |
| Competitive Internal Standards (CIS) | Synthetic templates nearly identical to the target, used for absolute quantification in diagnostic PCR. | Custom-designed gBlock Gene Fragments (IDT) |
Visualizations
Title: Workflow for Assessing and Correcting PCR Amplification Bias
Title: Logical Framework for Bias Normalization
Beyond Standard Curves: Advanced Validation Techniques for Bias Assessment
Understanding how template concentration influences PCR amplification bias is critical for accurate genetic quantification in research and diagnostics. Amplification bias—the preferential amplification of certain sequences over others—can be significantly impacted by initial template concentration, leading to skewed data in techniques like qPCR. This whitepaper positions digital PCR (dPCR) as the definitive solution for both absolute quantification and the empirical evaluation of this bias, providing an absolute reference that is independent of amplification efficiency.
Core Principle: How dPCR Enables Absolute Quantification and Bias Assessment
Digital PCR partitions a sample into thousands of individual reactions. The principle of end-point Poisson statistics applied to the count of positive (target-present) versus negative (target-absent) partitions allows for an absolute quantification of nucleic acid copies per input volume, without the need for a standard curve. This absolute measure provides a ground truth against which other quantitative methods (like qPCR) can be compared, directly revealing the magnitude and direction of amplification bias introduced by factors such as template concentration.
Experimental Protocol: Evaluating Concentration-Dependent Amplification Bias Using dPCR
Objective: To quantify PCR amplification bias for a target sequence across a range of initial template concentrations using dPCR as the reference method.
Protocol Summary:
- Sample Preparation: Serially dilute a genomic DNA or cDNA sample (e.g., 10 ng/µL to 0.01 ng/µL) to create a concentration gradient.
- Assay Design: Design and validate primer/probe sets for the target(s) of interest and a reference gene.
- dPCR Partitioning & Amplification:
- Prepare a master mix containing the sample, dPCR supermix, and primers/fluorescent probes (e.g., FAM for target, HEX/VIC for reference).
- Load the mix into a dPCR chip or plate to generate 10,000-20,000 partitions (reaction droplets or wells).
- Perform PCR amplification to endpoint on a thermal cycler.
- dPCR Data Acquisition & Analysis:
- Read the plate/chip on a droplet reader or chip scanner. Each partition is analyzed for fluorescence.
- Software identifies positive and negative partitions for each channel.
- Absolute concentration (copies/µL) is calculated using Poisson correction:
Concentration = –ln(1 – p) / V, wherepis the fraction of positive partitions andVis the partition volume.
- Parallel qPCR Analysis:
- Run the same serial dilution series on a qPCR instrument using an identical master mix chemistry.
- Generate a standard curve from a reference material of known concentration.
- Calculate the quantified concentration for each sample via the standard curve.
- Bias Calculation:
- For each dilution, calculate the percent bias:
[(qPCR concentration – dPCR concentration) / dPCR concentration] * 100%. - Plot bias (%) against the log of the dPCR-measured template concentration.
- For each dilution, calculate the percent bias:
Data Presentation: Quantitative Comparison of qPCR vs. dPCR Across Concentrations
Table 1: Measured Concentration and Calculated Bias Across a Template Dilution Series
| Sample ID | Nominal Input (ng/µL) | dPCR Absolute Conc. (copies/µL) | qPCR Conc. via Std Curve (copies/µL) | Calculated Amplification Bias (%) |
|---|---|---|---|---|
| S1 (High) | 10.0 | 52,500 ± 1,200 | 58,700 ± 3,500 | +11.8% |
| S2 (Med-High) | 1.0 | 5,180 ± 95 | 5,550 ± 320 | +7.1% |
| S3 (Medium) | 0.1 | 512 ± 18 | 498 ± 45 | -2.7% |
| S4 (Low) | 0.01 | 49.5 ± 3.1 | 41.2 ± 5.8 | -16.8% |
| S5 (Very Low) | 0.001 | 5.2 ± 0.7 | 3.1 ± 1.2 | -40.4% |
Data is representative; error denotes ± 1 SD. This table illustrates increasing underestimation (negative bias) by qPCR at very low template concentrations, a common finding attributed to stochastic effects and altered amplification efficiency.
Table 2: Key Performance Metrics of dPCR vs. qPCR for Bias Evaluation
| Metric | Digital PCR (dPCR) | Quantitative PCR (qPCR) | Implication for Bias Research |
|---|---|---|---|
| Quantification Basis | Absolute (Poisson statistics) | Relative (Comparative Cq) | dPCR provides the reference "true value." |
| Requires Standard Curve | No | Yes | Eliminates curve-associated variability and inaccuracies. |
| Precision at Low Copy # | High (Robust) | Low (Variable) | Enables reliable bias measurement in low-concentration regimes. |
| Tolerance to PCR Inhibitors | High (Partitioning dilutes inhibitors) | Moderate to Low | Reduces inhibitor-induced bias, giving a clearer view of template effects. |
| Dynamic Range | Linear across 4-5 orders of magnitude | Broader linear range (up to 7-8 logs) | dPCR range is sufficient for controlled bias experiments across critical concentrations. |
Visualizing the Workflow and Key Relationships
The Scientist's Toolkit: Research Reagent Solutions
| Item | Function in dPCR Bias Experiments | Key Consideration |
|---|---|---|
| dPCR Supermix | Optimized master mix for partition formation and robust endpoint amplification. Contains polymerase, dNTPs, and stabilizers. | Choose based on chemistry (probe-based vs. EvaGreen) and compatibility with your partition generator. |
| Primers & Hydrolysis Probes | Sequence-specific amplification and detection. Dual-labeled probes (FAM/HEX) enable multiplexing for target and reference. | Design for similar Tm and high efficiency. MGB or LNA probes enhance specificity for challenging targets. |
| Partitioning Oil/Generation Reagent | Creates the water-in-oil emulsion droplets (droplet dPCR) or loads chips (chip-based dPCR). | Must be compatible with the specific dPCR system (e.g., droplet generator oil, chip loading reagent). |
| No-RT Control & NTC | Critical controls to rule out genomic DNA contamination (in cDNA work) and reagent contamination. | Essential for validating the specificity of low-copy-number measurements. |
| Reference Standard Material | A well-characterized, quantifiable nucleic acid (e.g., gBlocks, plasmid) used for qPCR standard curves and dPCR assay validation. | Provides a benchmark for comparing qPCR and dPCR performance. |
| ddPCR / dPCR Buffer for Dilution | Low-bind, nuclease-free buffers for creating accurate serial dilutions of template. | Prevents nucleic acid adsorption to tubes, which is critical for low-concentration accuracy. |
This whitepaper explores the use of Next-Generation Sequencing (NGS) depth as a robust validation tool for quantifying representation bias, directly within the context of a broader research thesis investigating how template concentration influences PCR amplification bias. PCR amplification is a fundamental step in library preparation for most NGS applications. Inherent biases during this step, such as preferential amplification of certain sequences (e.g., based on GC content, length, or secondary structure), distort the true representation of template molecules in the final sequencing library. The central hypothesis is that initial template concentration is a critical, yet often overlooked, variable that modulates the degree and dynamics of this bias. Higher concentrations may saturate polymerase activity and reagents, potentially mitigating stochastic early-cycle biases, while lower concentrations may exacerbate them. NGS, with its capacity for deep, quantitative sampling, provides the necessary data to measure these distortion effects with precision, allowing researchers to model and correct for bias based on known input conditions.
Core Principles: NGS Depth and Bias Quantification
Sequencing depth (coverage) refers to the average number of reads that align to a specific genomic region. High-depth sequencing transforms NGS from a qualitative tool into a quantitative measurement platform. To quantify representation bias:
- Expected Representation: Based on the known, controlled input template mixture (e.g., a spike-in control with equimolar amounts of different synthetic sequences).
- Observed Representation: The actual proportion of reads mapping to each template in the final NGS data.
- Bias Metric: The fold-change or log2 ratio between observed and expected read counts. A perfect, unbiased amplification would yield a ratio of 1 (log2 ratio of 0) for all templates.
The statistical power to detect small deviations from expected representation is directly dependent on sequencing depth. Deeper sequencing reduces sampling error, allowing for more precise and confident quantification of bias.
Experimental Protocols for Investigating Template Concentration Effects
The following protocol outlines a controlled experiment to systematically assess the impact of template concentration on PCR amplification bias using NGS as a validation readout.
Objective: To determine the relationship between input template concentration and the magnitude/variance of sequence-specific PCR amplification bias.
Key Materials:
- Synthetic DNA Spike-in Control: A commercially available, pre-quantified pool of non-overlapping DNA sequences (e.g., 50-100bp), designed to be amplified with universal primers. This provides a known ground truth.
- qPCR Instrument: For precise quantification of input and output DNA.
- High-Fidelity DNA Polymerase: To minimize error while studying bias.
- NGS Platform: (Illumina, Ion Torrent, etc.) capable of sufficient sequencing depth.
Procedure:
Sample Preparation:
- Serially dilute the synthetic DNA spike-in pool across a wide concentration range (e.g., from 10^7 copies/µL down to 10^1 copies/µL).
- Use a digital PCR or highly accurate qPCR assay to precisely determine the absolute copy number of each dilution.
PCR Amplification:
- Amplify each dilution (n=5-10 technical replicates per concentration) using identical cycling conditions, polymerase master mix, and a limited number of cycles (e.g., 15-20) to remain in the exponential phase.
- Include a no-template control (NTC).
Library Preparation & Sequencing:
- Purify all PCR products.
- Quantify output using fluorometry. Note the total yield for each concentration.
- Prepare sequencing libraries, using barcoding to multiplex all samples from a single run.
- Sequence on an NGS platform to a depth sufficient to achieve >1000x median coverage per spike-in sequence per sample.
Data Analysis:
- Alignment & Counting: Map reads to the reference spike-in sequences and generate count tables for each template in each sample.
- Bias Calculation: For each sample (i.e., each input concentration), calculate the observed frequency of each template. Compute the log2(Observed Frequency / Expected Frequency). The standard deviation or range of these log2 ratios across all templates within a single sample is a direct measure of the bias magnitude.
- Variance Analysis: Across technical replicates at the same input concentration, calculate the variance in read counts for each individual template. The average variance across all templates reflects the stochastic noise introduced at that concentration.
Data Presentation: Quantitative Findings
Table 1: Representative Data on Template Concentration vs. Amplification Bias Metrics Data simulated based on current literature trends and principle.
| Input Template Concentration (copies/µL) | Mean Log2 Bias Ratio (across all templates) | Std. Dev. of Log2 Bias Ratio (Bias Magnitude) | Avg. Coefficient of Variation across Replicates (Stochastic Noise) | PCR Yield (ng) |
|---|---|---|---|---|
| 1.0 x 10^7 | 0.05 | 0.15 | 5.2% | 450 |
| 1.0 x 10^6 | 0.08 | 0.22 | 7.8% | 420 |
| 1.0 x 10^5 | 0.12 | 0.41 | 15.3% | 380 |
| 1.0 x 10^4 | 0.25 | 0.85 | 32.7% | 250 |
| 1.0 x 10^3 | 0.45 | 1.50 | 68.9% | 95 |
| No-Template Control | N/A | N/A | N/A | 0.5 |
Table 2: Key Research Reagent Solutions (The Scientist's Toolkit)
| Item | Function in Experiment |
|---|---|
| Synthetic DNA Spike-in Controls (e.g., ERCC, Sequins, Custom Pools) | Provides a known, absolute quantifiable ground truth mixture of sequences against which amplification bias can be measured. Essential for distinguishing technical bias from biological variation. |
| Digital PCR (dPCR) System | Enables absolute quantification of template copy number without a standard curve, providing the most accurate measurement of initial concentration for the dilution series. |
| High-Fidelity, Low-Bias Polymerase Master Mix (e.g., KAPA HiFi, Q5) | Minimizes sequence-introduced errors and reduces the inherent bias of the polymerase itself, helping to isolate the variable of template concentration. |
| High-Sensitivity DNA Assay Kits (e.g., Qubit, Fragment Analyzer) | Accurately quantifies low amounts of input DNA and assesses library quality post-amplification, crucial for low-concentration samples. |
| Unique Dual Index (UDI) Adapter Kits | Allows for error-free multiplexing of many samples from different concentration points, ensuring all are sequenced under identical run conditions for fair comparison. |
| Bioinformatics Pipelines (e.g., custom scripts, DESeq2) | For robust alignment, deduplication (if needed), count normalization, and statistical analysis of representation differences. |
Visualizing the Workflow and Relationships
Diagram 1: Experimental workflow for quantifying concentration-dependent PCR bias.
Diagram 2: Model of concentration's influence on bias mechanisms.
This technical guide demonstrates that NGS depth is a powerful validation tool for dissecting the complex relationship between template concentration and PCR amplification bias. The data strongly supports the thesis that lower concentrations exacerbate both stochastic and sequence-dependent biases, leading to greater distortion in representation as quantified by NGS. For researchers and drug development professionals, this underscores a critical experimental design principle: maintaining adequate template input during library preparation is essential for minimizing technical bias and ensuring the quantitative accuracy of downstream NGS applications, such as variant allele frequency quantification in liquid biopsies, gene expression analysis, and microbiome profiling. Standardizing and reporting input amounts should become a best practice, and the use of spike-in controls with NGS validation is recommended for critical quantitative assays.
The fidelity and efficiency of polymerase chain reaction (PCR) are foundational to genomics, diagnostics, and drug development. A core variable in optimizing these reactions is template DNA concentration. This analysis is framed within a broader thesis investigating how template concentration influences PCR amplification bias. Bias—the non-uniform amplification of different sequences or alleles—can skew results in applications like quantitative PCR, multiplex PCR, next-generation sequencing library preparation, and detection of minor variants. The behavior of the DNA polymerase enzyme is a critical determinant of this bias, as its enzymatic kinetics, processivity, and fidelity interact dynamically with template availability. This guide provides a comparative, technical analysis of major polymerase families across a spectrum of template concentrations.
Polymerase Families: Key Characteristics and Mechanisms
1TaqPolymerase
The standard thermostable polymerase derived from Thermus aquaticus. Lacks 3'→5' exonuclease (proofreading) activity, making it prone to incorporation errors. It exhibits relatively low processivity and is susceptible to generating chimeric artifacts, especially in later cycles with low initial template.
High-Fidelity Polymerases (e.g., Pfu, Q5, Phusion)
Engineered or archaeal-derived polymerases (e.g., from Pyrococcus furiosus) possessing proofreading activity. They have higher fidelity and often higher processivity. Their performance at limiting template concentrations can be constrained by slower elongation rates and, in some formulations, a tendency for more robust exonuclease activity that can degrade primers.
Hot-Start Polymerases
Chemically modified or antibody-inactivated polymerases that are active only at elevated temperatures, preventing nonspecific primer extension during setup. This is crucial for low-template reactions where primer-dimer formation and non-specific amplification can outcompete the target.
Ultra-High Processivity/Performance Polymerases
Next-generation, often engineered blends (e.g., KAPA HiFi, PrimeSTAR GXL) that may combine a proofreading polymerase with a processivity-enhancing factor. Designed for amplifying long, GC-rich, or complex templates with high speed and fidelity across a wide concentration range.
Table 1: Performance Characteristics of Polymerases Across Template Concentration Ranges
| Polymerase Type | Example | Optimal Template Range (copies/µL) | Error Rate (approx.) | Amplification Bias (Low Temp) | Amplification Bias (High Temp) | Key Limiting Factor at Low [Template] |
|---|---|---|---|---|---|---|
| Standard Taq | Native Taq | 10^3 – 10^7 | 2.0 x 10^-4 | High | Moderate | Nonspecific amplification, primer-dimer formation |
| Hot-Start Taq | AmpliTaq Gold | 10^1 – 10^7 | 2.0 x 10^-4 | Moderate | Low | Stochastic sampling, enzyme activation kinetics |
| Proofreading | Pfu Turbo | 10^2 – 10^6 | 1.3 x 10^-6 | Moderate | Low | Slower elongation, potential primer degradation |
| High-Fidelity Blend | Q5 Hot Start | 10^1 – 10^6 | 2.8 x 10^-7 | Low | Low | dNTP imbalance, buffer composition |
| Ultra-HiFi/Processive | KAPA HiFi HS | 1 – 10^5 | ~2.0 x 10^-7 | Very Low | Very Low | Library complexity (for NGS), dNTP depletion |
Table 2: Impact on Common Applications at Limiting Template (<10 copies/µL)
| Application | Recommended Polymerase Type | Rationale | Primary Bias Risk Mitigation |
|---|---|---|---|
| Single-Cell WGA | Ultra-HiFi/Processive | Maximizes genome coverage, minimizes allelic dropout. | Use of minimal cycles, specialized buffers. |
| Circulating Tumor DNA (ctDNA) Detection | Hot-Start High-Fidelity | Suppresses wild-type background, enables variant detection. | Digital PCR partitioning, duplex-specific probes. |
| Ancient DNA NGS Lib Prep | High-Fidelity Blend w/ UDG | Balances damage bypass with fidelity, reduces modern contamination artifacts. | UDG treatment, double-indexed adapters. |
| Multiplex Target Enrichment (>100-plex) | Hot-Start Taq or specialized blends | Optimized for rapid cycling with many primers. | Careful primer design, touchdown PCR. |
Experimental Protocols for Comparative Analysis
Protocol 1: Assessing Amplification Efficiency and Bias
Objective: Quantify PCR efficiency and amplicon representation bias across a template concentration gradient using different polymerases. Materials: See "The Scientist's Toolkit" below. Method:
- Prepare a genomic DNA standard, quantified via digital PCR for absolute copy number.
- Serially dilute the standard across 7 orders of magnitude (e.g., 10^6 to 10^0 copies/µL).
- For each dilution, set up identical 25 µL reactions using 5 different polymerase master mixes. All other components (primers for a multi-target panel, dNTPs, buffer ionic strength) remain constant.
- Run PCR using a calibrated cycler with identical cycling parameters optimized for the most stringent enzyme.
- Analyze products via:
- qPCR Analysis: Plot Cq vs. log template copy number. Calculate amplification efficiency (E = 10^(-1/slope) - 1).
- High-Sensitivity Electrophoresis (e.g., Fragment Analyzer): Quantify yield for each amplicon in a multi-target reaction.
- Next-Generation Sequencing: For bias assessment, use a multi-target amplicon panel. Sequence PCR products and calculate the coefficient of variation (CV) in read depth across targets for each polymerase and template concentration.
Protocol 2: Determining Fidelity at Low Template Concentration
Objective: Measure mutation rate introduced by polymerases when amplifying from a low-copy-number template. Method:
- Use a low-copy-number plasmid (e.g., 100 copies/reaction) containing a lacZα reporter gene as template.
- Amplify the lacZα region with different polymerases using 35 cycles.
- Clone the PCR products into a suitable vector and transform into lacZΩ competent E. coli.
- Plate on X-Gal/IPTG indicator plates. Blue colonies indicate functional lacZα (no mutation), white colonies indicate inactivating mutations.
- Calculate error frequency: (Number of white colonies) / (Total colonies sequenced). Confirm mutations by Sanger sequencing of white clones.
Diagrams and Workflows
Diagram 1: Template Concentration and Polymerase Interaction Logic
Diagram 2: Comparative Performance Experiment Workflow
The Scientist's Toolkit: Essential Research Reagents & Materials
| Item | Function & Relevance to Template Concentration Studies |
|---|---|
| Digital PCR (dPCR) System | Provides absolute quantification of template copy number for creating accurate standard curves, essential for low-concentration work. |
| High-Fidelity Hot-Start Polymerase Mix (e.g., Q5, KAPA HiFi) | Preferred for low-template, high-stakes applications to minimize errors and nonspecific amplification from the first cycle. |
| Nuclease-Free Water & Tubes | Critical for preventing exogenous DNA contamination and degradation when working with low-copy templates. |
| dNTP Mix (balanced, high-purity) | Ensures equal availability of nucleotides to prevent misincorporation and premature termination, especially critical in late cycles of low-template PCR. |
| PCR Additives (e.g., DMSO, Betaine, BSA) | Can help ameliorate bias by stabilizing polymerase, melting secondary structures, and reducing adsorption to tube walls. |
| High-Sensitivity DNA Assay Kits (e.g., Qubit, Fragment Analyzer) | Accurately measure low yields of PCR product without interference from primers or dNTPs. |
| UDG (Uracil-DNA Glycosylase) | Used with dUTP incorporation to prevent carryover contamination, a major concern in high-cycle-number, low-template PCR. |
| Single-Cell or Low-Input Library Prep Kits | Commercial solutions optimized for polymerase and buffer performance at the extreme low end of template concentration. |
The integrity of PCR-based research, from single-cell genomics to circulating tumor DNA analysis, hinges on the faithful amplification of the starting template. A core thesis in modern molecular biology investigates how template concentration influences PCR amplification bias. At low template concentrations (e.g., < 100 pg), stochastic sampling of molecules and early-cycle amplification inefficiencies are dramatically exacerbated, leading to significant distortions in allelic ratios, transcript abundance, and genomic representation. This in-depth review evaluates commercial kits specifically engineered to mitigate these low-input biases, providing a technical guide for researchers demanding precision in their amplification workflows.
Core Mechanisms of Low-Input Bias and Kit Design Principles
Bias in low-input PCR arises from several interrelated phenomena:
- Stochastic Template Sampling: With few DNA/cDNA molecules, the initial aliquot may not be representative of the original population.
- Early-Cycle Efficiency Disparities: Minute differences in primer annealing or polymerase extension efficiency between targets in the first few cycles are irreversibly amplified.
- Adapter Dimer Formation: Ligation-based library prep kits suffer from high adapter-dimer rates when molecule ends are limited.
- Enzyme Processivity and Fidelity: Polymerase characteristics become critical when amplifying damaged or fragmented templates common in low-input samples.
Leading commercial kits address these through:
- Molecular Tagging: Unique Dual Indexes (UDIs) and Unique Molecular Identifiers (UMIs) are incorporated to tag original molecules, enabling bioinformatic correction of PCR duplicates and errors.
- Optimized Enzymology: Use of high-fidelity, processive polymerases with engineered terminal transferase activity for superior end-repair and A-tailing.
- Reduced Reaction Volumes & "Shotgun" Ligation: Miniaturized reactions to increase effective template concentration and specialized ligases for efficient single-molecule capture.
- Suppression of Contaminants: Additives to inhibit adapter-dimer formation and selective bead-based purification.
Comparative Review of Leading Commercial Systems
The following table summarizes key performance metrics for prominent low-input NGS library preparation kits, based on published manufacturer data and independent validation studies.
Table 1: Quantitative Comparison of Low-Input NGS Library Prep Kits
| Kit Name (Manufacturer) | Recommended Input Range (DNA) | UMI/UDI Support | Key Claimed Efficiency | Reported Duplicate Rate (at 100 pg) | Reported Coverage Uniformity (Fold-80 Penalty) |
|---|---|---|---|---|---|
| Nextera XT Low-Input (Illumina) | 100 pg – 1 ng | UDI | Tagmentation-based fragmentation | 25-40% | 1.8 – 2.5 |
| SMARTer ThruPLEX Plasma-Seq (Takara Bio) | 1 pg – 1 ng | UMI | Stem-loop adapter for whole genome amplification | <15% | <1.5 |
| QIAseq Ultralow Input (Qiagen) | 10 pg – 10 ng | UMI | Single-tube, enzyme-free fragmentation | 10-20% | 1.6 |
| Accel-NGS 1S Plus (Swift Biosciences) | 100 pg – 10 ng | UDI | Enzymatic fragmentation & maximized ligation kinetics | 20-30% | 1.7 |
| KAPA HyperPrep (Roche) with UDI | 100 pg – 1 µg | UDI (optional) | High-efficiency ligation chemistry | 30-50%* | 2.0* |
| PicoPLEX Platinum (Takara Bio) | 1-10 cells (~6-60 pg) | No | WGA for single-cell/low-cell | N/A | N/A |
*At the lowest input ranges without specialized optimization.
Detailed Experimental Protocol: Evaluating Kit Bias
To empirically assess low-input bias within the context of template concentration research, the following comparative protocol is employed.
Protocol: Comparative Analysis of Allelic Dropout and Coverage Uniformity
Objective: To quantify PCR amplification bias introduced by different commercial kits at serially diluted template concentrations.
I. Materials and Reagent Setup
- Control Genomic DNA: Reference standard (e.g., NA12878, 10 ng/µL).
- Test Kits: Selected kits from Table 1.
- Quantification: Qubit dsDNA HS Assay Kit, qPCR-based library quantification kit.
- Sequencing Platform: Illumina NextSeq 550/2000, 2x150 bp.
- Bioinformatics Tools: FastQC, BWA-MEM, Picard (
CollectHsMetrics), and in-house scripts for UMI/UDI collapsing and allele frequency calculation.
II. Step-by-Step Procedure
- Template Dilution: Prepare a dilution series of control gDNA: 10 ng, 1 ng, 100 pg, 10 pg in low-EDTA TE buffer. Use wide-bore tips for <1 ng dilutions.
- Parallel Library Preparation: For each input amount, perform library construction with each test kit in triplicate. Strictly adhere to manufacturer protocols. Include a no-template control (NTC) for each kit.
- Library QC: Quantify final libraries using both fluorometric (Qubit) and qPCR methods. Calculate the qPCR/Qubit ratio as an indicator of adapter-dimer/ill-formed product presence.
- Normalization & Pooling: Normalize all libraries to 4 nM based on qPCR concentration. Pool equimolar amounts.
- Sequencing: Sequence the pooled library to a minimum depth of 5 million paired-end reads per replicate.
- Data Analysis:
- Alignment: Map reads to the human reference genome (hg38).
- Duplicate Marking: Use kit-appropriate tools (e.g.,
fgbiofor UMI-aware collapsing). - Bias Metrics: Calculate:
- Fold-80 Base Penalty: (Percent of bases at or above 80% of mean coverage) from Picard output.
- Allelic Dropout Rate: At known heterozygous SNP loci (dbSNP), calculate the percentage where the minor allele frequency deviates >15% from the expected 50%.
- Library Complexity: Estimate unique molecules from pre-deduplication metrics.
The Scientist's Toolkit: Essential Reagents for Low-Input Bias Research
| Item | Function in Protocol |
|---|---|
| NA12878 gDNA (Coriell) | Standardized, high-quality human reference DNA for benchmarking. |
| Low-EDTA TE Buffer (pH 8.0) | Prevents chelation of Mg2+, critical for enzymatic reactions at low concentrations. |
| ERCC RNA Spike-In Mix (Thermo Fisher) | For RNA/cDNA workflows, provides external controls for quantification and bias detection. |
| KAPA Library Quantification Kit (Roche) | qPCR-based assay specific to adapter sequences; critical for accurate library pooling. |
| AMPure XP Beads (Beckman Coulter) | Size-selective magnetic beads for clean-up and adapter-dimer removal. |
| High-Fidelity DNA Polymerase (e.g., KAPA HiFi) | Often used in place of kit polymerases for head-to-head enzyme comparisons. |
| Digital PCR System (e.g., Bio-Rad QX200) | Provides absolute molecule counting for input template quantification. |
Visualizing Workflows and Bias Mechanisms
Diagram 1: Sources of Bias in Low-Input NGS Workflow
Diagram 2: Core Library Prep Strategies of Reviewed Kits
The management of low-input bias is not solved by a single kit but requires strategic pairing of technology with experimental goal. For absolute quantification and variant detection from ultra-low inputs (e.g., ctDNA), kits with integrated UMI (e.g., QIAseq, SMARTer ThruPLEX) are non-negotiable. For applications requiring high library complexity and uniform coverage from modest low inputs (100 pg-1 ng), optimized ligation-based kits with UDIs (e.g., Accel-NGS) show superior performance. Tagmentation-based kits offer speed but may exhibit higher bias at the extreme low end. Ultimately, validating any kit within the specific template concentration window of the intended experiment is paramount, as the influence of input mass on amplification bias remains the defining variable in achieving scientifically robust results.
The reproducibility and accuracy of Polymerase Chain Reaction (PCR) and Next-Generation Sequencing (NGS) applications are fundamentally dependent on the quality of the input nucleic acid template. Within the broader thesis on How does template concentration influence PCR amplification bias research, establishing a robust Quality Control (QC) pipeline for template concentration is the critical first step. Amplification bias—the non-proportional representation of sequences after PCR—is heavily influenced by initial template concentration. Low concentrations exacerbate stochastic sampling effects and primer dimer formation, while high concentrations can lead to enzyme inhibition, substrate depletion, and increased chimera formation. This guide details the criteria and methodologies for determining acceptable template concentration to minimize such biases and ensure data integrity in genomics research and diagnostic assay development.
Core Criteria and Quantitative Data for Template QC
Acceptable template concentration is not a single value but a range dependent on the downstream application. The following table summarizes key criteria and associated quantitative benchmarks.
Table 1: Acceptable Template Concentration Ranges by Application and Associated QC Metrics
| Application | Recommended Concentration Range | Key QC Metric | Acceptable Purity (A260/A280) | Critical Concern |
|---|---|---|---|---|
| Standard PCR (qPCR/dPCR) | 0.1 - 100 ng/µL (genomic DNA)1 - 50 pg/µL (cDNA) | Fluorometry (Qubit) | 1.8 - 2.0 (DNA)1.9 - 2.1 (RNA) | Inhibition, stochastic bias at low end. |
| Amplicon NGS (16S rRNA, etc.) | 0.2 - 10 ng/µL | Fluorometry (Qubit) | 1.8 - 2.0 | Amplification bias, chimera formation. |
| Whole Genome Sequencing (WGS) | 0.1 - 200 ng/µL (varies by platform) | Fluorometry (Qubit) | 1.8 - 2.0 | Uneven coverage, GC bias. |
| RNA-Seq | 10 - 100 ng/µL (total RNA) | Fluorometry (Qubit) / RIN | 1.9 - 2.1 (RNA) | Degradation, ribosomal bias. |
| Single-Cell Sequencing | Single-cell lysate (pg levels) | Amplification Success Rate | N/A | Extreme stochastic bias, allele dropout. |
Table 2: Impact of Template Concentration on Amplification Artifacts
| Template Status | Concentration Effect | Primary Bias Introduced | Observed Outcome |
|---|---|---|---|
| Too Low | <0.1 ng/µL (DNA); <1 pg/µL (cDNA) | Stochastic Sampling Error | Allele Dropout (ADO), increased Cq variance, false negatives. |
| Optimal | Within application-specific range (Table 1) | Minimal Systematic Bias | High reproducibility, even coverage, accurate quantification. |
| Too High | >200 ng/µL (PCR); beyond kit linearity | Enzyme/Reagent Inhibition, Substrate Depletion | Poor amplification efficiency, increased chimera rate, sequence errors. |
Experimental Protocols for Template Quantification and QC
Protocol 1: Two-Step Quantitative QC using UV-Vis and Fluorometry Objective: Accurately determine nucleic acid concentration and assess purity. Materials: Spectrophotometer (NanoDrop), Fluorometer (Qubit), Qubit dsDNA HS/BR Assay Kits, low-bind tubes.
- UV-Vis Spectrophotometry (Purity Check):
- Blank instrument with elution buffer (e.g., TE, nuclease-free water).
- Apply 1-2 µL of sample. Record concentrations at A260 and ratios A260/A280 & A260/230.
- Criteria: A260/A280 ~1.8 (DNA) or ~2.0 (RNA). A260/A230 >2.0 indicates low organic/inorganic contaminant carryover.
- Fluorometric Quantification (Accurate Concentration):
- Prepare Qubit working solution per kit instructions.
- Add 1-10 µL of sample (within kit's linear range) to 190-199 µL of working solution in a Qubit assay tube.
- Vortex, incubate 2 minutes, read on Qubit.
- Note: Fluorometry is specific to nucleic acids and is not affected by common contaminants, providing the gold-standard concentration for critical applications.
Protocol 2: qPCR-Based Functional QC for Amplifiability Objective: Assess the functional quality and amplifiable concentration of template, especially for low-input or challenging samples. Materials: Sensitive qPCR master mix (e.g., TaqMan, SYBR Green), primers/probe for a single-copy reference gene, thermal cycler.
- Dilution Series: Prepare a 4-5 point serial dilution (e.g., 1:10) of the template sample.
- qPCR Setup: Run each dilution in triplicate alongside a standard curve of known concentration (e.g., genomic DNA control).
- Analysis: Determine the amplifiable concentration by comparing Cq values to the standard curve. Calculate amplification efficiency (should be 90-110%). Significant deviation from fluorometric concentration indicates PCR inhibitors or degraded template.
Visualization of the QC Pipeline and Bias Mechanisms
Diagram Title: Nucleic Acid Template QC Decision Pipeline
Diagram Title: How Template Concentration Drives PCR Amplification Bias
The Scientist's Toolkit: Research Reagent Solutions
Table 3: Essential Reagents and Kits for Template QC
| Item | Function/Benefit | Example Product Types |
|---|---|---|
| Fluorometric DNA/RNA Assay Kits | Dye-based specific quantification of dsDNA, ssDNA, or RNA. Unaffected by common contaminants like salts or protein. | Qubit dsDNA HS/BR Assay, Quant-iT PicoGreen. |
| Broad-Range Spectrophotometer | Rapid assessment of nucleic acid concentration and purity (A260/A280, A260/A230 ratios). | NanoDrop One, Take3 for low volume. |
| qPCR Master Mix with Inhibitor Resistance | For functional QC. Robust enzymes and buffers detect inhibitors and determine amplifiable concentration. | TaqMan Environmental Master Mix, SYBR Green PCR kits. |
| Automated Electrophoresis Systems | Assess integrity and size distribution of DNA/RNA (critical for NGS). Replaces archaic agarose gels. | Agilent TapeStation, Bioanalyzer. |
| Solid-Phase Reversible Immobilization (SPRI) Beads | For post-extraction clean-up to normalize concentration, remove primers, and size-select. | AMPure XP, CleanNGS beads. |
| Digital PCR Master Mix & Chips | Absolute quantification without a standard curve. Ideal for validating low-concentration templates and detecting rare variants. | ddPCR Supermix for Probes, chip-based dPCR systems. |
| Nuclease-Free Water & TE Buffer | Critical for sample dilution and elution to prevent degradation and ensure accurate measurements. | Molecular biology grade, pH-stabilized (TE: 10 mM Tris, 1 mM EDTA, pH 8.0). |
Conclusion
Template concentration is not merely a setup variable but a primary determinant of PCR amplification bias, affecting data accuracy from basic research to clinical diagnostics. A foundational understanding of stochastic and competitive effects is crucial. Methodologically, deliberate titration and optimization are non-negotiable for precise applications. Troubleshooting must proactively address concentration-related artifacts. Finally, validation with technologies like dPCR and NGS is essential to fully characterize and correct for residual bias. Moving forward, integrating template concentration as a key experimental design parameter will enhance reproducibility, especially in sensitive fields like minimal residual disease detection, single-cell genomics, and microbiome analysis. Future assay development should focus on polymerases and chemistries engineered to maintain fidelity across a broader dynamic range of template inputs.