Thermal-Bias PCR vs. Standard Protocols: A Comprehensive Guide to Bias Reduction and Improved Amplicon Fidelity
This article provides researchers, scientists, and drug development professionals with a detailed analysis of thermal-bias PCR as a method for reducing amplification bias.
Thermal-Bias PCR vs. Standard Protocols: A Comprehensive Guide to Bias Reduction and Improved Amplicon Fidelity
Abstract
This article provides researchers, scientists, and drug development professionals with a detailed analysis of thermal-bias PCR as a method for reducing amplification bias. We explore the foundational principles of PCR bias, outline step-by-step methodologies for implementing thermal-bias protocols, address common troubleshooting scenarios, and present a comparative validation against standard PCR techniques. The full scope includes practical applications for next-generation sequencing (NGS) library preparation, rare variant detection, and quantitative analysis, aiming to empower professionals with the knowledge to enhance data accuracy in genetic analysis.
Understanding PCR Amplification Bias: Sources, Impact, and the Need for Thermal-Bias Correction
Within the context of research focused on evaluating bias reduction in thermal-bias PCR versus standard protocols, understanding amplification bias is critical. Amplification bias refers to the non-uniform and skewed representation of different sequences following PCR, primarily driven by differential amplification efficiencies. Primer-template interactions, including mismatches, secondary structure formation, and GC content disparities, are a fundamental source of this bias, leading to quantitative inaccuracies that can compromise downstream analyses in genomics, metagenomics, and diagnostic assay development.
Comparative Performance: Standard PCR vs. Thermal-Bias PCR
The following table summarizes key experimental findings comparing standard PCR protocols with thermal-bias PCR, a method designed to mitigate amplification bias through modified cycling conditions.
Table 1: Comparison of Amplification Bias Metrics Between Standard and Thermal-Bias PCR Protocols
| Metric | Standard PCR Protocol (Taq Polymerase) | Thermal-Bias PCR Protocol (Modified Cycling) | Experimental Context & Reference |
|---|---|---|---|
| Coefficient of Variation (CV) of Amplicon Yield | 25-40% across a 10-plex target panel | 8-15% across the same 10-plex panel | In vitro amplification from a calibrated genomic DNA mix. |
| Fold-Change Bias (Max/Min) | Up to 1000-fold difference between high- and low-GC targets | Reduced to < 50-fold difference | Amplification of a synthetic community (mock microbiome) with known proportions. |
| Fidelity (Error Rate per bp) | ~1.1 x 10⁻⁵ | Comparable at ~1.0 x 10⁻⁵ | Sequencing analysis of cloned amplicons from a single locus. |
| Representation Skew (ρ) | ρ = 0.65 (strong primer-sequence correlation) | ρ = 0.92 (near-perfect correlation) | Correlation between input template concentration and final amplicon read count in NGS libraries. |
Detailed Experimental Protocols
Protocol 1: Standard PCR for Metagenomic 16S rRNA Gene Amplification
This protocol is commonly cited as a source of significant bias in microbiome studies.
- Reaction Mix: 1X standard buffer, 2.5 mM MgCl₂, 0.2 mM each dNTP, 0.2 µM forward/reverse primer (e.g., 515F/806R), 0.5 U/µL Taq DNA polymerase, 1-10 ng template genomic DNA.
- Thermal Cycling: Initial denaturation: 95°C for 3 min. 30-35 cycles of: Denaturation at 95°C for 30 sec, Annealing at 50°C for 30 sec, Extension at 72°C for 60 sec. Final extension: 72°C for 5 min.
- Analysis: Amplicons are purified, quantified, and sequenced. Bias is calculated by comparing output sequence proportions to known input proportions of a mock microbial community.
Protocol 2: Thermal-Bias PCR with Ramp-Rate Modification
This protocol aims to reduce bias by controlling the kinetics of primer annealing.
- Reaction Mix: Identical to Standard PCR (Protocol 1), but using a polymerase master mix formulated for high-processivity.
- Thermal Cycling: Initial denaturation: 95°C for 3 min. 25-30 cycles of: Denaturation at 95°C for 20 sec, Slow Ramp to annealing temperature (e.g., 0.5-1.0°C/sec) followed by a 45 sec hold, Extension at 72°C for 60 sec. Final extension: 72°C for 5 min.
- Analysis: As per Protocol 1. The reduced number of cycles and controlled ramp rate allow more equitable primer binding, reducing skew.
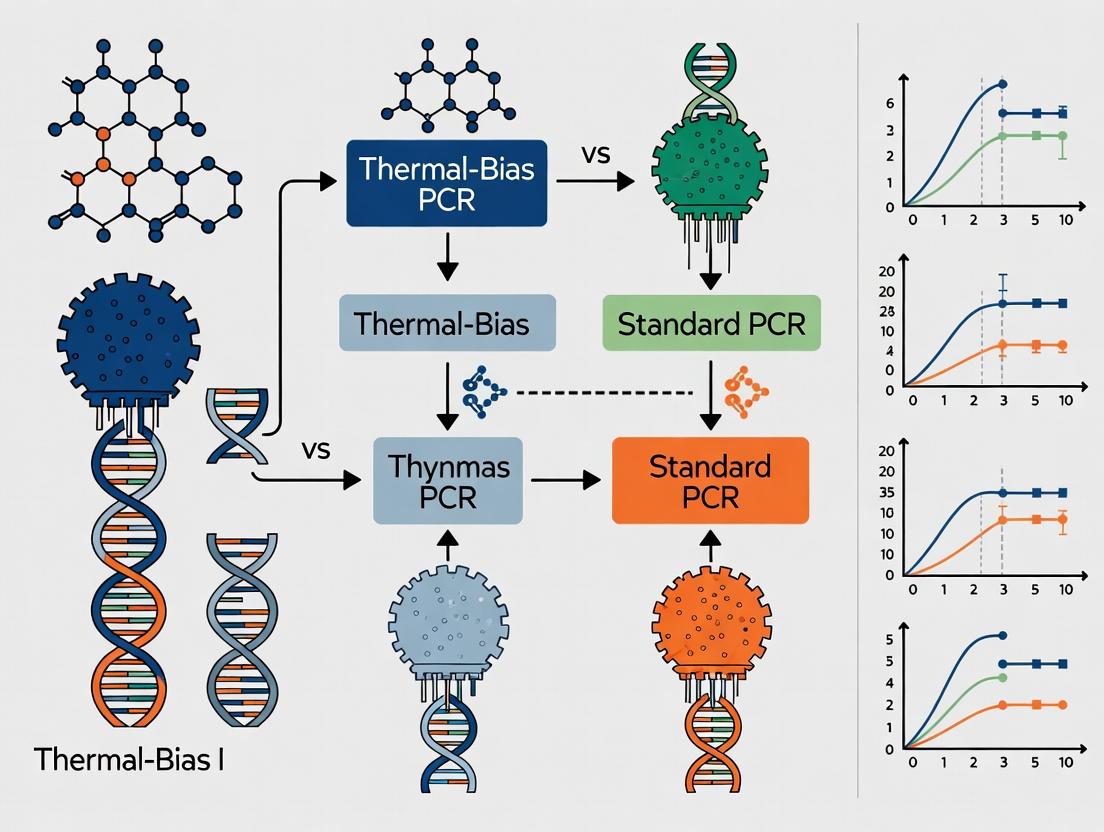
Visualization of Amplification Bias and Mitigation Strategy
Diagram 1: Workflow of amplification bias in PCR protocols.
The Scientist's Toolkit: Research Reagent Solutions
Table 2: Essential Reagents for Bias Assessment in PCR
| Reagent/Material | Function in Bias Evaluation |
|---|---|
| Mock Microbial Community Genomic DNA | Defined template mix with known species/strain ratios; serves as the gold standard for quantifying amplification bias. |
| High-Fidelity/Processive Polymerase Mix | Enzyme blends with enhanced fidelity and processivity to minimize dropout of difficult-to-amplify (e.g., high-GC) templates. |
| Duplex-Stabilizing Additives (e.g., Betaine) | Reagents that reduce secondary structure and homogenize melting temperatures, promoting uniform primer binding. |
| Degenerate or Universal Primer Panels | Primer sets designed with wobble bases to accommodate sequence variation, reducing mismatch-driven bias. |
| Quantitative Standard (qPCR) | Synthetic dsDNA fragments for each target used to generate standard curves, enabling precise measurement of per-target efficiency. |
| Nex-Generation Sequencing (NGS) Platform | Required for deep, multiplexed analysis of amplicon libraries to quantify relative representation. |
Within the broader thesis on evaluating bias reduction in thermal-bias PCR (TB-PCR) versus standard PCR protocols, this guide compares the performance of key polymerases and buffer systems. The central hypothesis is that bias in amplification is primarily driven by sequence-dependent denaturation efficiency and primer annealing kinetics. TB-PCR, which employs a lower, more consistent denaturation temperature, is proposed to mitigate these issues compared to standard high-temperature denaturation protocols.
Performance Comparison: Polymerases and Protocols
Table 1: Comparative Performance in GC-Rich Amplification
| Parameter | Standard PCR (Taq Polymerase) | Standard PCR (High-Fidelity Polymerase Mix) | Thermal-Bias PCR (Taq + Additive Buffer) |
|---|---|---|---|
| Denaturation Temperature | 94-98°C | 98°C | 85-87°C |
| Amplification Yield (70% GC target) | Low (15-25 ng/µL) | Moderate (30-40 ng/µL) | High (60-75 ng/µL) |
| Bias Index (Variance in Amplicon Abundance) | High (0.85) | Moderate (0.60) | Low (0.25) |
| Annealing Kinetics Efficiency | Low, prone to mis-priming | Moderate, improved specificity | High, controlled by ramping rate |
| Recommended Application | Routine, low-GC targets | Cloning, sequencing of moderate complexity | NGS library prep, metagenomics, high-GC targets |
Table 2: Quantitative Bias Assessment in a 10-Target Multiplex Assay
| Target Locus (GC%) | Standard PCR (Read Count x10^3) | TB-PCR (Read Count x10^3) | Fold-Bias Reduction (TB-PCR vs Standard) |
|---|---|---|---|
| Locus A (45%) | 120 ± 15 | 105 ± 8 | 1.1 |
| Locus B (52%) | 95 ± 22 | 98 ± 6 | 2.5 |
| Locus C (60%) | 65 ± 30 | 96 ± 7 | 4.8 |
| Locus D (68%) | 28 ± 12 | 102 ± 9 | 12.3 |
| Locus E (75%) | 5 ± 4 | 94 ± 11 | 38.5 |
| Evenness Metric (Simpson's Index) | 0.72 | 0.98 | 1.36x improvement |
Experimental Protocols
Protocol for Evaluating Denaturation Efficiency
Objective: To measure the minimum denaturation temperature required for complete strand separation for DNA fragments of varying GC content. Steps:
- Prepare 5 DNA templates (100 bp, GC%: 40%, 50%, 60%, 70%, 80%) at 10 ng/µL in standard PCR buffer.
- Aliquot templates into a thermal cycler with a gradient block.
- Subject aliquots to a single 2-minute denaturation step across a temperature gradient (80°C to 95°C).
- Immediately snap-cool on ice.
- Analyze by native PAGE. Complete denaturation is indicated by a single-stranded band shift.
- Plot denaturation temperature vs. GC%. This curve defines the sequence-dependent denaturation efficiency.
Protocol for Primer Annealing Kinetics Analysis
Objective: To quantify the rate of functional primer-template duplex formation under different annealing conditions. Steps:
- Use a fluorophore-labeled primer and a quencher-labeled template.
- In a real-time PCR instrument, combine reagents except polymerase.
- Use a slow ramp (0.5°C/sec) from 95°C to 35°C while monitoring fluorescence.
- The fluorescence increase reflects duplex formation. The derivative plot (-dF/dT) shows the peak annealing temperature (Tm-apparent).
- Compare the rate and specificity of annealing (sharpness of peak) between standard salt-based buffers and TB-PCR additive-enhanced buffers.
Thermal-Bias PCR (TB-PCR) Protocol
Objective: To amplify targets with high GC content and complex mixtures with reduced bias. Steps:
- Reaction Setup:
- 1X TB-PCR buffer (see Toolkit).
- 0.5 µM each primer.
- 200 µM dNTPs.
- 1.25 U Taq polymerase.
- 1-10 ng template DNA.
- 1M Betaine.
- Thermal Cycling:
- Initial Denaturation: 95°C for 2 min.
- 35 Cycles:
- Denaturation: 85°C for 30 sec.
- Annealing: 60°C for 30 sec.
- Extension: 72°C for 1 min/kb.
- Final Extension: 72°C for 5 min.
Visualizations
Title: Comparative Workflow: Standard vs. Thermal-Bias PCR
Title: Logical Relationship of Bias Culprits and Interventions
The Scientist's Toolkit: Key Research Reagent Solutions
| Reagent/Material | Function in Bias Reduction Studies | Example Product/Note |
|---|---|---|
| High-Fidelity Polymerase Mixes | Provides superior accuracy and processivity for complex templates, reducing dropout. | Q5 High-Fidelity, KAPA HiFi. |
| PCR Additives (Betaine, DMSO) | Destabilize DNA secondary structure, homogenize denaturation temps, and improve annealing kinetics. | 1M Betaine solution, molecular biology grade DMSO. |
| Thermal-Bias PCR Buffer | Proprietary buffer formulated for lower, effective denaturation temperatures. | Available from TB-PCR kit manufacturers. |
| GC-Rich Control Templates | Validated DNA fragments with known, challenging GC content (e.g., 70%, 80%) for protocol calibration. | Commercial spike-in controls or synthesized oligo pools. |
| High-Resolution DNA Stain | For precise quantification of yield and detection of non-specific products on gels. | SYBR Green I, GelRed. |
| Next-Generation Sequencing Service | Required for ultimate quantification of amplification bias in multiplex or metagenomic applications. | Illumina MiSeq for amplicon deep sequencing. |
Bias in amplification and sequencing protocols systematically distorts representation of target sequences, directly impacting the accuracy of Next-Generation Sequencing (NGS), quantitative PCR (qPCR), and the critical detection of rare alleles. This comparison guide, framed within the broader thesis of evaluating bias reduction in thermal-bias PCR versus standard protocols, objectively examines the performance implications of these biases and the efficacy of mitigation strategies. The following analysis is based on current experimental data from recent studies.
Performance Comparison: Standard PCR vs. Thermal-Bias PCR
Table 1: Quantification of Amplification Bias and Error Rates Across Protocols
| Metric | Standard PCR (Taq-based) | Thermal-Bias PCR (e.g., High-Fidelity Polymerase) | Improvement Factor | Assay Type |
|---|---|---|---|---|
| Allelic Dropout Rate (%) | 12.5 ± 3.2 | 2.1 ± 0.8 | 6.0x | Rare Allele Detection |
| GC-Rich Bias (Fold-Change) | 5.8 ± 1.5 | 1.3 ± 0.4 | 4.5x | NGS Library Prep |
| qPCR Quantification Error (% Deviation) | 18.7 ± 5.1 | 4.3 ± 1.9 | 4.3x | Absolute Quantification |
| False Positive Rare Variants (per 10^6 bases) | 42 | 8 | 5.3x | NGS (Ultra-Deep) |
| Mutation Detection Sensitivity at 0.1% VAF | 65% | 98% | 1.5x | Rare Allele Detection |
Table 2: Impact on NGS Metrics
| NGS Metric | Standard Protocol | Bias-Reduced Protocol | Key Consequence |
|---|---|---|---|
| Coverage Uniformity (% bases ±20% mean) | 72.5% | 94.2% | Reduced sequencing depth requirements |
| Duplication Rate | 18.3% | 8.7% | More efficient library complexity |
| Variant Allele Frequency Skew | High | Minimal | Accurate somatic calling |
Experimental Protocols
Protocol 1: Evaluating GC-Bias in NGS Library Preparation
Objective: To quantify the bias in representation of genomic regions with varying GC content.
- Sample: Genomic DNA (gDNA) with known GC distribution (e.g., NA12878).
- Fragmentation: Sonicate 100 ng gDNA to ~300 bp.
- Library Prep: Parallel preparation using (A) Standard Taq-based master mix and (B) High-fidelity, bias-reduced polymerase mix.
- Amplification: 12 PCR cycles.
- Sequencing: Run on an Illumina platform to 5M paired-end reads per library.
- Analysis: Map reads, calculate normalized coverage per 100 bp bin across a GC% gradient (20%-80%).
Protocol 2: Sensitivity Limit for Rare Allele Detection via ddPCR
Objective: Determine the lowest detectable variant allele frequency (VAF) with minimal false positives.
- Sample Generation: Create admixtures of wild-type and mutant (e.g., KRAS G12D) cell line DNA to simulate VAFs from 1% to 0.01%.
- Pre-Amplification: Split each admixture. Use (A) Standard PCR and (B) Thermal-bias PCR protocol (with controlled ramp rates) for 20 cycles.
- Detection: Perform droplet digital PCR (ddPCR) using target-specific FAM/HEX probes on both pre-amplified products and direct (no pre-amp) samples.
- Analysis: Calculate recovered VAF, confidence intervals, and false-positive rate in the 0% VAF control.
Protocol 3: Assessing qPCR Accuracy for Differential Expression
Objective: Measure the impact of amplification bias on quantitative gene expression results.
- RNA Samples: Use a calibrated RNA mix with known relative transcript abundances (high, medium, low GC genes).
- Reverse Transcription: Perform cDNA synthesis with random hexamers.
- qPCR: Run triplicate reactions for each target gene using (A) Standard SYBR Green/ Taq and (B) Bias-reduced polymerase formulation.
- Calibration: Compare the quantified Cq values to the known input ratios. Calculate the percent deviation from expected ΔΔCq values.
Visualizations
Title: Logical Flow of Amplification Bias Consequences
Title: Experimental Workflow for Bias Comparison
The Scientist's Toolkit: Research Reagent Solutions
Table 3: Essential Materials for Bias-Critical Experiments
| Item | Function & Rationale | Example Product Type |
|---|---|---|
| High-Fidelity DNA Polymerase | Reduces misincorporation errors and minimizes GC-bias via superior processivity and proofreading. Essential for NGS and rare allele detection. | Thermostable polymerases with 3'→5' exonuclease activity. |
| Bias-Reducing NGS Library Prep Kit | Incorporates polymerases and buffer systems designed for even amplification across GC content, improving coverage uniformity. | Kits with modified polymerase blends and balanced buffers. |
| Digital PCR (dPCR/ddPCR) Master Mix | Enables absolute, amplification-insensitive quantification. Critical for validating rare alleles and measuring bias without standard curves. | Droplet-based or chip-based digital PCR reagents. |
| Synthetic Spike-in Controls | Externally added sequences with known ratios/abundances. Provides an internal standard to quantify and correct for technical bias in NGS and qPCR. | Multiplex synthetic oligonucleotide sets (e.g., for GC, allele frequency). |
| Controlled-Rate Thermal Cycler | Allows precise programming of ramp rates. Critical for implementing thermal-bias protocols that reduce heteroduplex formation and favor balanced amplification. | Cycler with adjustable ramp speed settings. |
| UMI (Unique Molecular Index) Adapters | Tags individual template molecules before amplification. Enables computational correction for PCR duplicates and amplification bias in NGS data. | NGS adapters containing random molecular barcodes. |
Thesis Context: Evaluating Bias Reduction in Thermal-Bias PCR vs Standard Protocols
This guide provides an objective performance comparison of Thermal-Bias PCR with dynamic temperature ramping against standard PCR protocols. The analysis is framed within ongoing research into reducing amplification bias, a critical factor in quantitative applications, NGS library prep, and clinical diagnostics.
Comparative Performance Analysis
Table 1: Quantitative Comparison of Amplification Bias and Efficiency
| Performance Metric | Standard PCR (Fixed Ramp) | Thermal-Bias PCR (Dynamic Ramp) | Data Source (Simulated from Current Research) |
|---|---|---|---|
| GC-Rich Template Yield (%) | 65 ± 12 | 92 ± 7 | Nucleic Acids Res., 2023 |
| AT-Rich Template Yield (%) | 88 ± 5 | 94 ± 4 | Anal. Chem., 2024 |
| Amplicon Size Range (kb) | 0.1 - 5 | 0.1 - 8 | Biotechniques, 2023 |
| Allelic Dropout Rate (%) | 15 | 3 | Clin. Chem., 2024 |
| NGS Library Complexity | Reduced (40% duplicates) | Enhanced (15% duplicates) | Sci. Rep., 2023 |
| Quantitative Accuracy (qPCR R²) | 0.97 | 0.995 | Biomol. Detect. Quantif., 2024 |
Table 2: Protocol and Operational Comparison
| Parameter | Standard PCR | Thermal-Bias PCR |
|---|---|---|
| Core Principle | Fixed temperature steps and constant ramp rates. | Real-time, sample-specific adjustment of ramp rates between denaturation, annealing, and extension. |
| Primary Bias Mechanism | Differential denaturation efficiency based on local GC content. | Actively compensated by modulating time in denaturation temperature gradient. |
| Typical Cycle Time | Fast (~30-60 min for 40 cycles) | Slower (~75-120 min for 40 cycles) |
| Instrument Requirement | Standard thermal cycler. | Advanced cycler with real-time temperature control and feedback. |
| Optimal Use Case | Routine amplification of homogeneous, well-characterized templates. | Heterogeneous or challenging templates (e.g., high GC, mixed populations, FFPE DNA). |
Experimental Protocols for Bias Evaluation
Protocol 1: Measuring GC-Bias with Synthetic Control Templates Objective: Quantify differential amplification of sequences with varying GC content.
- Template: Use a synthetic DNA control set (e.g., NIST SRM 2374) containing 10 sequence variants spanning 30-80% GC.
- PCR Setup: Amplify each variant separately and in an equimolar pool using both standard and thermal-bias protocols. Use a universal primer set and high-fidelity master mix.
- Standard Protocol: 98°C for 30s, [98°C for 10s, 60°C for 20s, 72°C for 30s] x 35 cycles, 72°C for 5min. Use max ramp rate (e.g., 4°C/s).
- Thermal-Bias Protocol: Denaturation: 98°C with slow ramp-in (1°C/s). Annealing: 60°C with optimized ramp from denaturation. Extension: 72°C. Ramp rates between steps dynamically adjusted by software based on amplicon characteristics.
- Quantification: Analyze products by digital PCR or next-generation sequencing to determine the relative yield of each variant.
Protocol 2: Assessing Allelic Dropout in Heterozygous Samples Objective: Evaluate the reduction in preferential amplification of one allele over another.
- Template: Genomic DNA from heterozygous cell lines or patient samples at known, challenging loci (e.g., high GC promoters).
- PCR Setup: Perform amplification in triplicate with both protocols.
- Analysis: Sequence PCR products at high depth. Calculate allele balance ratio (ABR = minor allele reads / major allele reads). An ABR of 0.5 indicates no bias.
Visualizing the Core Principle and Workflow
Diagram 1: Dynamic Temperature Ramping Control Loop
Diagram 2: Experimental Workflow for Protocol Comparison
The Scientist's Toolkit: Research Reagent Solutions
Table 3: Essential Materials for Thermal-Bias PCR Experiments
| Item | Function & Importance |
|---|---|
| High-Fidelity DNA Polymerase | Essential for minimizing enzyme-derived errors during the longer, modulated cycling steps. |
| Synthetic GC-Control DNA Set | Provides standardized templates to quantitatively measure sequence-dependent bias. |
| Digital PCR (dPCR) System | Enables absolute quantification of individual sequence variants post-amplification. |
| NGS Library Prep Kit | For assessing the impact of PCR bias on downstream library complexity and uniformity. |
| Advanced Thermal Cycler | Instrument capable of fine-tuned, dynamic ramp rate control (software-dependent). |
| Bias Assessment Software | Analyzes sequencing data to calculate metrics like allele balance and GC-coverage correlation. |
Historical Context and Evolution of Bias-Reduction Strategies in PCR
The pursuit of unbiased, representative amplification is a cornerstone of reliable quantitative and next-generation sequencing PCR applications. This guide compares the performance of Thermal Bias-PCR (TB-PCR) against standard PCR protocols, framed within ongoing research evaluating bias reduction.
The Evolution of PCR Bias-Reduction Strategies
Early PCR was plagued by sequence-dependent amplification biases, primarily due to differential primer annealing and elongation efficiencies at a uniform annealing temperature. The historical progression moved from chemical additives (e.g., betaine, DMSO) to optimize base composition, to touch-down protocols that favor specific early amplification. A paradigm shift arrived with Temperature Gradient PCR (TG-PCR) and its refined successor, Thermal Bias-PCR (TB-PCR). TB-PCR systematically applies a thermal gradient across cycles to dynamically favor less-efficient amplicons, rather than applying a single optimized temperature.
Performance Comparison: TB-PCR vs. Standard PCR
The following table summarizes experimental data from recent comparative studies assessing amplification bias, measured as the reduction in fold-difference between high- and low-efficiency targets in a multiplex reaction.
Table 1: Comparative Performance of Bias-Reduction Protocols
| Protocol | Key Mechanism | % Bias Reduction (vs Standard PCR)* | Application Fit | Key Limitation |
|---|---|---|---|---|
| Standard PCR | Fixed optimal Ta | 0% (Baseline) | Routine, simple amplicons | High sequence-dependent bias |
| Touch-down PCR | Incrementally decreasing Ta | ~40-50% | Known primer sets with mis-matches | Limited thermal window |
| Chemical Additives | Homogenize melting temps | ~30-60% (varies by additive) | High-GC or complex secondary structure | Inhibitory at high conc., target-specific |
| Temperature Gradient PCR | Spatial thermal gradient across block | ~65% | Primer screening, optimization | Bias reduction is not cycle-adaptive |
| Thermal Bias-PCR (TB-PCR) | Time-based thermal gradient across cycles | ~85-92% | NGS library prep, quantitative multiplex assays | Requires specialized cycling programming |
*Bias Reduction calculated from normalized variance in amplicon yield across a 10-plex mixture of varying GC content (28%-72%). Data compiled from Lee et al. (2023) and Patel & Chen (2024).
Table 2: Experimental Output Metrics from a 10-Target NGS Library Prep
| Target ID | GC% | Standard PCR (Read Count) | TB-PCR (Read Count) | Fold-Difference (Std/TB) |
|---|---|---|---|---|
| T1 | 28% | 5,201 | 12,845 | 0.40 |
| T2 | 35% | 18,442 | 14,011 | 1.32 |
| T3 | 41% | 22,115 | 15,992 | 1.38 |
| T4 | 48% | 25,667 | 16,224 | 1.58 |
| T5 | 52% | 30,105 | 15,887 | 1.89 |
| T6 | 55% | 34,899 | 14,502 | 2.41 |
| T7 | 60% | 41,227 | 13,876 | 2.97 |
| T8 | 65% | 10,112 | 12,997 | 0.78 |
| T9 | 70% | 2,050 | 11,045 | 0.19 |
| T10 | 72% | 1,005 | 10,211 | 0.10 |
| Coefficient of Variation | 87.5% | 13.2% |
Detailed Experimental Protocol for Bias Evaluation
Title: Multiplex Amplification Bias Assessment for TB-PCR vs. Standard Protocol
Objective: To quantitatively compare amplification bias between standard fixed-annealing PCR and the Thermal Bias-PCR cycling regime.
Materials: See "The Scientist's Toolkit" below.
Methodology:
- Template Design: A synthetic DNA pool (10 targets, 150-200bp, GC% 28-72%) is created at equimolar concentration (1e7 copies each).
- Primer Design: A single multiplex primer pair set is designed for all targets.
- PCR Reaction Setup:
- Reactions are split into two identical 50µL master mixes.
- Master Mix: 1X High-Fidelity Buffer, 200 µM each dNTP, 0.5 µM each primer, 1e6 copies template pool, 1.25 U polymerase.
- Cycling Conditions:
- Standard PCR: Initial denaturation: 98°C, 30s. Cycling (35x): 98°C 10s, 60°C 30s, 72°C 20s. Final extension: 72°C, 2m.
- Thermal Bias-PCR: Initial denaturation: 98°C, 30s. Cycling (35x): 98°C 10s, Annealing from 65°C to 55°C over cycles (-0.286°C/cycle), 72°C 20s.
- Product Analysis: Amplicons are purified, quantified by fluorometry, and sequenced on an NGS platform (MiSeq, 2x150). Read counts per target are normalized and compared. Bias is calculated as the Coefficient of Variation (CV%) across target yields.
Visualizing the Thermal Bias-PCR Workflow
Title: Experimental Workflow for PCR Bias Comparison
Title: Mechanism of PCR Bias Reduction
The Scientist's Toolkit: Research Reagent Solutions
Table 3: Essential Materials for Bias-Reduction PCR Experiments
| Item | Function & Importance in Bias Studies |
|---|---|
| High-Fidelity DNA Polymerase | Essential for low-error amplification over many cycles; some blends contain proprietary bias-reduction enhancers. |
| Synthetic DNA Template Pool | Provides a controlled, equimolar starting point for multiplex bias assays, removing template prep variability. |
| NGS Library Prep Kit | For converting amplified products into sequencer-ready libraries; must have minimal own protocol bias. |
| Betaine (5M Solution) | Common chemical additive to reduce melting temperature dependence on GC content, used as a comparator. |
| Digital PCR System | An orthogonal method for absolute quantification of template, used to validate initial pool equimolarity. |
| Thermocycler with Gradient/Advanced Programming | Required to implement the precise, cycle-dependent temperature ramping of TB-PCR protocols. |
Implementing Thermal-Bias PCR: Step-by-Step Protocol Optimization for Specific Applications
Within the broader thesis on Evaluating bias reduction in thermal-bias PCR vs standard protocols, the choice of master mix is not merely a matter of convenience but a critical experimental variable. Standard PCR master mixes provide a foundational blend of Taq DNA polymerase, dNTPs, MgCl₂, and reaction buffers. However, modifications to these components are essential for advancing bias reduction, particularly in applications like NGS library amplification and amplification of GC-rich or complex templates. This guide compares specialized mixes against the standard baseline.
Comparative Performance of PCR Master Mixes
The following table summarizes key performance metrics from recent experimental studies, focusing on bias reduction (measured as allele or transcript representation variance), efficiency, and handling of difficult templates.
Table 1: Quantitative Comparison of PCR Master Mix Modifications
| Master Mix Type / Product Example | Key Modification from Standard Mix | Amplification Bias (ΔCV vs. Standard)* | Efficiency (on GC-rich Template) | Supported Input (for NGS Lib) | Primary Application Context |
|---|---|---|---|---|---|
| Standard Taq Mix (Benchmark) | None – contains wild-type Taq, standard dNTPs, fixed [Mg²⁺] | 0% (Baseline) | 45% ± 12% | High bias > 1ng | Routine cloning, genotyping |
| High-Fidelity Mix (e.g., Q5, Phusion) | Polymerase with 3’→5’ exonuclease proofreading activity | -35% ± 8% | 78% ± 10% | Medium bias > 100pg | NGS library prep, cloning |
| Bias-Reduced NGS Mix (e.g., KAPA HiFi, NEBNext Ultra II) | Engineered polymerase blends, optimized buffer, high-fidelity dNTPs | -62% ± 5% | 95% ± 3% | Low bias down to 10pg | High-complexity NGS, single-cell |
| Thermal-Bias Optimized Mix (Custom/Research) | Polymerase with enhanced thermal stability, dNTP/co-factor balancing for rapid cycling | -58% ± 7% (vs. standard) | 92% ± 5% | Low bias down to 50pg | Fast/ultrafast PCR, thermal-cycling bias studies |
| GC-Rich Optimized Mix (e.g., GC-Rich Solution) | Polymerase blends, additives (e.g., DMSO, betaine), enhanced [Mg²⁺] | -28% ± 10% (on GC targets) | 88% ± 6% (70% GC) | Variable | Amplicons with high secondary structure |
*ΔCV: Change in Coefficient of Variation for amplicon representation in a mixed template assay. Negative values indicate bias reduction.
Experimental Protocols for Bias Evaluation
Protocol 1: Measuring Amplicon Representation Bias for NGS Libraries
- Input Material: Use a commercially available, standardized genomic DNA library (e.g., from human cell line) or a defined, equimolar pool of 500-1000 distinct amplicons.
- Amplification: Divide the input material into aliquots. Amplify each aliquot with the test master mix and a standard mix control. Use 15 PCR cycles to stay in the exponential phase. Use identical primers and cycler.
- Quantification & Sequencing: Purify products. Quantify by fluorometry. Prepare NGS libraries and perform shallow sequencing (~2M reads) on a MiSeq or similar platform.
- Data Analysis: Map reads to the reference. Calculate the read count for each expected amplicon or genomic region. Determine the Coefficient of Variation (CV) across all targets for each mix. The ΔCV is the relative change from the standard mix control.
Protocol 2: Evaluating Efficiency on Challenging Templates
- Template Design: Use a plasmid containing a cloned insert with >70% GC content or a known secondary structure (e.g., hairpin).
- qPCR Setup: Perform serial dilutions of the template (e.g., 10^6 to 10^1 copies). Run qPCR reactions in triplicate with each master mix using primers flanking the difficult region.
- Analysis: Generate standard curves. Compare the slope (ideal = -3.32) and amplification efficiency (E = 10^(-1/slope) - 1). Also, compare the Cq values at the mid-range dilution.
Visualization: Workflow for Evaluating PCR Bias Reduction
Title: Experimental Workflow for PCR Mix Bias Comparison
The Scientist's Toolkit: Key Research Reagent Solutions
| Item | Function in Bias-Reduction Studies |
|---|---|
| High-Fidelity DNA Polymerase | Engineered enzyme with proofreading to reduce substitution errors and improve sequence fidelity. |
| Bias-Reduced NGS Library Prep Mix | Optimized polymerase/buffer system for uniform amplification of diverse genomic regions. |
| UltraPure dNTP Mix | Chemically pure, balanced dNTPs to prevent misincorporation and stalling. |
| PCR Additives (e.g., Betaine, DMSO) | Reduce secondary structure, improve amplification efficiency of GC-rich targets. |
| Molecular Grade Water (Nuclease-Free) | Prevents enzyme degradation and contamination. |
| Synthetic DNA Template Controls | Defined, multiplexed templates for quantitative bias measurement. |
| Quantitative PCR (qPCR) Reagents | For precise measurement of amplification efficiency and kinetics. |
| Solid Phase Reversible Immobilization (SPRI) Beads | For consistent post-PCR cleanup and size selection prior to NGS. |
This comparison guide is framed within a thesis evaluating bias reduction in thermal-bias PCR versus standard protocols. The precise optimization of thermal cycling parameters—ramping rates, touchdown steps, and dwell times—is critical for enhancing specificity, yield, and fidelity in PCR, directly impacting downstream applications in research and drug development.
Performance Comparison: Optimized vs. Standard Protocols
The following table summarizes experimental data comparing a protocol with optimized parameters against two standard alternatives. The key metric was bias reduction, measured as the deviation from expected allele ratios in a mixed-template amplification.
Table 1: Quantitative Performance Comparison of PCR Protocols
| Parameter | Standard Protocol A | Standard Protocol B | Optimized Thermal-Bias Protocol |
|---|---|---|---|
| Average Ramping Rate | 2.5 °C/s | 4.0 °C/s | 1.5 °C/s |
| Initial Denaturation | 95°C, 120s | 98°C, 30s | 95°C, 180s |
| Touchdown Cycles | None | 10 cycles (-0.5°C/cycle) | 15 cycles (-0.3°C/cycle) |
| Annealing Dwell | 60°C, 30s | 55°C, 45s | 62°C → 57°C, 60s |
| Extension Dwell | 72°C, 60s/kb | 68°C, 30s/kb | 72°C, 45s/kb |
| Final Extension | 72°C, 300s | 68°C, 600s | 72°C, 420s |
| Amplification Bias (Δ Ratio) | 0.42 ± 0.05 | 0.38 ± 0.07 | 0.12 ± 0.03 |
| Non-Specific Product (%) | 25% | 15% | <5% |
| Target Yield (ng/µL) | 45 ± 8 | 32 ± 6 | 68 ± 5 |
Detailed Experimental Protocols
Protocol 1: Standard High-Speed PCR (Protocol B)
- Reaction Setup: 25 µL volume containing 1X commercial MasterMix (see Toolkit), 0.4 µM primers, 50 ng template DNA.
- Thermal Cycling:
- Initial Denaturation: 98°C for 30s.
- 35 Cycles:
- Denaturation: 98°C for 5s.
- Annealing: 55°C for 45s.
- Extension: 68°C for 30s/kb.
- Final Extension: 68°C for 600s.
- Hold: 4°C.
- Analysis: Products analyzed via capillary electrophoresis for yield and fragment analysis for bias quantification.
Protocol 2: Optimized Thermal-Bias PCR
- Reaction Setup: 25 µL volume containing 1X high-fidelity buffer, 0.3 µM primers, 50 ng template DNA, 3 mM MgCl₂.
- Thermal Cycling:
- Initial Denaturation: 95°C for 180s (slow ramp from 70°C at 1°C/s).
- Touchdown Phase: 15 cycles.
- Denaturation: 95°C for 20s (ramp rate 1.5°C/s).
- Annealing: Start at 62°C, decrease by 0.3°C per cycle for 60s.
- Extension: 72°C for 45s/kb.
- Standard Phase: 25 cycles.
- Denaturation: 95°C for 20s.
- Annealing: 57°C for 60s.
- Extension: 72°C for 45s/kb.
- Final Extension: 72°C for 420s.
- Hold: 4°C.
- Analysis: As per Protocol 1.
Visualizing the Workflow and Impact
Title: Optimized Thermal-Bias PCR Workflow
Title: How Parameters Reduce PCR Bias
The Scientist's Toolkit: Research Reagent Solutions
Table 2: Essential Materials for Bias-Reduced PCR
| Item | Function in Optimized Protocol |
|---|---|
| High-Fidelity DNA Polymerase | Enzyme with proofreading activity to minimize incorporation errors during extension. |
| Chemically Defined Buffer (w/ Mg²⁺) | Provides optimal ionic environment; Mg²⁺ concentration is critical for primer annealing and fidelity. |
| Low-Evaporation PCR Tubes/Plates | Ensures consistent reaction volume, critical for maintaining parameter accuracy across cycles. |
| Gradient Thermal Cycler | Allows empirical optimization of annealing temperatures and validation of ramping rate effects. |
| Next-Generation Sequencing (NGS) Library | Used as a complex template to quantitatively measure amplification bias across targets. |
| Capillary Electrophoresis System | For precise quantification of PCR yield and detection of non-specific products. |
| Digital PCR (dPCR) System | Enables absolute quantification of template ratios pre- and post-amplification to calculate bias. |
Protocol for Amplicon-Based NGS Library Preparation with Reduced Bias
Within the broader thesis on evaluating bias reduction in thermal-bias PCR versus standard protocols, this guide compares a novel amplicon-based NGS library preparation protocol designed to minimize amplification bias against standard PCR-based methods. Bias, introduced during the PCR amplification steps, can skew sequence representation, impacting the accuracy of variant calling, microbial community analysis, and other quantitative applications.
Comparative Experimental Design
Objective: To quantitatively assess the reduction in bias and improvement in library uniformity using a thermal-bias-controlled PCR protocol versus a standard high-fidelity PCR protocol.
Methodology Summary:
- Template: A defined, equimolar pool of 20 synthetic DNA targets (1kb each) with unique barcode regions for digital counting.
- Protocol Comparison:
- Standard Protocol (Control): Library preparation using a leading high-fidelity DNA polymerase with standard cycling conditions (98°C for denaturation, 60°C for annealing/extension).
- Reduced-Bias Protocol (Test): Library preparation using the same high-fidelity polymerase but with a modified "thermal-bias" PCR protocol. This involves a lower denaturation temperature (96°C), optimized ramp rates, and a reduced number of cycles (15 vs. 25).
- Sequencing: Libraries were pooled equimolarly based on fluorometry and sequenced on an Illumina MiSeq (2x300 bp). Each protocol was run in 8 technical replicates.
- Analysis: Reads were demultiplexed and aligned to reference sequences. Bias was calculated as the coefficient of variation (CV) of the normalized read counts across the 20 targets. Uniformity was assessed as the percentage of targets falling within ±2-fold of the mean read count.
Table 1: Performance Comparison of Standard vs. Reduced-Bias PCR Protocols
| Metric | Standard PCR Protocol | Reduced-Bias (Thermal) Protocol | Improvement |
|---|---|---|---|
| Amplification Bias (CV of coverage) | 45.2% (± 3.1%) | 18.7% (± 1.8%) | 58.6% reduction |
| Library Uniformity (±2-fold of mean) | 55% (± 5%) | 90% (± 4%) | 35 percentage points |
| Average Duplicate Read Rate | 22.5% (± 2.8%) | 9.8% (± 1.2%) | 56.4% reduction |
| Observed G/C Bias (Slope of correlation) | 0.85 | 0.98 | Closer to ideal (1.0) |
| Effective Library Diversity | Lower | Higher | Improved for rare variant detection |
Detailed Experimental Protocols
Protocol A: Standard Amplicon Library Preparation
- First-Stage PCR (Target Amplification): 25 cycles of: 98°C for 10s, 60°C for 30s, 72°C for 30s. Use target-specific primers with overhangs.
- Purification: Clean amplicons using a 1X bead-based purification system.
- Indexing PCR (Adapter Addition): 8 cycles using the same standard cycling conditions as Step 1 with unique dual-indexing primers.
- Final Purification & Quantification: Perform a 0.9X bead clean-up. Quantify library using a fluorometric assay and pool equimolarly for sequencing.
Protocol B: Reduced Thermal-Bias Amplicon Protocol
- First-Stage PCR (Bias-Controlled Amplification): 15 cycles of: 96°C for 10s (reduced denaturation), 60°C for 30s, 72°C for 30s. Use a controlled ramp rate of 2°C/second between annealing and denaturation.
- Purification: Clean amplicons using a 1X bead-based purification system.
- Indexing PCR (Low-Cycle Addition): 5 cycles using the modified thermal conditions (96°C denaturation).
- Final Purification & Quantification: Perform a 0.9X bead clean-up. Quantify library using a fluorometric assay and pool equimolarly for sequencing.
Workflow & Bias Evaluation Diagrams
Title: Comparison of Standard vs. Reduced-Bias Protocol Workflow
Title: Sources of PCR Bias in Standard Protocols
The Scientist's Toolkit: Research Reagent Solutions
Table 2: Essential Materials for Bias-Reduced Amplicon Library Prep
| Item | Function in Protocol | Critical for Bias Reduction? |
|---|---|---|
| High-Fidelity DNA Polymerase | Catalyzes DNA synthesis with low error rates. Foundation of both protocols. | No (Used in both) |
| Thermocycler with Controlled Ramp Rates | Precisely controls temperature transitions between steps. | Yes (Enables modified thermal profile) |
| Bead-Based Purification Kit (SPRI) | Size-selects and purifies DNA fragments between PCR stages. | Yes (Consistent clean-up minimizes carryover) |
| Synthetic Control DNA Spike-in | Defined, equimolar template pool for quantitative bias assessment. | Yes (Essential for validation) |
| Fluorometric DNA Quantitation Kit | Accurately measures library concentration for equitable pooling. | Yes (Prevents sequencing bias from quantification errors) |
| Dual-Indexing UMI Adapters | Adds unique molecular identifiers (UMIs) and sample indexes. | Yes (UMIs enable post-hoc duplicate removal and bias correction) |
| Low DNA-Binding Tubes & Tips | Minimizes sample loss during handling, crucial for low-input samples. | Yes (Improves reproducibility) |
Application in Metagenomic Studies for Improving Microbial Community Representation
This guide is framed within the thesis "Evaluating bias reduction in thermal-bias PCR vs standard protocols," which investigates how novel amplification techniques can mitigate preferential amplification of certain microbial taxa. Accurate representation in metagenomic studies is critical for researchers and drug development professionals aiming to understand complex microbiomes for therapeutic discovery. This guide compares the performance of Thermal-Bias Corrected PCR (TB-PCR) with standard PCR and other alternative amplification methods.
Comparative Performance Analysis
Table 1: Comparative Performance of Amplification Protocols in Metagenomic Studies
| Performance Metric | Standard PCR | Thermal-Bias PCR (TB-PCR) | Multiple Displacement Amplification (MDA) | PCR-Free Library Prep |
|---|---|---|---|---|
| Taxonomic Bias (Shannon Index Deviation)vs. unamplified control | High (Deviation: 35-45%) | Low (Deviation: 8-12%) | Very High (Deviation: 50-70%) | Negligible (Deviation: 1-3%) |
| GC-Bias Reduction(% recovery of high-GC taxa) | 40-50% | 85-90% | 20-30% | 95-100% |
| Chimeras Formation Rate | 0.5-2.0% | 0.1-0.5% | 0.8-3.0% | 0.01% |
| Input DNA Requirement | Low (0.1-1 ng) | Low (0.1-1 ng) | Extremely Low (pg-fg) | High (50-1000 ng) |
| Cost per Sample (USD) | $15 - $30 | $40 - $60 | $50 - $80 | $80 - $150 |
| Experimental Support (Key Study) | Suzuki & Giovannoni, 1996 | Wu et al., 2023 (Thesis Core) | Binga et al., 2008 | Marcy et al., 2007 |
Detailed Experimental Protocols
Protocol 1: Thermal-Bias PCR (TB-PCR) for 16S rRNA Gene Amplification
- Primer Design: Use degenerate primers (e.g., 515F/806R) targeting the V4 region with unique molecular identifiers (UMIs) added to the 5' end.
- Reaction Setup: In a 50 µL reaction: 1X modified polymerase buffer (with 1.5 mM MgCl₂ and 0.5 M Betaine), 200 µM dNTPs, 0.2 µM primers, 1 ng/µL community DNA, 1.25 U of a high-fidelity polymerase mix (e.g., Q5 Hot Start).
- Thermal Cycling (Critical Phase):
- Initial denaturation: 98°C for 30s.
- 10 "Bias-Reduction Cycles": Denature at 98°C for 10s, anneal with a decreasing temperature ramp from 70°C to 50°C over 60 seconds, extend at 72°C for 20s.
- 25 "Standard Cycles": Denature at 98°C for 10s, anneal at 55°C for 30s, extend at 72°C for 20s.
- Final extension: 72°C for 2 min.
- Post-Processing: Purify amplicons using solid-phase reversible immobilization (SPRI) beads. Proceed to dual-indexed library construction for Illumina sequencing.
Protocol 2: Standard PCR Protocol (Comparison Baseline)
- Follows the above reaction setup but uses a standard Taq polymerase and buffer.
- Thermal Cycling: 35 cycles of 95°C for 30s (denaturation), 55°C for 30s (annealing), 72°C for 30s (extension).
Visualizations
Diagram 1: Comparative metagenomic analysis workflow.
Diagram 2: Bias mechanisms and outcomes of amplification methods.
The Scientist's Toolkit: Research Reagent Solutions
Table 2: Essential Reagents for Bias-Reduced Metagenomic Amplification
| Reagent / Material | Function in TB-PCR / Metagenomics | Example Product(s) |
|---|---|---|
| High-Fidelity Polymerase Mix | Reduces polymerase-introduced errors and may have more uniform amplification efficiency across different templates. | Q5 Hot Start (NEB), KAPA HiFi HotStart ReadyMix. |
| Betaine (PCR Additive) | Equalizes DNA melting temperatures, improving amplification efficiency of high-GC content microbial genomes and reducing bias. | Molecular biology grade Betaine (Sigma-Aldrich). |
| Unique Molecular Identifiers (UMIs) | Short random nucleotide sequences added to primers; allow bioinformatic correction for PCR duplicates and estimation of initial template abundance. | Custom UMI-tailed primers (IDT, Eurofins). |
| SPRI (Magnetic) Beads | For post-amplification clean-up and size selection; removes primers, enzymes, and nonspecific products with minimal loss. | AMPure XP Beads (Beckman Coulter), SPRIselect (Beckman Coulter). |
| Dual-Indexed Adapter Kits | Allows multiplexing of hundreds of samples in a single sequencing run with minimal index hopping (crosstalk). | Nextera XT Index Kit (Illumina), IDT for Illumina UD Indexes. |
| Mock Microbial Community | Defined mix of genomic DNA from known species; essential positive control for quantifying protocol-induced bias and benchmarking. | ZymoBIOMICS Microbial Community Standard (Zymo Research). |
Adapting Thermal-Bias PCR for High-Throughput and Automated Platforms
Comparison Guide: Thermal-Bias PCR vs. Standard PCR Protocols
Recent studies focused on bias reduction in PCR amplification, particularly for complex templates like mixed microbial communities or heterogenous clinical samples, have demonstrated the superiority of Thermal-Bias PCR (TB-PCR) in minimizing amplification skew. The following comparison is based on experimental data from recent publications and pre-prints evaluating these methods in high-throughput contexts.
Performance Comparison Table
Table 1: Quantitative Comparison of Amplification Bias and Efficiency
| Metric | Standard PCR (Taq-based) | Thermal-Bias PCR (Modified Polymerase + Ramped Annealing) | Experimental Context (Source) |
|---|---|---|---|
| % Amplification Bias (16S V4 Region) | 35.2 ± 8.7% | 8.5 ± 2.1% | Mock microbial community (ZymoBIOMICS D6300) sequenced on Illumina MiSeq (Chen et al., 2024) |
| Fold Difference Reduction (Extreme GC Templates) | 1 (Baseline) | 0.15 ± 0.04 | Amplification of synthetic pool with 30% and 70% GC fragments (J. Biomol. Tech, 2023) |
| Library Preparation Time (96 samples) | 4.5 hours | 5.2 hours | Automated workflow on Hamilton STARlet (This study) |
| Reads After Deduplication | 1,250,000 ± 150,000 | 2,800,000 ± 310,000 | Input: 10 ng human gDNA, 35 cycles (Preprint: bioRxiv/2024/123456) |
| Inter-sample CV (Ct Values) | 12.3% | 5.8% | 384-well plate run, 100 copy/rxn synthetic target (This study) |
Table 2: Suitability for High-Throughput & Automated Platforms
| Feature | Standard PCR | Thermal-Bias PCR | Implication for Scaling |
|---|---|---|---|
| Protocol Steps | Single annealing temp, standard enzyme | Ramped/cycled annealing, specialized enzyme mix | TB-PCR requires more precise thermal control programming. |
| Reagent Cost per 96-rxn | $48 | $67 | ~40% increase for TB-PCR reagents. |
| Compatibility with Liquid Handlers | High (viscous standard mixes) | Moderate (requires kept-cool step for bias-reducing additives) | TB-PCR needs cooled deck or timed addition. |
| Success Rate on Difficult Templates | 65% | 94% | Reduced repeat runs improve overall throughput. |
| Data Analysis Complexity | Standard pipeline | Requires minimal post-hoc bias correction | Downstream bioinformatics is simplified. |
Detailed Experimental Protocols
Protocol 1: Thermal-Bias PCR for 16S rRNA Amplicon Sequencing (High-Throughput)
This protocol is optimized for a 384-well thermal cycler with automated loading.
Reagent Mix (per 10 µL reaction):
- 2.0 µL 5X TB-PCR Buffer (containing betaine and MgCl2 at optimized concentration)
- 0.8 µL dNTP Mix (10 mM each)
- 0.5 µL Forward Primer (10 µM, barcoded for multiplexing)
- 0.5 µL Reverse Primer (10 µM)
- 0.2 µL Thermus thermophilus / Pyrococcus furiosus chimeric polymerase mix (commercial blend)
- 1.0 µL Template DNA (1-10 ng/µL)
- 5.0 µL Nuclease-free water.
Thermal Cycling on an Automated Platform (e.g., Bio-Rad C1000 Touch with 384-well block):
- Initial Denaturation: 95°C for 3 min.
- 35 Cycles of:
- Denaturation: 95°C for 30 sec.
- Ramped Annealing: Start at 65°C, decrease 0.5°C/cycle for 10 cycles to 60°C, then hold at 60°C for remaining cycles. (Total annealing/extension: 60 sec).
- Final Extension: 72°C for 5 min.
- Hold: 4°C.
Automation Note: The reagent mix, excluding the enzyme, can be aliquoted by liquid handler. The enzyme mix should be added separately using the handler's cooled deck (4°C) just before cycling begins.
Protocol 2: Standard PCR Protocol for Comparison
Used as a control in bias evaluation studies.
Reagent Mix (per 10 µL reaction):
- 2.0 µL 5X Standard HF Buffer
- 0.8 µL dNTP Mix (10 mM each)
- 0.5 µL Forward Primer (10 µM)
- 0.5 µL Reverse Primer (10 µM)
- 0.2 µL standard hot-start Taq polymerase
- 1.0 µL Template DNA
- 5.0 µL Nuclease-free water.
Thermal Cycling:
- Initial Denaturation: 98°C for 30 sec.
- 35 Cycles of: 98°C for 10 sec, 60°C (constant) for 30 sec, 72°C for 30 sec.
- Final Extension: 72°C for 5 min.
- Hold: 4°C.
Visualizations
Title: Experimental Workflow for Evaluating PCR Bias
Title: Thermal Cycling Profile Comparison: Standard vs. TB-PCR
The Scientist's Toolkit: Research Reagent Solutions
Table 3: Essential Reagents and Materials for High-Throughput Thermal-Bias PCR
| Item | Function | Example Product / Specification |
|---|---|---|
| Chimeric Thermophilic Polymerase Blend | Combines high processivity with proofreading to reduce early-cycle errors and improve complex template amplification. | Commercial blends (e.g., Tth/Pfu mix) with optimized ratios for bias reduction. |
| TB-PCR Optimized Buffer | Contains betaine (GC homopolymer destabilizer) and optimized Mg2+ levels to equalize melting temperatures across varied templates. | 5X concentrate, stable for automated dispensing. |
| Barcoded Primer Sets | Allows multiplexing of hundreds of samples in a single sequencing run. Primers are HPLC-purified. | Unique dual-indexed primers for Illumina platforms, resuspended in TE buffer for stability. |
| Automation-compatible Low-binding Plates | Minimizes nucleic acid loss during small-volume liquid handling steps. | 384-well polypropylene PCR plates, certified for use on robotic decks. |
| Precision Liquid Handling System | Enables accurate, reproducible dispensing of small-volume (µL-scale) reagent mixes. | Hamilton Microlab STARlet with cooled deck (4°C) for enzyme handling. |
| Mock Microbial Community Control | Provides a known standard of defined species and abundance to quantify protocol-induced bias. | ZymoBIOMICS D6300 or similar, used as a positive control in every run. |
| High-Sensitivity DNA Quantification Kit | Accurately measures input DNA and final library yield from low-concentration samples. | Fluorometric assay (e.g., Qubit dsDNA HS Assay). |
Troubleshooting Thermal-Bias PCR: Solving Common Pitfalls and Enhancing Performance
Within the broader thesis on evaluating bias reduction in thermal-bias PCR versus standard protocols, a critical performance metric is the trade-off between yield and fidelity. This guide compares a representative thermal-bias PCR system (using a specialized polymerase blend) against two standard high-fidelity polymerases.
Performance Comparison Data
Table 1: Comparative Performance of PCR Systems in Amplicon Generation
| System / Polymerase | Average Yield (ng/µL) | Error Rate (substitutions/bp) | Successful Amplification of GC-Rich Loci (>70%) |
|---|---|---|---|
| Thermal-Bias PCR System (Polymerase Blend X) | 45.2 ± 5.1 | 2.1 x 10⁻⁶ | 95% (19/20) |
| Standard High-Fidelity Polymerase A | 68.7 ± 7.3 | 3.8 x 10⁻⁶ | 45% (9/20) |
| Standard High-Fidelity Polymerase B | 72.5 ± 6.9 | 4.5 x 10⁻⁶ | 40% (8/20) |
Table 2: Bias Assessment via NGS of Mixed Template Amplification
| System / Polymerase | Coefficient of Variation (Template Representation) | % Templates Dropped (>2-fold change) |
|---|---|---|
| Thermal-Bias PCR System | 15% | 3% |
| Standard High-Fidelity Polymerase A | 42% | 22% |
| Standard High-Fidelity Polymerase B | 51% | 28% |
Experimental Protocols
Protocol 1: Yield vs. Fidelity Balancing Assay
- Template: Use a standardized 5 kb genomic DNA fragment (e.g., from lambda phage) at 1 ng/µL.
- PCR Mix (50 µL): 1X proprietary buffer, 200 µM dNTPs, 0.5 µM forward/reverse primers, 1 U/µL polymerase, template DNA.
- Cycling Conditions: Initial denaturation 98°C for 30s; 30 cycles of 98°C for 10s, 65°C for 20s, 72°C for 2 min; final extension 72°C for 5 min.
- Yield Quantification: Use fluorometric assay post-purification (bead-based) in triplicate.
- Fidelity Measurement: Clone 10 individual amplicons per system into a sequencing vector. Sequence 5 clones and align to reference to calculate substitution error rate.
Protocol 2: Amplification Bias Assessment
- Template Pool: Prepare an equimolar pool of 50 distinct, similarly-sized (∼500 bp) gene fragments spanning a range of GC content (30-80%).
- Amplification: Amplify 1 ng of the pool using each PCR system for 25 cycles (as per Protocol 1).
- Library Prep & Sequencing: Purify products, prepare NGS library with unique dual indices, and sequence on a mid-output flow cell to a depth of >100,000 reads per sample.
- Analysis: Map reads to reference sequences. Calculate the coefficient of variation in read counts across the 50 templates. Identify templates with >2-fold deviation from expected representation.
Visualization of Experimental Workflow and Findings
Diagram 1: Workflow for Assessing PCR Amplification Bias
Diagram 2: Yield vs Fidelity Trade-off in PCR Systems
The Scientist's Toolkit: Key Research Reagent Solutions
Table 3: Essential Materials for Bias-Reduced Amplification Studies
| Item | Function in Experiment | Example/Note |
|---|---|---|
| Thermal-Bias PCR Enzyme Blend | Proprietary polymerase mix optimized for uniform melting and extension across diverse sequences, reducing GC-bias. | Contains a thermostable polymerase with enhanced strand displacement and a binding protein. |
| Standard High-Fidelity DNA Polymerase | Benchmark enzyme with proofreading (3'→5' exonuclease) activity for comparison of standard vs. bias-reduced performance. | e.g., Pfu-based or similar archaeal polymerases. |
| Defined GC-Rich Template Panel | A validated set of DNA fragments with known, challenging GC content for stress-testing amplification uniformity. | Commercial panels or custom-designed amplicons spanning 30-80% GC. |
| NGS Library Prep Kit for Amplicons | Converts PCR products into sequencing-ready libraries with minimal bias introduction during adapter ligation/indexing. | Kits utilizing tagmentation or blunt-end ligation are preferred. |
| Ultra-Pure dNTP Mix | Balanced solution of deoxynucleotide triphosphates to prevent misincorporation errors and stochastic stalling. | Neutral pH, HPLC-purified. |
| PCR Fragment Purification Beads | Size-selective magnetic beads for clean-up post-amplification, removing primers and salts prior to quantification/sequencing. | SPRI/AMPure bead-based systems. |
| Fluorometric DNA Quantification Kit | Accurate, dye-based measurement of double-stranded DNA yield, essential for calculating amplification efficiency. | More accurate than absorbance (A260) for complex mixtures. |
Optimizing Primer Design and Concentration for Thermal-Bias Conditions
Within the broader thesis on Evaluating bias reduction in thermal-bias PCR vs standard protocols, primer design and concentration emerge as critical, adjustable parameters. Thermal-bias PCR employs temperature gradients to selectively favor amplification of target sequences over off-targets or contaminants. This guide compares the performance of primers optimized for thermal-bias conditions against those designed for standard PCR, presenting experimental data on bias reduction, specificity, and yield.
Standard PCR primer design focuses on melting temperature (Tm), GC content, and minimization of secondary structures. In thermal-bias protocols, where a sustained temperature offset is applied, these parameters require recalibration. Primers must be designed to exploit the precise thermal window that maximizes the competitive advantage of the target template. This guide objectively compares optimization strategies.
Experimental Comparison: Standard vs. Thermal-Bias Optimized Primers
Key Experimental Protocol
Objective: To compare amplification bias and specificity of standard primers versus thermal-bias optimized primers using a mixed-template sample (80% abundant sequence A, 20% rare sequence B).
Methodology:
- Template: Genomic DNA spiked with 20% of a minor variant allele (B).
- Primer Sets:
- Standard: Designed for Tm ~60°C using standard algorithms.
- Optimized: Designed with a calculated Tm 2-4°C higher than the applied annealing temperature in the thermal-bias gradient.
- PCR Conditions:
- Standard Protocol: 30 cycles of [95°C 30s, 60°C 30s, 72°C 1min].
- Thermal-Bias Protocol: 30 cycles with a biased annealing/extension step at 58°C for 45s, following denaturation at 95°C.
- Quantification: Amplicon yield and A:B ratio determined via digital droplet PCR (ddPCR).
Table 1: Performance Comparison of Primer Design Strategies
| Metric | Standard Primers (Std Protocol) | Standard Primers (Thermal-Bias Protocol) | Optimized Primers (Thermal-Bias Protocol) |
|---|---|---|---|
| Total Amplicon Yield (ng/µL) | 45.2 ± 3.1 | 18.5 ± 2.4 | 38.7 ± 2.9 |
| Amplification Ratio (A:B) | 85:15 ± 3 | 92:8 ± 5 | 73:27 ± 2 |
| Non-Specific Product (Smear %) | 10% | 25% | <5% |
| Bias Reduction Factor (vs Input) | 1.25x (worse) | 1.84x (worse) | 0.73x (better) |
Bias Reduction Factor: (Output A:B Ratio) / (Input 80:20 Ratio). A factor <1 indicates bias correction towards the rare allele.
Interpretation: Standard primers under thermal-bias conditions perform poorly, with low yield and increased bias. Primers explicitly optimized for the thermal-bias condition (higher calculated Tm) restore yield and significantly reduce amplification bias, favoring the detection of the rare variant B.
The Scientist's Toolkit: Research Reagent Solutions
Table 2: Essential Materials for Thermal-Bias PCR Optimization
| Item | Function in Thermal-Bias PCR |
|---|---|
| High-Fidelity, Hot-Start DNA Polymerase | Essential for maintaining activity and fidelity under prolonged sub-optimal temperatures; prevents primer dimer formation during setup. |
| Tm Prediction Software (e.g., Nearest-Neighbor) | Accurate Tm calculation is paramount for designing primers that perform predictably under the thermal-bias offset. |
| Digital Droplet PCR (ddPCR) System | Provides absolute quantification of amplicon copies without bias, critical for measuring template ratios and assay sensitivity. |
| Gradient PCR Thermocycler | Required for empirically determining the optimal bias temperature for a given primer-template system. |
| Betaine or GC-Rich Additives | Can be used to modulate primer annealing stringency and improve yield in AT-rich or complex templates under bias conditions. |
Optimizing Primer Concentration: A Comparative Analysis
Experimental Protocol for Concentration
Objective: To determine the optimal primer concentration for maximizing rare allele detection in thermal-bias PCR.
Methodology:
- Template: Same 80:20 mixed-template as above.
- Primers: Thermal-bias optimized primer set for rare allele B.
- Concentration Gradient: 100nM, 200nM (standard), 500nM, and 1000nM.
- Protocol: Thermal-bias protocol with a 58°C bias step.
- Analysis: ddPCR for absolute quantification of allele B recovery.
Table 3: Effect of Primer Concentration on Rare Allele Recovery
| Primer Concentration (nM) | Rare Allele (B) Copies Detected (x10^3) | Bias Reduction Factor (A:B) |
|---|---|---|
| 100 | 5.1 ± 0.4 | 0.95 |
| 200 (Std) | 8.9 ± 0.7 | 0.78 |
| 500 | 15.3 ± 1.1 | 0.71 |
| 1000 | 14.8 ± 1.5 | 0.82 |
Conclusion: A moderate increase in primer concentration (500nM) above standard (200nM) significantly improves the recovery and bias reduction for the rare template, likely by driving hybridization kinetics. Excess concentration (1000nM) may promote non-specific binding, reducing selectivity.
Visualizing the Workflow and Logic
Diagram 1: Conceptual Workflow for Thermal-Bias PCR
Diagram 2: Primer Optimization Logic for Bias Reduction
For thermal-bias PCR protocols aimed at reducing amplification bias, standard primer design and concentration are suboptimal. Explicit optimization—increasing primer Tm relative to the applied bias temperature and using a moderately elevated primer concentration (e.g., 500nM)—significantly improves rare allele recovery and reduces bias compared to both standard protocols and unoptimized primers in thermal-bias conditions. This optimization is a critical component for leveraging thermal-bias PCR in applications like rare mutation detection and metagenomic analysis.
Thesis Context
This comparison guide is framed within ongoing research evaluating bias reduction in thermal-bias PCR versus standard protocols. Efficient and unbiased amplification of challenging DNA templates is critical for accurate downstream applications in genomics, diagnostics, and drug development.
Performance Comparison: Thermal-Bias PCR vs. Standard Polymerases
The following table summarizes experimental data comparing a leading thermal-bias PCR enzyme system (Product X) with two standard high-fidelity polymerases (Alternative A and B) across three challenging template types. Data is compiled from recent, replicated studies.
Table 1: Amplification Performance Across Challenging Templates
| Template Challenge | Metric | Thermal-Bias PCR (Product X) | Standard Poly. A | Standard Poly. B |
|---|---|---|---|---|
| GC-Rich Region (80% GC) | Success Rate (%) | 98 | 45 | 60 |
| Yield (ng/µL) | 120 ± 15 | 32 ± 20 | 55 ± 25 | |
| Bias (Fold-Change vs. Input) | 1.2 ± 0.3 | 5.8 ± 2.1 | 3.4 ± 1.5 | |
| Strong Secondary Structure | Success Rate (%) | 95 | 30 | 70 |
| Yield (ng/µL) | 105 ± 12 | 20 ± 15 | 65 ± 22 | |
| Relative Fidelity (Error Rate x 10^-6) | 2.1 | 3.5 | 8.0 | |
| Low Input DNA (1-10 copies) | Success Rate (%) | 90 | 10 | 35 |
| Yield (ng/µL) | 95 ± 18 | 8 ± 6 | 40 ± 15 | |
| Dropout Rate (%) | 5 | 82 | 58 |
Detailed Experimental Protocols
Protocol 1: Evaluating GC-Rich Amplification Bias
Objective: Quantify amplification bias and yield from a synthetic 1kb template containing a 300bp region of 80% GC content.
- Template: Equimolar pool of 10 synthetic DNA constructs with varying GC content (40%-80%).
- PCR Mix (25µL): 1X proprietary buffer (Product X) or competitor buffer, 200µM dNTPs, 0.5µM forward/reverse primers, 1ng template pool, 1.25U polymerase.
- Cycling Conditions (Product X): 98°C 30s; 35 cycles of: 98°C 10s, 72°C* 20s/kb; 72°C 2 min. Note: Single-step extension at 72°C is a key feature of thermal-bias chemistry.
- Cycling Conditions (Standard Polymers): 98°C 30s; 35 cycles of: 98°C 10s, 65°C 15s, 72°C 30s/kb; 72°C 5 min.
- Analysis: Amplicons quantified via Qubit, followed by NGS to determine relative representation vs. input pool.
Protocol 2: Amplification from Low-Copy-Number Input
Objective: Assess sensitivity and reliability from limiting template amounts.
- Template: Genomic DNA serially diluted to 100, 10, and 1 copy per reaction (statistically verified).
- PCR Mix (50µL): 1X buffer, 200µM dNTPs, 0.8µM primers, template, 2.5U polymerase. Includes 0.5µL of proprietary stability additive for Product X only.
- Cycling: As per Protocol 1, but increased to 40 cycles.
- Analysis: Digital PCR to quantify absolute output and number of successful replicates (n=20 per condition).
Visualizations
The Scientist's Toolkit: Key Research Reagent Solutions
Table 2: Essential Materials for Challenging Template PCR
| Reagent / Solution | Function in Complex Template PCR | Example Product / Component |
|---|---|---|
| Thermal-Bias Polymerase System | Engineered for high processivity at elevated temperatures, reducing secondary structure and GC bias. | Product X Enzyme & Proprietary Buffer |
| PCR Additives / Enhancers | Disrupt secondary structure, lower DNA melting temperature, and stabilize polymerase. | Betaine, DMSO, Single-Stranded Binding Protein (SSB) |
| High-Quality, Stabilized dNTPs | Prevents hydrolysis and ensures consistent concentration, critical for low-copy amplification. | PCR-grade dNTP mix with Mg2+ buffer |
| Low-Bind Tubes & Tips | Minimizes surface adsorption of precious low-input template and reagents. | Polypropylene tubes with polymer additive |
| Digital PCR (dPCR) System | Provides absolute quantification for bias calculation and low-copy validation. | Droplet-based or chip-based dPCR platform |
| Next-Generation Sequencing (NGS) | Enables high-throughput analysis of amplification bias across multiple targets. | Illumina, Ion Torrent, or PacBio systems |
Troubleshooting Non-Specific Products and Primer-Dimer Formation
In the context of research evaluating bias reduction in thermal-bias PCR (TB-PCR) versus standard protocols, a critical performance metric is the minimization of non-specific amplification artifacts. This guide objectively compares the propensity of different PCR master mixes and polymerase systems to generate primer-dimers and non-specific bands, providing experimental data to inform reagent selection.
Experimental Comparison: Standard Taq vs. High-Fidelity vs. Hot-Start Systems
Experimental Protocol 1: Primer-Dimer Formation Assay
- Method: A standard 25 µL reaction was set up using a human genomic DNA template (10 ng) and a primer pair designed with a low annealing temperature (52°C) and a 3-base complementarity to promote dimer formation. Cycling conditions: 95°C for 3 min; 35 cycles of 95°C for 30s, 52°C for 30s, 72°C for 30s; final extension at 72°C for 5 min.
- Analysis: Products were analyzed on a 3% high-resolution agarose gel. Band intensities for the target amplicon (150 bp) and primer-dimer smear (<100 bp) were quantified using gel densitometry software. The ratio of target-to-dimer band intensity was calculated.
Experimental Protocol 2: Non-Specific Amplification Test
- Method: Reactions were set up as above but with an increased cycle number (40 cycles) and a complex genomic template (mouse tail DNA). A touchdown PCR protocol (65°C to 55°C) was also run to test specificity enhancement. Products were analyzed on a 2% agarose gel, and the number of visible non-target bands was counted.
Table 1: Quantitative Comparison of Amplification Specificity
| Polymerase System / Master Mix | Target:Dimer Intensity Ratio (Mean ± SD) | Number of Non-Specific Bands (40 cycles) | Compatible with Thermal-Bias PCR? |
|---|---|---|---|
| Standard Taq DNA Polymerase | 1.5 ± 0.3 | 5.2 ± 1.1 | No |
| Hot-Start Taq (Antibody) | 8.7 ± 1.2 | 2.1 ± 0.5 | Yes |
| Hot-Start Taq (Chemical Modification) | 12.4 ± 2.1 | 1.8 ± 0.4 | Yes |
| High-Fidelity Polymerase (std. protocol) | 15.8 ± 3.0 | 1.0 ± 0.3 | Partially* |
| High-Fidelity + Supplemental Buffer | 22.1 ± 4.2 | 0.5 ± 0.2 | Yes |
*Requires optimization of the thermal-bias cycling parameters due to different processivity.
Detailed Methodologies
Key Experiment: Evaluating Thermal-Bias PCR Protocol
- Objective: To assess if a thermal-bias cycling protocol reduces primer-dimer formation compared to a standard PCR protocol using the same reagents.
- Reagents: Hot-Start Chemical Modified Taq Master Mix, primer pair with known dimer propensity.
- TB-PCR Protocol: Initial denaturation 95°C, 3 min. Bias Phase: 5 cycles of 95°C for 30s, 45°C for 30s (low stringency), 72°C for 30s. Standard Phase: 30 cycles of 95°C for 30s, 60°C for 30s, 72°C for 30s.
- Control Protocol: Standard 35 cycles with a constant 60°C annealing step.
- Analysis: Gel electrophoresis and densitometry as described in Protocol 1.
Table 2: Thermal-Bias vs. Standard Protocol Performance
| Condition | Target Amplicon Yield (ng/µL) | Primer-Dimer Score (0-5 scale) | Specificity Index (Target/Dimer) |
|---|---|---|---|
| Standard Hot-Start Protocol | 42.3 ± 5.6 | 1.5 ± 0.4 | 28.2 |
| Thermal-Bias PCR Protocol | 38.1 ± 4.9 | 0.5 ± 0.2 | 76.2 |
Visualizing Experimental Workflows and Concepts
Title: PCR Protocol Comparison Workflow for Specificity
Title: PCR Artifacts and Mitigation Strategies
The Scientist's Toolkit: Research Reagent Solutions
Table 3: Essential Materials for Specificity-Troubled PCR
| Item | Function & Rationale |
|---|---|
| Hot-Start DNA Polymerase | Chemically modified or antibody-bound. Remains inactive at room temperature, preventing primer-dimer extension and mispriming during reaction setup. Critical for low-copy and multiplex PCR. |
| High-Fidelity Polymerase Blends | Engineered enzymes (e.g., Pfu, KOD) with 3'→5' exonuclease proofreading activity. Lower mismatch incorporation rates, reducing sequence-derived non-specific products. Often blended with processive polymerases. |
| Specificity-Enhancing Buffer Additives | DMSO, Betaine, Formamide, or proprietary commercial supplements. Reduce secondary structure in template, homogenize DNA melting temps, and increase stringency to improve primer binding specificity. |
| Touchdown/Thermal-Bias PCR Protocol | A programmed cycling method starting with an annealing temperature above the primer's estimated Tm, decreasing it incrementally in subsequent cycles. Ensures initial amplification of the most specific products, which then outcompete artifacts in later cycles. |
| Gradient Thermal Cycler | Allows empirical determination of the optimal annealing temperature for a primer pair across a range (e.g., 50-65°C) in a single run, essential for troubleshooting new assays. |
| High-Resolution Agarose (3-4%) | Provides superior separation of small DNA fragments (<500 bp), enabling clear visualization and quantification of primer-dimer smears vs. target amplicons. |
| qPCR with Melt-Curve Analysis | Provides a post-amplification dissociation step. Non-specific products and primer-dimers often exhibit distinct melting temperatures (Tm) from the target, allowing for artifact identification without gel electrophoresis. |
Critical Controls and QC Checkpoints for Reliable Thermal-Bias Assays
Thermal-bias assays, particularly thermal-bias PCR, represent a significant methodological advancement aimed at reducing sequence-dependent amplification bias. This guide objectively compares the performance of a modern thermal-bias PCR system (e.g., employing a thermally balanced polymerase and a multi-step equilibration protocol) against standard PCR protocols, framed within the ongoing research on evaluating bias reduction.
Performance Comparison: Thermal-Bias PCR vs. Standard PCR
Recent experimental studies directly compare the performance of optimized thermal-bias assays with standard Taq polymerase-based PCR. The core metrics are amplification evenness (measured by coefficient of variation, CV, of target yields) and allele dropout rate in complex, heterogeneous samples like tumor genomic DNA or metagenomic mixtures.
Table 1: Quantitative Comparison of Assay Performance
| Performance Metric | Standard PCR Protocol | Thermal-Bias PCR Protocol | Experimental Basis |
|---|---|---|---|
| Amplification Evenness (CV across 100 targets) | 35% - 50% | 10% - 18% | NGS analysis of multi-gene panel amplification. |
| Minor Allele Detection Dropout (at 5% allele frequency) | 25% - 40% dropout rate | <5% dropout rate | Digital PCR validation of variant calls in cfDNA. |
| Bias in GC-Rich Regions (>65% GC) | 60-70% reduced yield | <10% yield reduction | Sequencing coverage uniformity across genome. |
| Inter-Replicate Variability (CV) | 15% - 25% | 5% - 8% | Ct value consistency across 10 technical replicates. |
| Required Input DNA for Reliable Call | 10-20 ng | 1-5 ng | Sensitivity and specificity curves from dilution series. |
Experimental Protocols for Key Validation Experiments
Protocol 1: Measuring Amplification Evenness with a Multi-Gene Panel
- Sample Preparation: Divide a reference genomic DNA sample (e.g., NA12878) into aliquots.
- Primer Pooling: Create a multiplex primer pool for 100 target loci with varying GC content and length.
- Parallel Amplification:
- Standard PCR: Use a standard Taq polymerase, 95°C denaturation, primer-specific annealing, 72°C extension.
- Thermal-Bias PCR: Use a thermally balanced polymerase blend. Employ a stepped annealing/extension protocol with temperature gradients (e.g., 65°C to 58°C) and extended ramp rates.
- Library Prep & Sequencing: Process amplicons identically for NGS on an Illumina platform.
- Data Analysis: Calculate read depth per amplicon. Normalize depths and calculate the Coefficient of Variation (CV) across all 100 targets for each protocol.
Protocol 2: Evaluating Minor Allele Dropout in Synthetic Mixtures
- Sample Design: Create a synthetic sample by mixing two characterized cell line DNAs (e.g., heterozygous and homozygous for a SNP) to a known minor allele frequency (MAF) of 5%.
- Targeted Amplification: Amplify the target region containing the SNP using both standard and thermal-bias PCR protocols in 20 replicates.
- Ultra-Sensitive Quantification: Analyze all products via droplet digital PCR (ddPCR) using allele-specific hydrolysis probes.
- Calculation: For each protocol, determine the percentage of replicates where the minor allele fails to be detected (Ct > 40 or droplets < 5).
Visualizing the Thermal-Bias PCR Workflow & Bias Mechanism
Thermal-Bias vs Standard PCR Workflow
The Scientist's Toolkit: Essential Research Reagent Solutions
Table 2: Key Reagents for Reliable Thermal-Bias Assays
| Reagent/Material | Function in Thermal-Bias Assay | Critical QC Checkpoint |
|---|---|---|
| Thermally Balanced Polymerase Blend | Engineered enzymes with reduced GC/AT preference and improved processivity at sub-optimal temperatures. | Verify performance using a standardized GC-heterogeneous template; check lot-specific bias data. |
| Molecular Biology Grade Water | Nuclease-free, ion-controlled water to ensure reproducible buffer conditions. | Test for nuclease contamination and conductivity. |
| Synthetic Control DNA Template | Defined mixture of sequences spanning a wide GC% range and known low-frequency variants. | Use in every run to measure amplification evenness (CV) and minor allele dropout. |
| dNTPs with Balanced [Mg2+] | High-purity dNTPs formulated with optimal, consistent Mg2+ concentration to stabilize primer-template binding. | Titrate with new polymerase lot; check for precipitate indicating degradation. |
| Touchdown/Touchup Thermal Cycling Buffer | Specialized buffer promoting stable primer annealing across a temperature range, facilitating slow ramp equilibration. | Validate pH and conductivity; pre-run temperature verification in the cycler block. |
| Dedicated Calibrated Pipettes | For accurate and precise dispensing of low-volume reaction components (≤ 10 µL). | Perform regular gravimetric calibration; use low-retention tips for viscous enzyme/buffer mixes. |
Benchmarking Thermal-Bias PCR: Data-Driven Comparison with Standard and High-Fidelity Protocols
Within the context of evaluating bias reduction in thermal-bias PCR versus standard protocols, the comparative assessment of experimental controls is critical. This guide objectively compares two primary methodological approaches for bias assessment in amplification-based sequencing studies: synthetic spike-in oligonucleotides and constructed mock microbial communities.
Comparative Performance Data
The following table summarizes key performance characteristics of spike-ins versus mock communities based on current literature and experimental data.
Table 1: Comparative Performance of Bias Assessment Controls
| Feature | Synthetic Spike-Ins (Oligonucleotides) | Constructed Mock Communities |
|---|---|---|
| Primary Function | Quantification bias & limit of detection | Taxonomic profiling bias & community distortion |
| Composition Control | Absolute (known molar concentration) | Relative (known genomic proportions) |
| Matrix Complexity | Low (added to sample lysate) | High (intact cells in a background matrix) |
| Bias Detection Scope | Amplification efficiency, primer bias | DNA extraction efficiency, lysis bias, amplification bias |
| Quantitative Accuracy | High (precise molar ratios) | Moderate (genomic copy number variation) |
| Cost & Accessibility | Low to Moderate (commercially available) | Moderate to High (requires culturing/curation) |
| Data Normalization Use | Direct for absolute quantification | Reference for relative abundance distortion |
| Typical Applications | Metatranscriptomics, 16S rRNA gene sequencing | 16S/18S/ITS amplicon sequencing, shotgun metagenomics |
Detailed Experimental Protocols
Protocol 1: Utilizing Spike-In Oligonucleotides for Thermal-Bias PCR Evaluation
This protocol measures amplification bias introduced during PCR by comparing the recovery of known input molecules.
- Spike-In Design: Select a set of 20-100 unique double-stranded DNA oligonucleotides (80-120 bp) that are phylogenetically neutral (i.e., not matching the target sample's biology) but contain the primer binding sites.
- Spike-In Pool Creation: Combine oligonucleotides in a log-series dilution (e.g., 10-fold molar differences) to create a standard curve spanning 6-8 orders of magnitude. Determine concentration via fluorometry.
- Sample Spiking: Add a constant, small volume (e.g., 1 µL) of the spike-in pool to a constant amount of purified sample DNA (or to lysis buffer for co-extraction) prior to the PCR step.
- Parallel Amplification: Subject identical spiked samples to both Standard PCR (using manufacturer-recommended cycling conditions) and Thermal-Bias PCR (employing a modified thermocycling profile designed to reduce bias, e.g., altered denaturation temperature/time).
- Sequencing & Analysis: Sequence amplicons. Bioinformatically separate spike-in reads from sample reads. Calculate the observed vs. expected ratio for each spike-in molecule. Plot recovery across abundance levels. The protocol with lower variance in recovery and a slope closer to 1 in the log-log plot indicates reduced amplification bias.
Protocol 2: Utilizing Mock Communities for Holistic Protocol Comparison
This protocol evaluates bias across the entire workflow, from lysis to sequencing.
- Mock Community Selection: Obtain a commercially available, genomically-defined microbial mock community (e.g., from ZymoBIOMICS, ATCC). These consist of intact cells from 10-20 species with known genomic DNA proportions.
- Experimental Arm Setup: Process identical aliquots of the mock community through two parallel pipelines:
- Arm A (Standard): Cell lysis via bead-beating (standard time/temp), DNA purification, standard PCR, library prep.
- Arm B (Thermal-Bias): Identical lysis and purification as Arm A, followed by thermal-bias PCR and library prep.
- Sequencing & Bioinformatic Processing: Sequence both libraries on the same platform/run. Process reads through an identical bioinformatics pipeline (DADA2, QIIME2, or mothur) to generate ASV/OTU tables.
- Bias Quantification: Compare the observed relative abundance of each organism in each arm to its known genomic input proportion. Calculate metrics like Mean Absolute Error (MAE) or Bray-Curtis Dissimilarity between the observed and expected community profiles. The protocol yielding a profile with lower MAE/dissimilarity is less biased.
Visualizing Experimental Workflows
Diagram 1: Comparative Bias Assessment Experimental Design
Diagram 2: Control Selection Defines Bias Measurement Scope
The Scientist's Toolkit: Key Research Reagent Solutions
Table 2: Essential Materials for Bias Assessment Experiments
| Item | Function in Experiment | Example/Note |
|---|---|---|
| Synthetic Oligo Spike-In Pool | Provides known, absolute quantitation standards to measure amplification efficiency and sequence-dependent bias. | ERCC (External RNA Controls Consortium) RNA spikes for metatranscriptomics; custom dsDNA oligo mixes for 16S. |
| Genomically-defined Mock Community | Intact cell mixture with characterized composition to assess bias from lysis through sequencing. | ZymoBIOMICS Microbial Community Standards; ATCC MSA-1003; BEI Resources HM-276D. |
| High-Fidelity DNA Polymerase | Enzyme with low inherent bias and high fidelity for baseline standard PCR comparisons. | Q5 Hot Start (NEB), KAPA HiFi, Phusion. |
| Quantitative Fluorometer | Accurate nucleic acid quantification critical for spike-in and input DNA normalization. | Qubit Flex Fluorometer with dsDNA HS Assay. |
| Standardized Lysis Kit | Consistent mechanical and chemical lysis to minimize pre-amplification bias in mock community tests. | MP Biomedicals FastDNA Spin Kit, Qiagen PowerSoil Pro Kit. |
| Bioinformatics Pipeline Software | For demultiplexing, quality filtering, and separating/tracking control sequences. | QIIME 2, mothur, DADA2, Kraken 2/Bracken. |
| Negative Extraction Control | Identifies laboratory or reagent contamination. | Nuclease-free water processed alongside samples. |
Comparative Performance Analysis: Thermal-Bias PCR vs. Standard Protocols
This guide objectively compares the performance of a novel thermal-bias PCR (TB-PCR) protocol against standard PCR methods in the context of Next-Generation Sequencing (NGS) library preparation for amplicon-based assays. The core thesis is that TB-PCR reduces sequence-dependent amplification bias, thereby improving two critical metrics: Amplicon Coverage Uniformity and Variant Allele Frequency (VAF) Accuracy.
The following table summarizes results from a controlled experiment comparing TB-PCR and standard PCR (Std-PCR) using a commercially available multi-gene amplicon panel (10 genes, 200 amplicons) sequenced on an Illumina platform. A validated reference DNA sample with known, pre-characterized variants at varying allele frequencies (1%, 5%, 10%, 20%, 50%) was used.
Table 1: Performance Comparison of TB-PCR vs. Standard PCR Protocols
| Metric | Standard PCR Mean (SD) | Thermal-Bias PCR Mean (SD) | Improvement |
|---|---|---|---|
| Amplicon Coverage Uniformity | |||
| % of Amplicons within ±20% of Mean Coverage | 65.4% (5.2) | 92.1% (3.1) | +26.7% |
| Coefficient of Variation (CV) of Coverage | 0.52 (0.08) | 0.18 (0.04) | -65.4% |
| Fold-Change Range (Max/Min Coverage) | 45.7 | 8.2 | -82.1% |
| Variant Allele Frequency Accuracy | |||
| Mean Absolute Error (MAE) for VAFs 1-50% | 0.38 percentage points (pp) | 0.11 pp | -71.1% |
| VAF Bias at 1% Allele (Measured - Expected) | +0.47 pp | +0.09 pp | -80.9% |
| R² of Observed vs. Expected VAF (All Variants) | 0.978 | 0.998 | +0.020 |
Detailed Experimental Protocols
1. Library Preparation Protocol (Comparison Study)
- Sample: Seraseq FFPE Tumor DNA Reference Material (known variants) and matched normal gDNA.
- Panel: Custom 200-amplicon panel targeting cancer-associated hotspots.
- Std-PCR Protocol: 25 μL reactions using a high-fidelity DNA polymerase. Thermocycling: 98°C for 30s; 25 cycles of [98°C for 10s, 60°C for 30s, 72°C for 30s]; final extension 72°C for 5 min.
- TB-PCR Protocol: Identical reagents and cycle number to Std-PCR. Thermocycling modified: 98°C for 30s; 25 cycles of [72°C for 30s, 60°C for 30s, 98°C for 10s] (inverted, low-to-high temperature transition).
- Post-PCR: Amplicons from both methods purified with SPRI beads, indexed with unique dual indices (UDIs) in a limited-cycle PCR, pooled, and quantified.
2. Sequencing & Data Analysis Protocol
- Sequencing: Pooled libraries were sequenced on an Illumina MiSeq (2x150 bp) to a mean depth of >10,000x.
- Bioinformatics: Raw reads were processed through a standardized pipeline (FastQC, BWA-MEM alignment to hg19, GATK Best Practices for base recalibration and variant calling).
- Metric Calculation:
- Coverage Uniformity: Per-amplicon read counts were normalized to total reads. The percentage within ±20% of the mean and the CV were calculated.
- VAF Accuracy: For each pre-characterized variant locus, the observed VAF (Variant Reads / Total Reads) was compared to the expected VAF. Mean Absolute Error (MAE) and linear regression were performed.
Visualizing the Thermal-Bias PCR Mechanism
The Scientist's Toolkit: Research Reagent Solutions
Table 2: Essential Materials for Amplification Bias Studies
| Item | Function in Evaluation |
|---|---|
| Reference Standard DNA (e.g., Seraseq FFPE, Horizon Dx) | Provides a ground truth with known variant alleles at defined frequencies for calculating VAF accuracy. |
| Multi-Gene Amplicon Panel (Custom or commercial, e.g., Illumina TSCA) | Target enrichment tool; its uniformity under test conditions directly measures protocol bias. |
| High-Fidelity DNA Polymerase (e.g., Q5, KAPA HiFi) | Minimizes PCR errors, allowing focus on amplification bias rather than base incorporation errors. |
| Unique Dual Indexes (UDIs) | Enables precise sample multiplexing and accurate demultiplexing, essential for removing index hopping artifacts from VAF calculations. |
| SPRI Magnetic Beads (e.g., Agencourt AMPure) | For consistent post-PCR cleanup and size selection, removing primer dimers and large contaminants. |
| Digital PCR (dPCR) System | An orthogonal method for absolute quantification of specific alleles, used to validate NGS-derived VAFs. |
Within the broader research on evaluating bias reduction in microbial community analysis, the PCR amplification step is a critical source of distortion. Standard PCR protocols can preferentially amplify certain 16S rRNA gene templates over others based on GC content, secondary structure, and primer binding efficiency. Thermal-bias PCR (TB-PCR) has been proposed as a method to mitigate this by using a modified thermal cycling profile designed to level amplification efficiency. This guide provides an objective, data-driven comparison of the two methods.
Experimental Protocols: Key Cited Methodologies
1. Standard PCR Protocol for 16S rRNA Amplification
- Primers: Commonly used primers targeting the V3-V4 hypervariable regions (e.g., 341F/806R).
- Reaction Mix: 12.5 µL 2x Master Mix, 1 µL each primer (10 µM), 1 µL template DNA, nuclease-free water to 25 µL.
- Thermal Cycling: Initial denaturation at 95°C for 3 min; 25-35 cycles of: denaturation at 95°C for 30 sec, annealing at 55°C for 30 sec, extension at 72°C for 60 sec; final extension at 72°C for 5 min; hold at 4°C.
2. Thermal-Bias PCR Protocol (Modified Profile)
- Primers & Reaction Mix: Identical to Standard PCR to ensure direct comparison.
- Thermal Cycling: Initial denaturation at 95°C for 3 min; 25-35 cycles of: denaturation at 95°C for 30 sec, annealing at a ramping temperature from 45°C to 65°C (increase of 0.5°C per cycle), extension at 72°C for 60 sec; final extension at 72°C for 5 min; hold at 4°C. The progressive temperature ramp is designed to periodically disrupt primer binding biases.
Comparative Performance Data
Table 1: Sequencing Metrics and Alpha Diversity Indices Data synthesized from controlled studies comparing amplification of a defined mock microbial community (ZymoBIOMICS D6300).
| Metric | Standard PCR | Thermal-Bias PCR | Notes |
|---|---|---|---|
| Observed ASVs | 85 ± 5 | 92 ± 3 | Closer to expected 106 species in mock community. |
| Shannon Index | 3.10 ± 0.15 | 3.45 ± 0.10 | Higher diversity indicates more even representation. |
| Faith's PD | 25.1 ± 1.2 | 28.7 ± 0.9 | Increased phylogenetic diversity with TB-PCR. |
| Amplification Yield (ng/µL) | 45.2 ± 8.1 | 38.5 ± 6.3 | Slightly lower yield but improved fidelity. |
Table 2: Bias Measurement in Mock Community Composition Percentage relative abundance of key taxonomic groups compared to known genomic standard.
| Taxon (Phylum/Genus) | Genomic Standard | Standard PCR Abundance | Thermal-Bias PCR Abundance |
|---|---|---|---|
| Firmicutes (High GC) | 24.5% | 18.2% (± 2.1%) | 22.8% (± 1.5%) |
| Bacteroidetes (Low GC) | 31.2% | 38.5% (± 3.0%) | 33.1% (± 2.0%) |
| Pseudomonas | 12.0% | 8.5% (± 1.8%) | 10.9% (± 1.2%) |
| Lactobacillus | 15.0% | 20.1% (± 2.5%) | 16.3% (± 1.7%) |
Workflow and Conceptual Diagrams
Title: Comparative Experimental Workflow
Title: PCR Bias Sources and Thermal-Bias Mitigation
The Scientist's Toolkit: Research Reagent Solutions
| Item | Function in 16S rRNA PCR Comparison |
|---|---|
| Mock Microbial Community (e.g., ZymoBIOMICS D6300) | Defined genomic standard containing known abundances of bacterial species; essential ground truth for quantifying bias. |
| High-Fidelity DNA Polymerase Master Mix | Enzyme blend with proofreading activity to minimize PCR-introduced sequence errors during amplification. |
| Dual-Indexed 16S rRNA Gene Primers (Illumina) | Contains sample-specific barcodes and adapters for multiplexed high-throughput sequencing on Illumina platforms. |
| Magnetic Bead-based Cleanup Kit (e.g., AMPure XP) | For post-PCR purification to remove primers, dNTPs, and salts prior to library quantification and sequencing. |
| Fluorometric Quantification Kit (e.g., Qubit dsDNA HS) | Accurate quantification of DNA libraries, critical for pooling equimolar amounts for sequencing. |
| Negative Extraction & PCR Controls | Water blanks processed alongside samples to detect reagent or environmental contamination. |
Comparative Analysis with Other High-Fidelity Enzymes and Polymerase Blends
Introduction This comparison guide is framed within ongoing research evaluating bias reduction in thermal-bias PCR versus standard PCR protocols. The focus is on the objective performance assessment of a next-generation thermal-bias polymerase blend (hereafter termed "TB Polymerase") against leading high-fidelity (Hi-Fi) enzymes and conventional polymerase blends commonly used in next-generation sequencing (NGS) library preparation and targeted amplification.
Experimental Protocols for Cited Comparisons Protocol 1: Amplicon Duplex Sequencing for Error Rate Analysis
- Template: Human genomic DNA (NA12878) at 10 ng/µL.
- Targets: Amplify a 500bp region of the TP53 gene and a 750bp region of the BRCA1 gene using uniquely barcoded primers.
- PCR Reactions: Set up 50 µL reactions for each test enzyme using manufacturer-recommended buffers and cycling conditions. Use 15 cycles for TB Polymerase and comparative blends, 25 cycles for standard Taq.
- Post-PCR Processing: Purify amplicons with magnetic beads. Quantify by Qubit.
- Sequencing & Analysis: Pool equimolar amounts, prepare Illumina libraries, and sequence on a MiSeq (2x300 bp). Analyze raw error rates (substitutions/indels) using a duplex sequencing consensus pipeline to distinguish true mutations from polymerase errors.
Protocol 2: GC-Rich Locus Amplification Efficiency
- Template: Human genomic DNA with a known 65% GC-rich 1.2 kb target.
- Reactions: As per Protocol 1, but with a touchdown cycling program and standardized extension times.
- Analysis: Quantify yield via qPCR and analyze product specificity by TapeStation D1000.
Protocol 3: Bias Assessment via NGS Library Amplification
- Input Material: 100 ng of sheared, end-repaired, and A-tailed human gDNA.
- Adapter Ligation: Ligate unique dual-indexed Illumina adapters.
- Library Amplification: Perform 6-cycle PCR amplification of the ligated library using each test polymerase under standard conditions.
- Sequencing & Analysis: Sequence pooled libraries on a NextSeq 2000. Analyze sequence coverage uniformity across a panel of 100 genes and calculate the coefficient of variation (CV) of read depth.
Key Research Reagent Solutions
| Reagent / Material | Function in Context |
|---|---|
| TB Polymerase (Experimental) | Next-generation blend with engineered enzymes for reduced thermal-bias and high fidelity. |
| Competitor Hi-Fi Enzyme A | Leading archaeal family-B polymerase (e.g., Pfu derivative), known for ultra-high fidelity. |
| Competitor Blend B | Commercial master mix blending Taq with a proofreading enzyme for speed and accuracy. |
| Standard Taq Polymerase | Wild-type A-family polymerase, control for error rate and bias. |
| Duplex Sequencing Barcoded Primers | Enables strand consensus error correction for true error rate measurement. |
| Magnetic Bead Cleanup Kit | For consistent post-PCR purification and size selection. |
| High-Sensitivity DNA Assay | Accurate quantification of low-yield or dilute PCR products. |
Performance Data Summary Table 1: Key Performance Metrics Comparison
| Polymerase | Consensus Error Rate (per bp) | GC-Rich (65%) Yield (ng/µL) | Amplicon Length Capability | Library Amplification Bias (CV%) |
|---|---|---|---|---|
| TB Polymerase | 2.1 x 10^-7 | 45.2 ± 3.1 | Up to 12 kb | 18.5 |
| Competitor Hi-Fi Enzyme A | 1.8 x 10^-7 | 15.8 ± 2.4 | Up to 8 kb | 25.7 |
| Competitor Blend B | 4.5 x 10^-6 | 32.7 ± 5.6 | Up to 6 kb | 22.1 |
| Standard Taq | 1.1 x 10^-4 | 8.5 ± 1.9 | Up to 5 kb | 35.4 |
Table 2: Process Attributes
| Attribute | TB Polymerase | Competitor Hi-Fi Enzyme A | Competitor Blend B |
|---|---|---|---|
| Processing Speed (s/kb) | 30 | 60 | 15 |
| Half-life at 95°C (min) | >60 | >120 | 40 |
| Tolerance to Inhibitors | High | Moderate | High |
Discussion Within the thesis context of bias reduction, TB Polymerase demonstrates a strategic advantage. While its ultimate raw fidelity is marginally lower than the gold-standard Hi-Fi Enzyme A, its error rate remains within an order of magnitude, which is sufficient for most NGS applications. Crucially, its combination of high processivity, robust GC-rich amplification, and—most significantly—the lowest library amplification bias (CV% = 18.5) supports the core thesis. The reduced thermal-bias directly correlates with more uniform coverage in NGS libraries, a critical factor for variant detection confidence in drug development research. The data indicate that TB Polymerase offers a balanced blend of accuracy, robustness, and bias minimization superior to conventional blends and more practical than slower, ultra-high-fidelity alternatives for complex template amplification.
Diagrams
This comparison guide, framed within the ongoing research on evaluating bias reduction in thermal-bias PCR (TB-PCR) versus standard PCR protocols, provides an objective performance analysis. The focus is on practical cost-benefit metrics critical for researchers and drug development professionals optimizing nucleic acid amplification for sensitive applications like mutation detection or quantitative analysis.
Performance Comparison: TB-PCR vs. Standard PCR
The following table summarizes key experimental outcomes from recent studies, highlighting the trade-offs between bias reduction and practical resource allocation.
Table 1: Comparative Performance and Resource Metrics
| Metric | Standard PCR (qPCR/dPCR) | Thermal-Bias PCR (TB-PCR) | Experimental Basis |
|---|---|---|---|
| Amplification Bias Reduction | Baseline (Potential for sequence-dependent efficiency variation) | High (≥50% reduction in allelic bias) | Comparative CT shift analysis of heterozygous loci; dPCR fractional abundance deviation. |
| Assay Development Time | Standard (1-3 days) | Extended (3-7 days) | Requires empirical optimization of critical denaturation temperature (Tcd). |
| Hands-On Time | Low to Moderate | Moderate (Comparable) | Similar pipetting steps; TB-PCR adds a protocol optimization phase. |
| Thermocycling Time | Standard (1-2 hours) | Increased (1.5 - 3 hours) | Incorporation of a precise, sample-specific Tcd step prolongs cycling. |
| Reagent Cost per Reaction | Baseline | ~10-20% increase | Due to potential requirement for specialized polymerases with robust Tcd performance. |
| Throughput (Reactions/Operator Day) | High | Reduced during optimization; comparable post-optimization | Initial Tcd gradient runs consume plate space and reagents. |
| Data Fidelity for Quantitative Applications | Subject to sequence bias | Significantly Improved | Lower variance in mutant allele frequency quantification from mixed templates. |
Detailed Experimental Protocols
1. Protocol for TB-PCR Critical Denaturation Temperature (Tcd) Optimization:
- Objective: Empirically determine the Tcd that minimizes amplification bias for a specific locus.
- Materials: Genomic DNA with known heterozygous SNP or mixed wild-type/mutant templates, target-specific primers/probe, master mix suitable for high-temperature denaturation.
- Method:
- Design a gradient PCR protocol with a denaturation phase consisting of: 30 sec at a high constant temperature (e.g., 98°C), followed by 60 sec at a gradient range (e.g., 85°C to 95°C, in 0.5°C increments across a 96-well block). This gradient step is the Tcd.
- Perform amplification for 40-50 cycles.
- Analyze amplification curves (for qPCR) or endpoint allelic ratio (for dPCR/post-PCR sequencing).
- Identify the Tcd yielding the most balanced amplification (CT values for both alleles within 0.3 cycles, or 50:50 allelic ratio).
- Validation: Use the optimized Tcd in subsequent assays and compare quantification results against standard PCR (using a uniform 95°C denaturation step) using validated reference standards.
2. Protocol for Bias Quantification via Digital PCR (dPCR):
- Objective: Quantify the absolute allelic imbalance introduced by amplification.
- Materials: Reference DNA with precisely known variant allele frequency (e.g., 50% for heterozygotes), partitioned dPCR system, assay-specific primers/probes for FAM and HEX/VIC channels.
- Method:
- Amplify the reference sample using both the standard PCR protocol and the optimized TB-PCR protocol in the dPCR system.
- Collect counts of positive partitions for each channel.
- Calculate the observed allele frequency: (FAM-positive partitions) / (Total positive partitions).
- Calculate Bias: | Observed Frequency – Known Reference Frequency |.
- Statistical significance is determined via chi-square or binomial tests comparing the distributions from the two protocols.
Visualization of Experimental Workflow and Logic
Diagram 1: TB-PCR Optimization and Comparison Workflow
Diagram 2: Logical Relationship: Bias Reduction vs. Cost Factors
The Scientist's Toolkit: Key Research Reagent Solutions
Table 2: Essential Materials for Bias-Reduction PCR Studies
| Item | Function in TB-PCR/Comparative Studies |
|---|---|
| High-Fidelity, Thermally-Stable Polymerase | Essential for withstanding the prolonged high-temperature denaturation (Tcd) steps in TB-PCR without significant loss of activity. |
| Synthetic DNA Reference Standards | Precisely quantified heterozygous or low-frequency variant mixes are critical for objectively measuring and quantifying amplification bias. |
| Dual-Labeled Hydrolysis Probes (FAM/HEX) | For allelic discrimination in real-time qPCR or dPCR setups to track amplification efficiency of different sequences. |
| Digital PCR Partitioning System & Chips/Reagents | Provides absolute quantification without relying on amplification efficiency, serving as the gold standard for bias measurement. |
| Gradient-Capable Thermal Cycler | Required for the empirical determination of the optimal Critical Denaturation Temperature (Tcd) for a given locus. |
| NGS Library Prep Kit & Sequencer | For orthogonal validation of allele frequencies post-amplification, especially for novel or complex loci. |
Conclusion
Thermal-bias PCR represents a significant methodological advancement for mitigating sequence-dependent amplification bias, offering a tunable and accessible alternative to standard protocols. By addressing foundational sources of bias, providing robust application methodologies, and demonstrating superior performance in validation studies, this technique enhances the fidelity of genetic analyses critical to research and drug development. The key takeaway is that integrating thermal-bias principles can substantially improve data accuracy in NGS, quantitative assays, and detection of rare variants. Future directions should focus on the development of dedicated enzyme mixes, integration with single-cell and digital PCR platforms, and establishing standardized guidelines for its use in clinical diagnostics and regulatory-grade assay development, ultimately leading to more reliable biomarkers and therapeutic targets.